
18 marzo 2024
LIVES VERSUS LIVELIHOODS: THE COVID-19 TRADE-OFF FROM AN EPIDEMIOLOGICAL-ECONOMIC PERSPECTIVE
(synthesis; full article Vox Eu CEPR 7 Feb 2024 https://cepr.org/voxeu/columns/lives-versus-livelihoods-covid-19-trade-epidemiological-economic-perspective)
Abstract: The trade-off between ‘lives and livelihoods’ – i.e. more stringent public health and social measures at the cost of more acute economic losses – prompted a fierce debate during the COVID-19 pandemic. This column introduces an epidemiological-economic model to explore this debate from a firmer empirical footing. The model is calibrated for four Latin American countries and draws attention to the complex interplay of economic structures, health systems, and previous COVID-19 waves. The presence of a steep short-term trade-off between health and economics losses emphasises the relevance of targeted pharmaceutical policies, notably increased vaccination coverage.
Keywords. Pandemics, lockdown fatigue, public health interventions, Latin- America
Latin America and the Caribbean (LAC) was the region with the highest COVID-19-related death count worldwide (Msemburi et al. 2023), despite implementing stringent public health and social measures (PHSM). At the same time, these policies caused large short-term economic losses by reducing working hours in a sizable fraction of the labour force. In many cases, these short-term costs, mainly in terms of productivity losses and social isolation, were so high that policymakers and individuals were unable to sustain them. This, in turn, triggered a heated and broadly politicised ‘lives vs livelihood’ debate (Rothwell and Makridis 2020, Levy Yeyati and Malamus 2020), with wildly dissimilar government responses across the region despite the recognition that most economic losses in output (Levy Yeyati and Filippini 2021b) and human capital (de La Maisonneuve et al. 2023) were persistent, affecting lives in the long run. Yet, the question remained unanswered: what would have been the economic impact of tighter/looser PHSM?
To address this question, we built an integrated epidemiological-economic (epi-econ) model to evaluate, in hindsight, the epidemiological, economic, and social trade-offs involved in the PHSM decision, and calibrated it to four LAC countries – Argentina, Brazil, Mexico, and Jamaica – in the year with the highest death toll in the region, 2021 (Rubenstein et al. 2023). Our model, available at https://iecs.shinyapps.io/covid-model-v2/, is recursive: the outcome from the epidemiological side block impacts the economic outcomes, and vice versa, by incorporating a novel component: ‘lockdown fatigue’ (Levy Yeyati and Sartorio 2020), that is, the marginal compliance of the PHSM decreases with the stringency/length of the measures, and the drop of the death count (reflecting psychosocial and economic factors).
In line with the DAEDALUS model (Haw et al. 2022), if the policymaker has an ‘economy-focused’ approach, PHSM will ease and the mortality rate will likely increase. On the other hand, if the priority is to curb the case curve (a ‘safety-focused’ approach), the economy will have to endure a highly stringent and lengthy lockdown and a likely sizable decline in GDP. However, the lockdown fatigue limits the capacity of the policymaker to discourage mobility over time, constraining the effectiveness of prolonged PHSM policies.
The model
On the epidemiological side, our model provides a framework in which population dynamics are described in mathematical terms, capturing the number of people in separate compartments and the relationships between those compartments. We use an SVEIR transmission model (Augustovski et al. 2023), augmented with a macroeconomic and social impact model of the PHSM, adjusted for the different vaccination strategies in each country.
Figure 1 The SVEIR transmission model

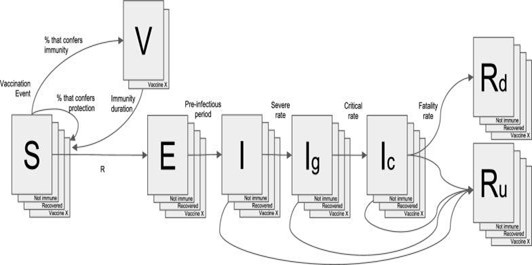
To improve the transmission dynamics, we incorporate specific age-strata mixing patterns matrices to represent the social interactions and effective contact rates at each of these four settings: home, school, work (including transportation), and community. Modified matrices are derived from a model representing the impact of PHSMs on each stratum (school closures, non-essential business and public transport restrictions, staying at home, shielding the elderly, mandatory masks, etc.)
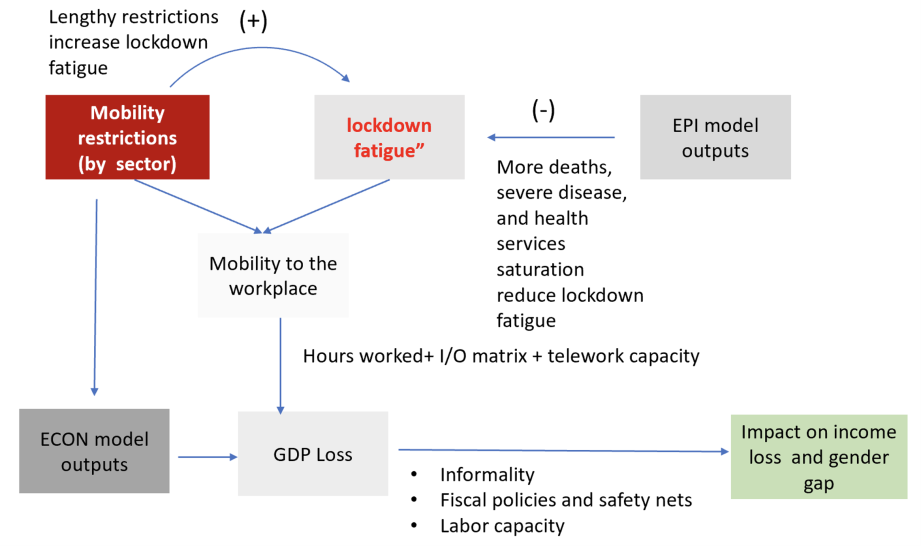
On the economic side, the model quantifies the GDP loss associated with mobility restrictions, incorporating the interaction of the lockdown measures with the behaviour of the population (‘lockdown fatigue’, estimated as the time-varying degree of compliance with mobility measures).
The main link between the PHSM and the economic impact works through the reduction in working hours. The stringency of the mobility restrictions precludes workers to get to the workplaces, effectively reducing the workings hours and producing an economic loss. We assumed that, prior to the PHSM, workers put an ‘optimal’ amount of hours into work; with PHSM in place, a share of workers is unable to go to their workplaces, reducing economic output (although we account for the fact that some work can be done remotely) and workplace mobility (in turn, viral spread).
In order to quantify the GDP loss, we need a detailed structure of the economic activity of the country, as more labour-intensive economies will be more exposed to mobility restrictions, and more informality in labour intensive sectors will amplify the GDP loss and the need for fiscal support to attenuate the impact of PHSM on the GDP loss. To map the impact of reduced mobility on GDP, we use sectoral value added and labour shares. Moreover, we calibrated incorporated differences in transitioning into remote working across sectors of the economy and countries.
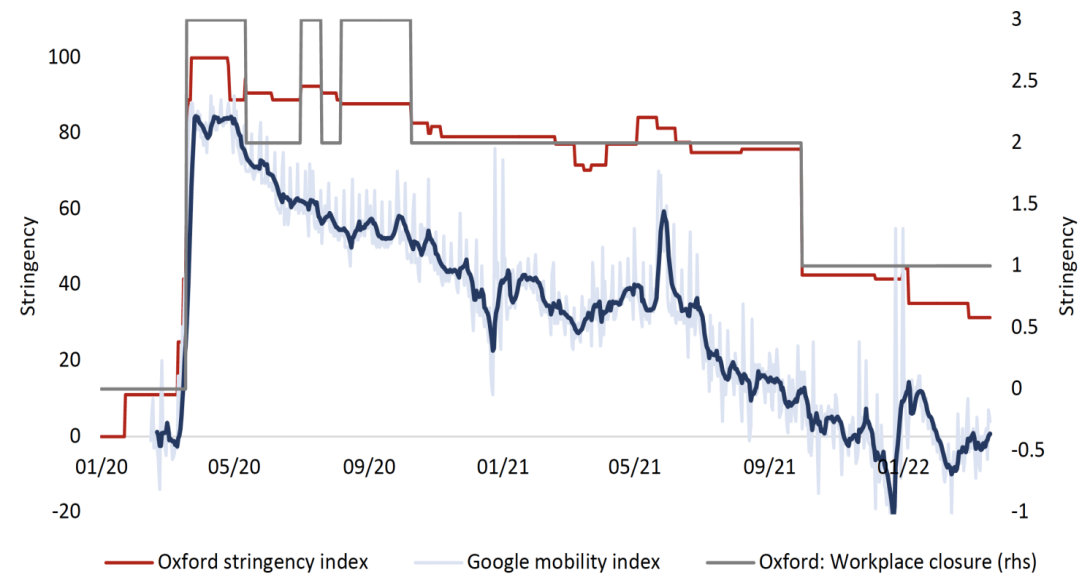
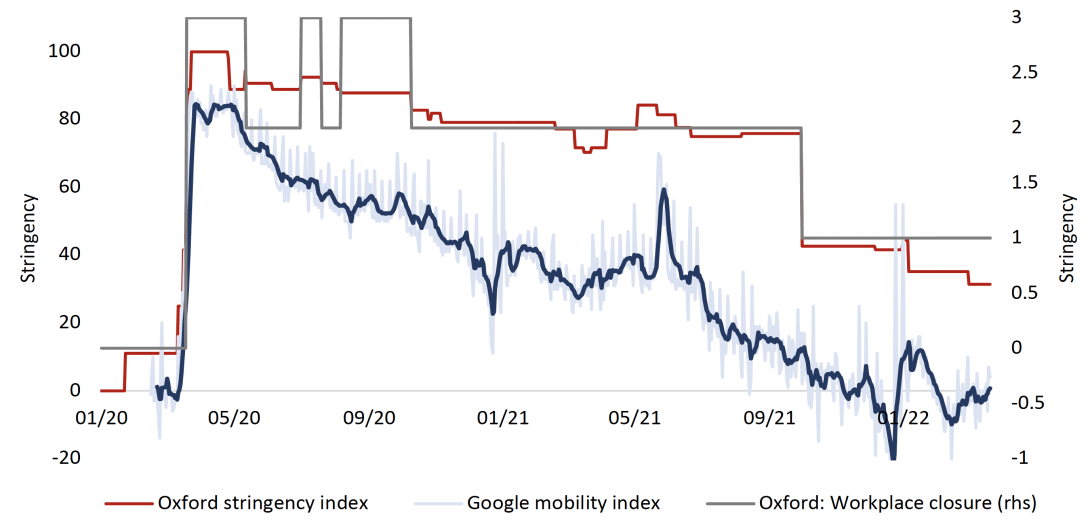
Lockdown fatigue reflects both the increasing psychosocial burden of isolation, including living conditions, and a growing income need, particular taxing for low-income households and informal workers, leading to a decreasing effectiveness of PHSM policies (Levy Yeyati et al. 2021). We estimate a relationship between mobility restrictions and working hours (compliance) that decreases with the cumulative effective length (length adjusted by intensity) of the PHSM, and increases with recent COVID-related deaths (the ‘fear factor’). The results in a non-linear relationship that captures the gap between de-jure and de-facto intensity of mobility restrictions (Figure 2).
Figure 2 Lockdown fatigue: Mobility restriction and de facto reduction
The trade-off
To calibrate the model, we map the sequence of PHSM measures actually implemented at the country level in 2021. This sequence yields both a path for cumulative deaths over the year, and an estimation of the GDP loss. In general, governments imposed stringent measures earlier in 2021 and were able to ease them as the vaccination rates accelerated. These results determine benchmark deaths and GDP losses that are later compared to alternative simulated scenarios.
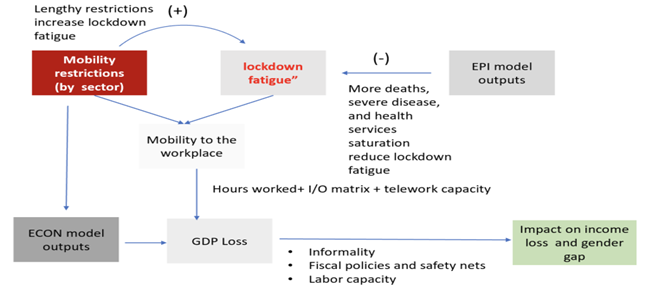
Figure 3 summarises how the two sides of the model interact. For each decision period, the economic model takes the epidemiological output (number of deaths in the previous seven days)
as an input, whereas the epidemiological model takes the economic output (working hours) as an input.
Figure 3 Epi-econ integration
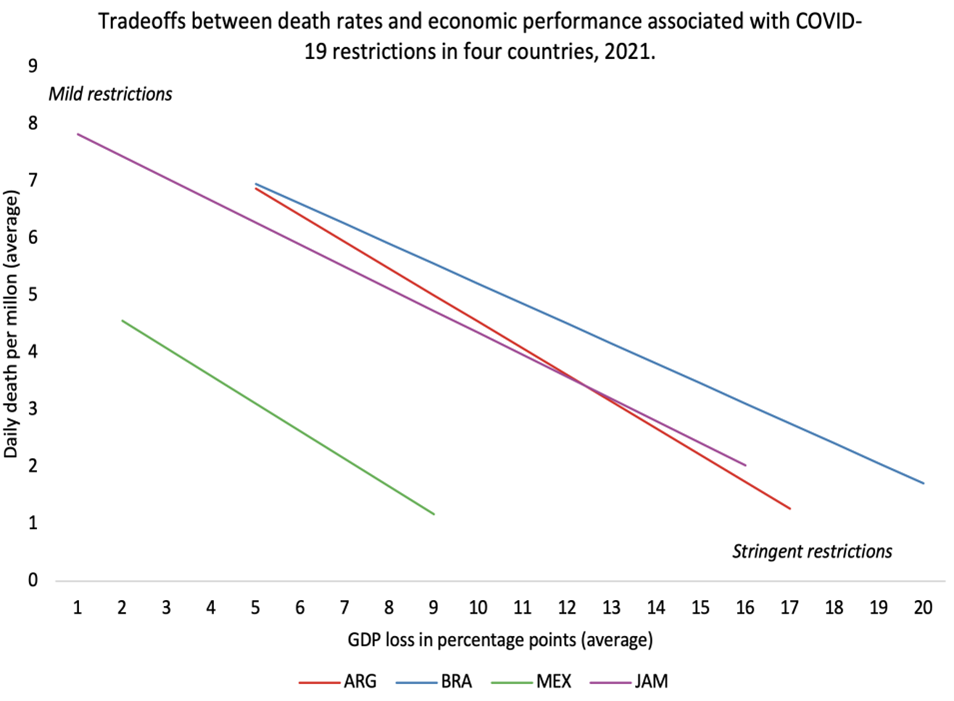
Our primary counterfactual scenario is that governments implement less stringent PHSM measures leading to increased deaths but a more modest GDP loss. Based on these alternative outcomes, we quantify the lives-livelihood trade-off as a ‘sacrifice ratio’: changes in GDP losses and COVID-related deaths when PHSM become less stringent. Naturally, we are not interested in comparing GDP with deaths, but rather in illustrating the short-run trade-offs, its determinants (comparing slopes) and the policy choices in each case (Figure 4). In particular, the slopes highlight disparities among countries. A steeper slope indicates that reducing GDP loss by 1% would result in a more substantial increase in the daily deaths – a difference that emanates from a complex interplay of economic structures, health systems, and previous COVID-19 waves. More generally, the steeper the slope of the trade-off lines, the more challenging the epidemiological-economic trade-offs.
Figure 4 Lives versus livelihoods

Social outcomes
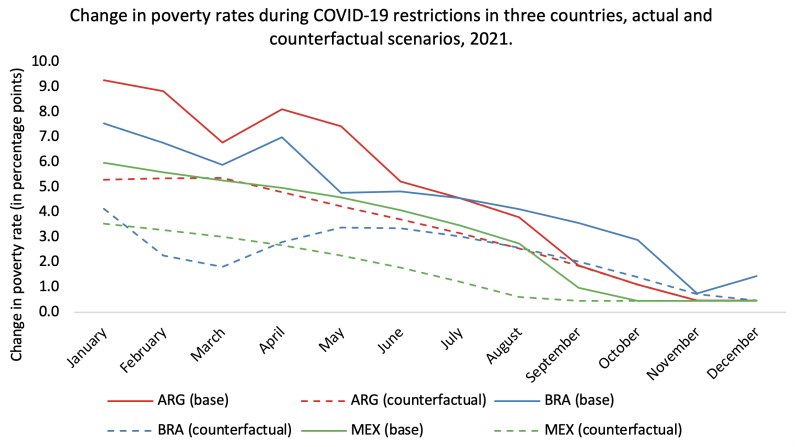
The model also looks into the interaction of PHSM and social indicators. In particular, it illustrates the widening poverty gap as the stringency of PHSM policies soften in the counterfactual scenario, converging as restrictions eased toward the end of 2021 (Figure 5).
Figure 5 Poverty rates
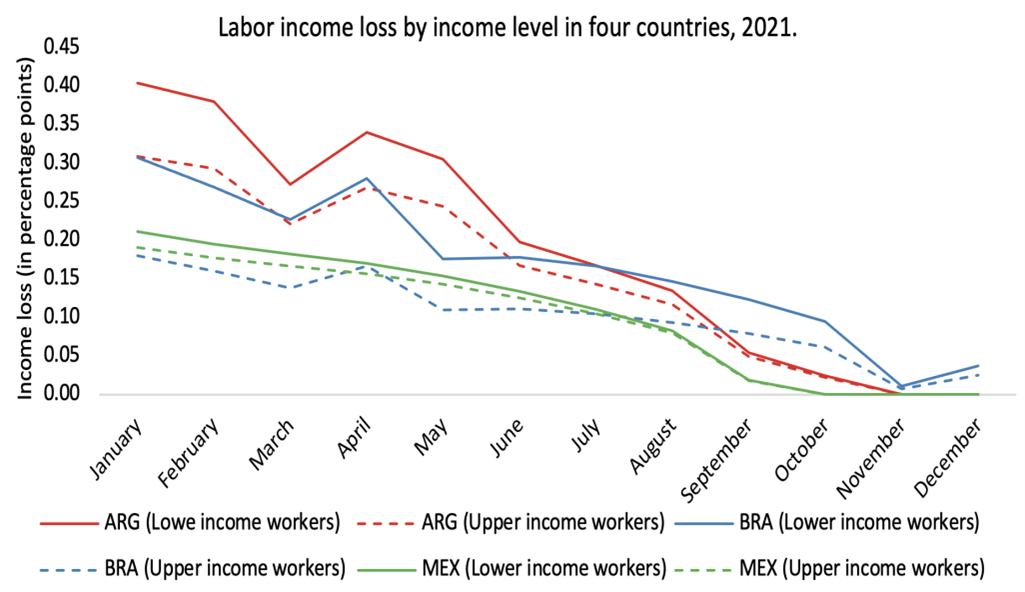

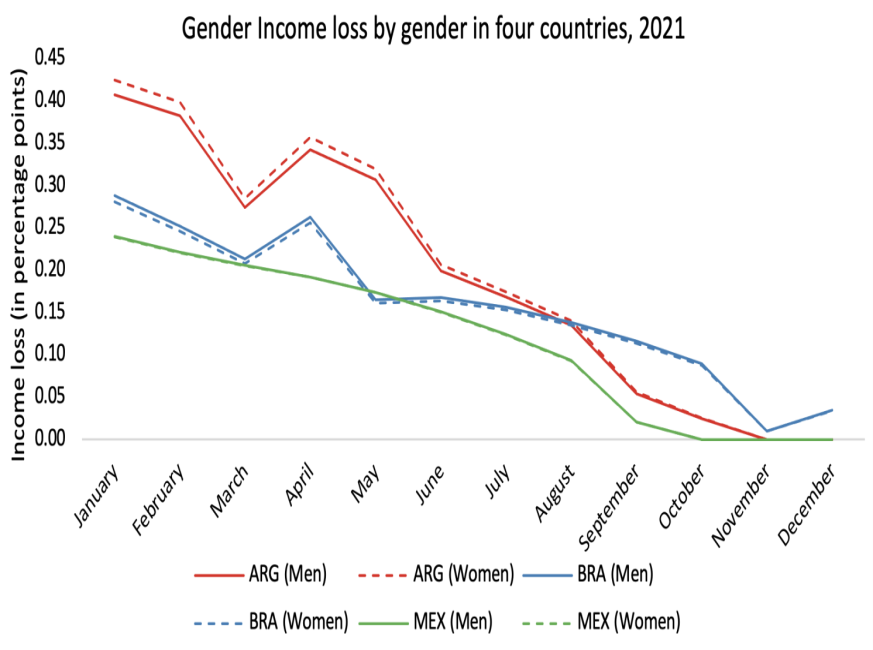
Finally, regarding gender disparities, the results somewhat challenge conventional expectations. We find no statistically significant difference between the income loss for both men and women, particularly during the initial stricter PHSM periods – although the simulations do not take into account the incidence of the increased burden of home work within the household.
Figure 7 Gender gap

Conclusion
In navigating the fraught complexities of pandemic response, policymakers face the daunting task of strategic decision-making (Ferranna et al. 2021), particularly in emerging economies where economic losses are expected to be more persistent. Our model, publicly available and customizable, is a powerful tool for policymakers to assess trade-offs in the context of their unique socio-economic landscapes. In particular, the presence of a steep short-term trade-off between health and economics losses emphasises the relevance of targeted pharmaceutical policies, notably increased vaccination coverage. The model is not intended to pin down an optimal PHSM schedule, a balancing act (Baldwin 2020) that ultimately depends on policy weights that are bound to differ even between policy makers in the same country. Rather, it offers a first insight on the dynamic relationship between PHSM, public behaviour and outcomes in a policy tool that simulates the costs of alternative PHSM programmes and updates them as data becomes available, a first step for better preparedness in the future.
25 gennaio 2023
CHRISTINE DE LA MAISONNEUVE, BALÁZS ÉGERT, DAVE TURNER
Quantifying the macroeconomic impact of COVID-19-related school closures on human capital
(synthesis; full article – https://cepr.org/voxeu/columns/quantifying-macroeconomic-impact-covid-19-related-school-closures-human-capital)
Abstract: The COVID-19 pandemic caused school closures in almost all countries, leading to learning losses. This column uses a new measure of human capital to estimate the long-term effect on aggregate productivity across OECD countries. The results show school closures lead to significant and persistent productivity losses, and the effects will peak in 2067. Policies aimed at improving the quality of education and adult training will be needed to offset or at least alleviate the impact of the pandemic on human capital.
Keywords: COVID-19, education, school closures, human capital, lost schooling.
The COVID-19 pandemic led to the partial or full closure of schools in almost all countries around the world. On average, across OECD countries, school buildings were fully closed for 13 weeks and partially closed for a further 24 weeks between March 2020 and October 2021, which combined is equivalent to around one full school year. 1 Learning losses stemming from school closure may be difficult to make up and so may have a long-term economic impact on the students affected, with possible enduring macroeconomic consequences (Ilzetzki 2020, Kuhn et al. 2020, Popova et al. 2020).
Figure 1 Duration of school closures between March 2020 and October 2021

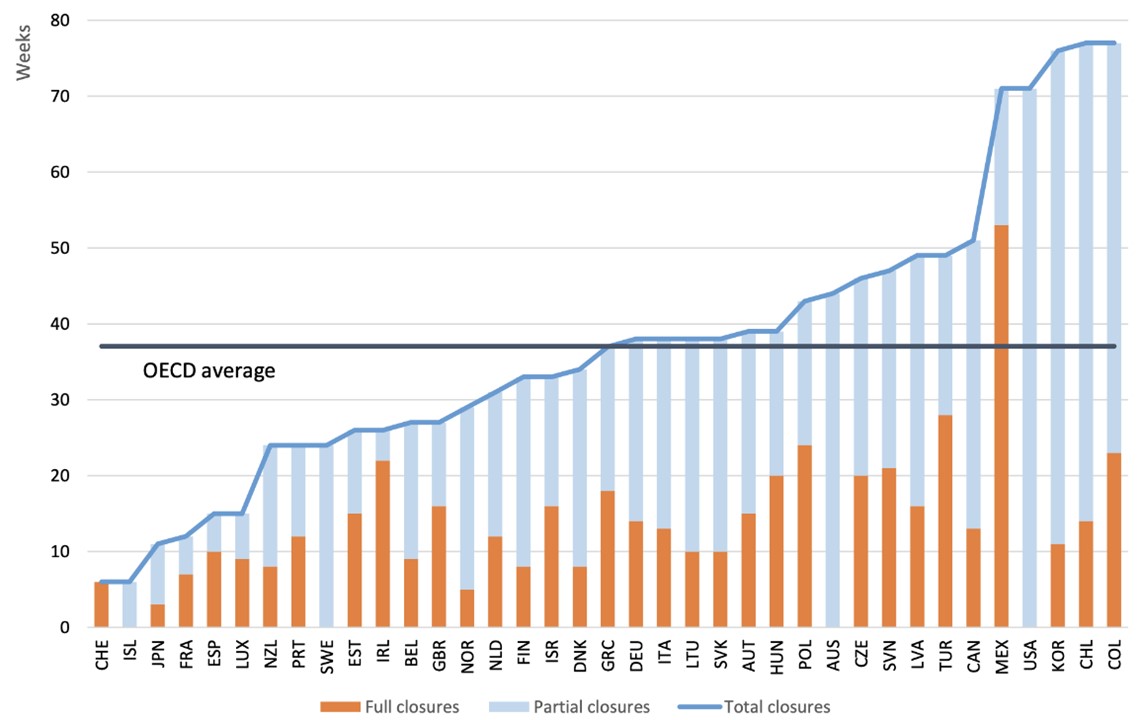 Note: Full school closures refer to situations where all schools were closed nationwide due to COVID-19. Partial school closures refer to school closures in some regions or for some grades, or with reduced in-person instruction. Total closures are defined as the simple unweighted sum of these two aggregates. Source: UNESCO.
We exploit a new measure of human capital, derived in Égert et al. (2022), that combines mean years of schooling (MYS) and OECD data from the Programme for International Student Assessment (PISA). The new measure is a cohort-weighted average of past PISA scores (representing the quality of education) of the working-age population and the corresponding mean years of schooling (representing the quantity of education). Weights for PISA scores and mean years of schooling are estimated from regressions which consider how well the cohort-weighted variables explain scores from the Programme of International Assessment of Adult Competencies (PIACC).
Based on this new measure, we can compute separately the effect of the pandemic on PISA scores and mean years of schooling (MYS) and feed this into the stock measure of human capital. For each cohort impacted, we add up the effects of the pandemic on MYS and PISA test scores to estimate the overall effect on human capital. We calculate these using the elasticities of MYS and PISA with respect to human capital, estimated in Égert et al. (2022). We then calculate a population-weighted average of the impact of each cohort affected to provide the global effect on human capital.
The new measure of human capital shows a robust correlation with productivity for OECD countries in cross-country time-series panel regressions. This helps us quantify the macroeconomic losses due to school closures, reflected in losses in PISA scores and mean years of schooling.
Using these estimates, we consider three scenarios:
- The effect of the spring 2020 school closuresexperienced in many OECD countries, which roughly corresponded to one-third of a school year closure. This period of closure translates into a -2.6% decrease in mean years of schooling 2 and, using the rule-of-thumb described above, a 0.14 standard deviation fall in PISA scores, 3 corresponding to a 1.1% decrease in PISA scores. 4
- The effect of a one-year school closure, broadly corresponding to the average total (full and partial) school closures observed across OECD countries since the start of the pandemic and, according to a first assessment, to the learning loss of the most disadvantaged students in the US (US Department of Education, 2022). This scenario translates into a -8.2% decrease in MYS and a -0.37 standard deviation fall in PISA scores, corresponding to a 2.9% decrease in PISA scores.
- The effect of a two-year school closure, which occurred only rarely and broadly corresponding to the total (full and partial) school closure in Colombia, Chile, Korea, and Mexico since the start of the pandemic which translates into a -16.5% decrease in MYS and a 5.6% and a -0.72 standard deviation fall in PISA scores
We estimate the impact of school closures on productivity through the human capital effect for these three scenarios. Multivariate productivity regressions link productivity to human capital in the presence of a number of control variables such as innovation intensity, product market regulation and trade openness. The impact will increase gradually as the student cohorts hit by the pandemic enter the labour force, reaching its peak in 2067. At that date, the impact of school closures on productivity will be -0.4%, -1.1% and -2.1% in the first, second and third scenarios, respectively. The impact will then dissipate gradually until the last impacted cohort retires in 2083 (Figure 2). The impact is largest in 2067, as this is when all the impacted cohorts will be in the older part of the labour force, and the impact on human capital is most important.
Figure 2 The impact of school closure on productivity
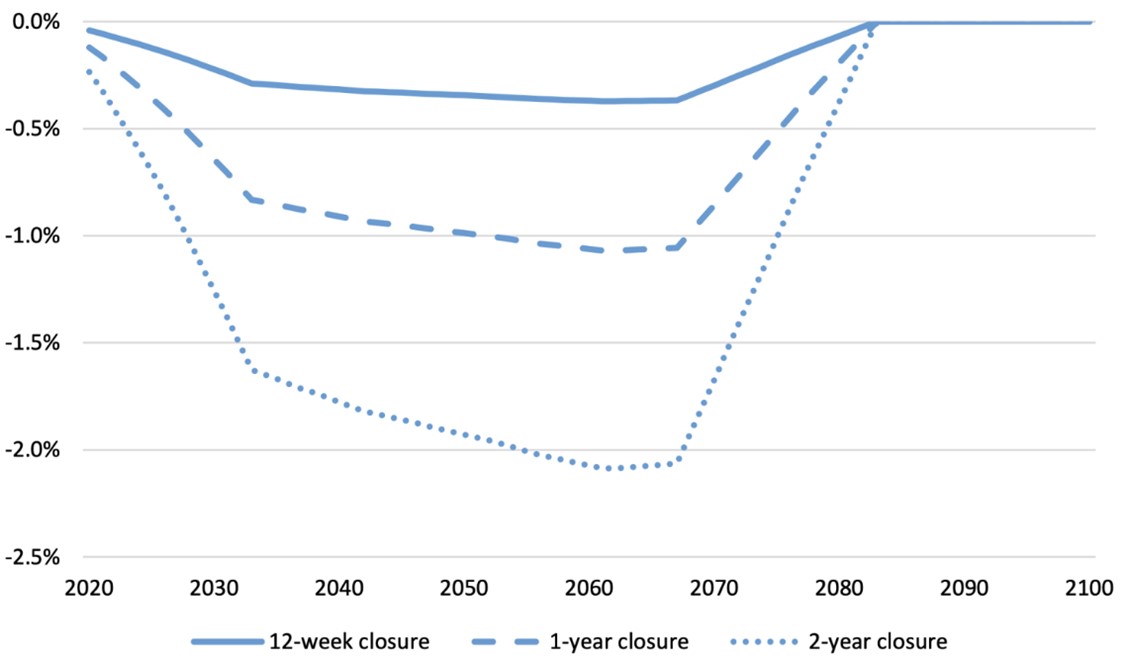
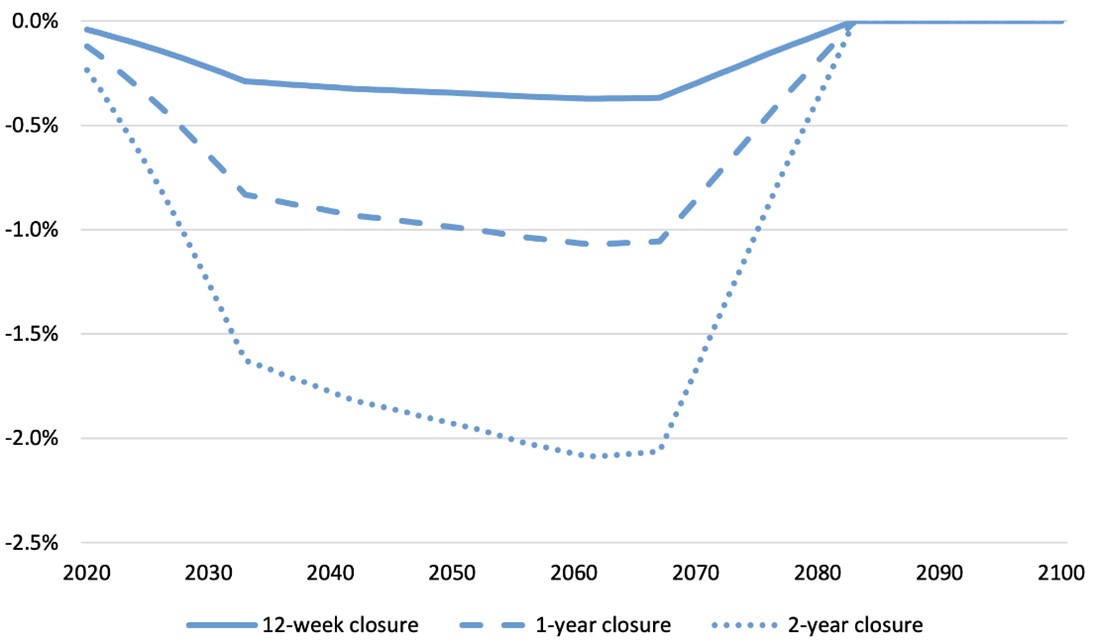
Source: Authors’ calculations.
Comparison with estimates in the existing literature
The empirical findings of the literature standardised to a one-year school closure imply a non-negligible impact of the crisis on the level of GDP ranging from -1.1% to -4.7% around 2040-2050 (Dorn et al. 2020, Hanushek and Woessmann 2020, and Viana Costa et al. 2021). Researchers have used different methodologies. Dom et al. (2020) set up various scenarios to produce back-of-the-envelope calculations. Viana Costa et al. (2021) derive the economic costs using microsimulation model calculations. The calculations of Hanushek and Woessmann (2020) use macro regression analysis, which links GDP per capita to student test scores in a multi-country error-correction framework. Our results are broadly consistent with much of the literature except
for Hanushek and Woessmann (2020), who found a much larger effect (-4.7%). Those results would be equivalent, ceteris paribus, for effect on GDP per capita.
Mitigation policies
Mitigating the COVID-19 impact on human capital is a major policy challenge because most, if not all, education policy reforms have long implementation lags, implying that education policies mitigating the pandemic’s effect will not be able to reach the oldest student cohorts affected by COVID-19. An additional difficulty is that some policies concern the youngest students. Measures that could be implemented to help the catch up of affected student generations include the following (OECD 2020, OECD-Education International 2021, and Molato-Gayares et al. 2022):
- Extending the teaching time by temporarily reducing school holidays and/or adding hours in a school day.
- Revising the curriculum to focus on key skills.
- Providing teachers with training.
- Considering the use of digital technologies to improve the diagnosis of learning gaps and facilitate more individualised teaching practices
- Spreading collaboration and professional ways of working to increase teachers’ effectiveness
For the cohorts that have already left school, it is important to strengthen young adult training programmes. However, these are notoriously not very cost-effective, and offsetting losses in learning at younger ages can turn out to be very costly for the government budget.
Further measures could include extending and improving the quality of pre-school education, considered by many as the best value for money, which would come too late for almost all student cohorts affected by the pandemic. Other education policy reforms, which are found to have a positive correlation with student test scores during normal times, but which might also help offset some of the losses for the younger generations in the aftermath of the pandemic, include increased school accountability and school autonomy, reduced early tracking and improved teacher quality and qualifications.
18 Dicembre 2022
MATHIAS DREHMANN, MIKAEL JUSELIUS, DAVID AIKMAN
Supply shocks, monetary policy, and scarring
(synthesis; full article: https://cepr.org/voxeu/columns/supply-shocks-monetary-policy-and-scarring)
Abstract: There are heightened concerns that advanced economies are on the brink of a recession, but even the pessimists generally agree that economies will eventually converge back to trend. This column casts doubt on this view. Using a panel of 24 countries from 1970 onwards, the authors find that there is a significant tipping point in recovery dynamics, which depends on the size of the initial contraction: severe contractions have highly persistent effects, whereas smaller contractions do not. This finding holds regardless of whether the contraction follows aggressive monetary tightening to combat high inflation, energy price disruptions or other factors (including financial crises)
Keywords: ecomic recovery, recessions, economic expansions and contractions, business cycles, monetary policy, COVID-19.
The current outlook for economies globally is bleak. Headline inflation rates around the world have soared following supply-side disruptions from the war in Ukraine, previous Covid-19 lockdowns, and possible further lockdowns in China. As central banks have pivoted to a more aggressive tightening phase, the question of whether they can manage soft landings or whether there will be recessions has been hotly debated (e.g. Boissay et al. 2022, Summers 2022, Yellen 2022). But despite major uncertainties ahead, private and public forecasters generally agree that the economy will revert back to trend in the medium run. One reason for this is that full recoveries are essentially baked into standard macro models qua assumption.
The data do not support such confidence in the stability of the medium-term outlook. Our research with Xiaochuan Xing (Aikman et al. 2022) highlights the fact that deep contractions more often than not leave long-term economic scars. It is well known that such scarring can occur following recessions caused by financial crises, such as that of 2007-09 (e.g. Cerra and Saxena 2008). What is less well known is that scarring also occurs after deep recessions associated with other factors, such as monetary policy tightening or oil price disruptions. 2 As we discuss below, this has important implications for policy.
The scarring effects of deep recessions
Our results are based on a simple, intuitive test, which is illustrated in Figure 1.
We first bucket together contractions of similar magnitudes in our dataset, starting with the weakest 5% of outcomes across countries. For these most severe contractions, we compare 10-year ahead growth rates calculated immediately prior to the contraction with those from all other points in our sample. If real output eventually recovers its previous trend, there should be no statistical difference between these two long-term growth rates on average. However, if contractions cause scarring, long-term growth rates taken from their eve will be lower than the rest.
We then repeat the process for successively milder outcomes in 5% intervals until we reach the median.
- Figure 1 Detecting scarring effects with long-run growth rates: An illustration
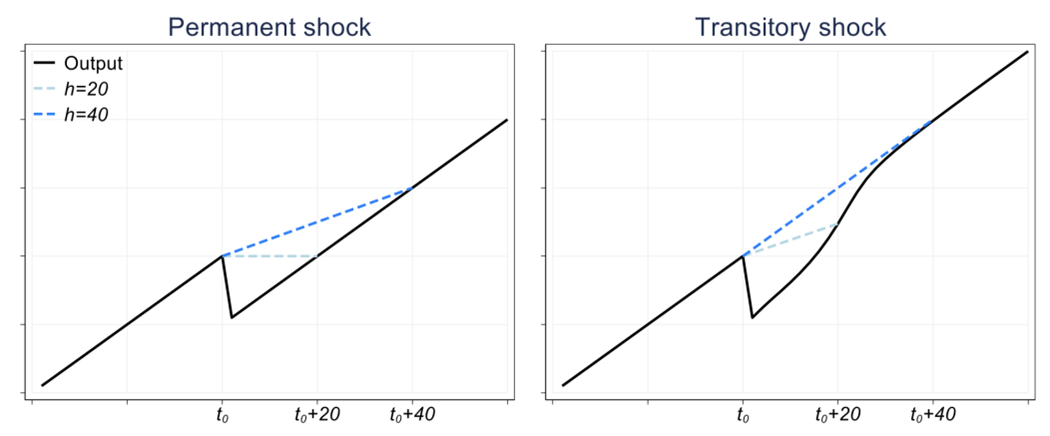

- Note: Illustration of the impact of alternative shocks at time t0 on multi-period growth rates. From the perspective of t0, a permanent shock (left panel) of size -d reduces the h-quarter ahead growth rate by -d/h (blue dotted lines). In contrast, if the shock is transitory, the average growth rate returns to the trend for large enough horizons (right panel).
- Our sample contains 19 advanced economies and five emerging market economies (EMEs) from 1970 to the present.3 We remove long-run growth trends and normalise growth rates by country-specific means and standard deviations to make sure that they are comparable across countries.
- Figure 2 shows the scarring effects of deep contractions. The dark red lines show the difference between the average 10-year ahead real GDP growth at the onset of the contraction and the rest of the sample. We calculate these differences for contractions of different sizes as described above (shown on the x-axis). Grey areas are confidence intervals.
- The worst 20% of contractions in terms of severity have highly persistent costs whose effects are visible in the level of GDP a decade hence. But the magnitude of the scarring increases more than proportionally with the size of the initial contraction. For the deepest contractions, i.e. those in the worst 5%, GDP growth in the decade that follows is substantially below the full sample mean. This translates into a persistent loss of 4.25% in the level of real GDP for an average economy.
- We also show in the paper that while the specific tipping point may vary with the test specification, the main takeaway that only severe contractions have scarring effects is very robust across samples, time periods, detrending methods, and approach used to identify contractions.
- Figure 2 Only severe contractions have scarring effects

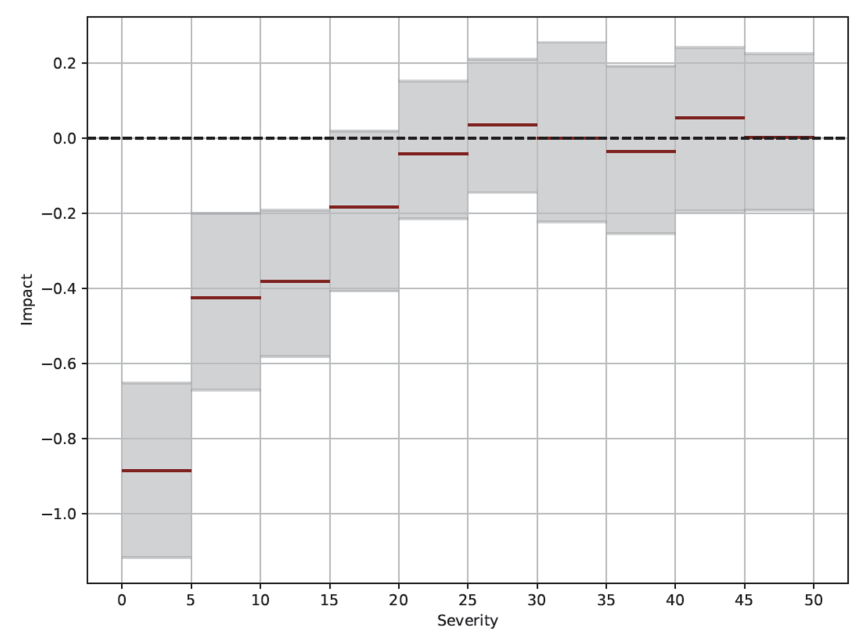
- Note: Difference in mean 10-year growth rates following contractions of different severity versus that calculated using all other points in the sample. The solid lines show points estimates of this difference for contractions in the severity buckets indicated on the x-axis. The shaded areas are 95% confidence intervals. Severity buckets are based on distribution of annual real GDP growth outcomes starting with the weakest 5% outcomes (“most severe”) to then look at successively milder outcomes in 5% intervals until the 45th to 50th percentile (“mild”). The y-axis is standard deviations of 10-year real GDP growth.
- A question of particular interest at this juncture is whether all large contractions come with long-term losses, or whether only certain types of contractions do. To analyse this, we focused on the 5% most severe contractions and classified them into one of the following four categories: (1) banking crisis; (2) restrictive monetary policy to combat high inflation; (3) oil shocks; and (4) other. In total, out of 198 large recessions we classified 100 as banking crisis-driven events, 51 as monetary policy-driven, 19 as driven by oil shocks, and 9 as having other causes.
- Using this classification, we find that the specific cause of the contraction does not matter much for our results. When conditioning on each type of contraction separately, we find long-run effects of roughly similar magnitude for banking crisis and those related to monetary policy tightening and of greater magnitude for oil shocks (Figure 3). Only “other” contractions, for which it is difficult to identify a single clear cause, are not associated with any significant long-lasting effects.
- Why should such permanent losses occur? Likely mechanisms historically have included slower technology growth due to lower investment in R&D, bankruptcies of highly productive start-ups, or the erosion of human capital from long spells of unemployment. At this juncture, an additional mechanism could be the process of deglobalisation and fragmentation kickstarted by Covid and the Russian invasion of Ukraine.
Figure 3 Long-term growth effects of severe economic contractions by proximate cause

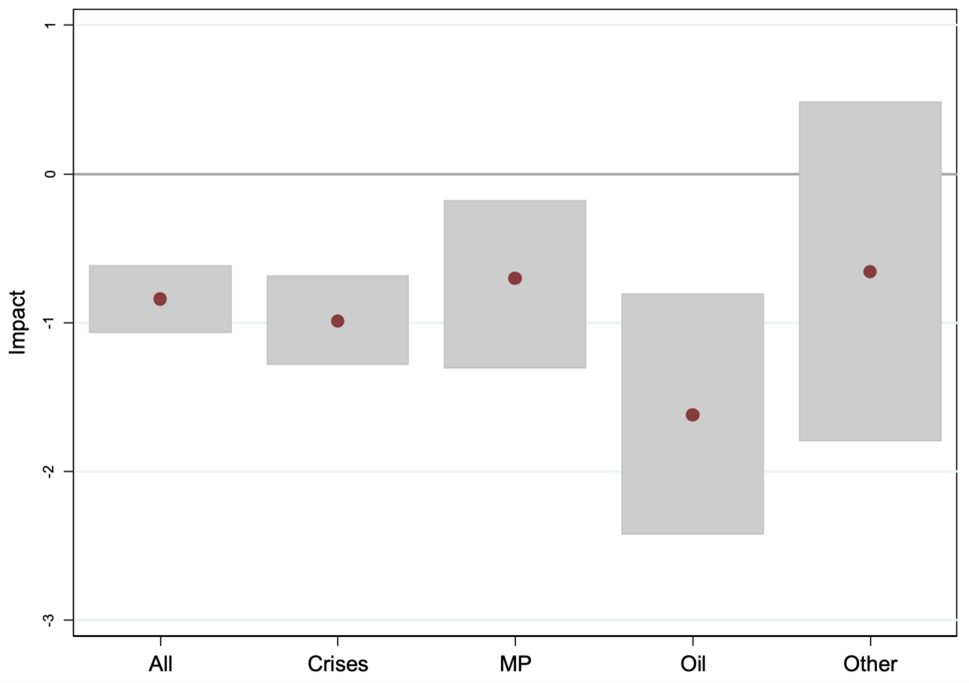
- Note: This chart shows mean differences in 10-year growth rates after annual growth contractions in the worst 5% in terms of severity compared to the rest of the sample. The x-axis shows the different recession types. The y-axis shows standard deviations of 10-year growth rates.
· What does this all mean for policy?
- For one, our results put renewed emphasis on Olivier Blanchard’s assessment after the Great Financial Crisis that “authorities should make it one of the major objectives of policy—macroeconomic, financial regulatory, or macroprudential—to stay further away from the dark corners” (Blanchard 2014: 30), where he defines dark corners as those states of the world when the economy malfunctions badly and non-linearities kick in.
- But as several bad shocks have already occurred, a key question is whether policymakers have sufficient tools to avoid such a dark corner materialising, especially if they want to combat rising inflation at the same time. Many current forecasts anticipate that central banks will eventually deliver full recoveries. As such, long-term effects of the current predicament may be limited, with economies around the world eventually reverting to the previous trend.
- The situation is frail, however. It is, for instance, not inconceivable that supply disruptions could worsen as the war continues, or that Covid could surge again and hamper the global economy. Weighing these trade-offs is beyond the scope of our paper. But what is very clear from our analysis is that relying on standard macroeconomic models that assume the economy will inevitably recover the previous trend after a shock can be misleading, especially at times when the stakes are highest. And while there are many risks ahead, relying on wrong models is certainly one risk that policy makers can avoid.
11 Novembre 2022
PATRICK BOLTON, ALISSA KLEINNIJENHUIS, TOBIAS ADRIAN
COP27: Climate finance for developing countries is not just equitable, it is self-interest
(synthesis; full article – https://cepr.org/voxeu/columns/cop27-climate-finance-developing-countries-not-just-equitable-it-self-interest)
Abstract: During the COP27 debates, there will be demands for more climate aid from wealthy countries. This column argues that aside from equity concerns, once one takes account of the benefits to each country from emission reductions brought about by replacing fossil fuels with renewables anywhere in the world, there is a much more direct impetus for action – self-interest. The authors conservatively estimate that the net global economic gain from replacing coal with renewables is around $85 trillion, and suggest that the most effective way to make “finance flows a reality” at COP27 may be to make countries aware of the net gain they can reap from financing the phase out of coal
Keywords: Climate change, climate finance, international finance, renewable energy, COP 27.
One of the key targets at COP27 is to make “finance flows a reality”. “Providing, mobilising and deliver climate finance for developing countries is an urgent priority [..].” 1 The importance of scaling up sustainable finance is underscored by Dursun-de Neef et al. (2022) and Schoenmaker and Voltz (2022). At the COP27 debates, there will be demands for more climate aid from wealthy countries. Financing is set to be the make-or-break issue for this COP. Wealthy nations pledged to mobilise $100 billion a year by 2020, but are still about $17 billion short. Progress on delivery of the annual $100 billion will build more trust between developed and developing countries and make progress towards tackling the global climate change problem more probable.
Equity considerations have been a core rationale behind the pledge to provide $100 billion a year in climate finance to developing countries. The argument typically runs as follows: (1) developed countries have historically emitted more carbon, so bear a larger responsibility for the adverse impacts of climate change; and (2) developed countries are wealthier than developing countries, so must help poor countries with climate mitigation and adaptation. In the run-up to COP27, the call to offer compensation finance for “loss and damage’’ has become especially prominent. “Loss and damage” has become shorthand for the call for funding by wealthy countries for poor countries suffering the consequences of climate change. The matter has grown more urgent this year, marked by a succession of extreme weather events including the recent widespread flooding in Pakistan. 2 As UN Secretary-General António Guterres put it at the opening of COP27: “Loss and damage can no longer be swept under the rug. It is a moral imperative.”
While such equity considerations matter profoundly, they have so far, however, not proved to be a strong impetus for action, as the difficulties of garnering a mere $100 billion a year in climate finance for developing countries have demonstrated. Once one takes account of the benefits to each country from emission reductions brought about by replacing fossil fuels with renewables anywhere in the world, there is a much more direct impetus for action: self-interest! Indeed, the Coase theorem states that it is in the economic interests of a country A to pay a polluting country B to stop polluting if that makes country A better off. From a Coasian perspective, it is thus sound economic logic to pay polluters for the costs of replacing fossil fuels with renewables, if the benefits exceed the cost. Indeed, Coase provides a new perspective on and rationale for (foreign transfers of) climate finance. Tangible net benefits can be reaped even if only a coalition of the willing (e.g. a region) strikes a Coasian deal to phase out of fossil fuels. The larger the climate club in terms of the emissions it can avoid, the closer the net benefits of such a deal get to the large net benefits in a global deal to get rid of fossil fuels.
Looking back at COP26, two distinct discussions took place: (1) ending coal; and (2) providing $100 billion in climate finance a year for developing countries. Looking forward, at COP27 these distinct discussions should be merged. Climate finance to help build renewables should be made conditional on the commitment to end coal (and fossil fuels more generally). Indeed, only if climate finance for phasing in renewables happens concurrently with phasing out coal is energy supply maintained and the risk of carbon leakage (a salient concern if only a subset of the world strikes a deal to phase out coal) limited. Building conditionality into climate finance is key to achieve emission reductions and thus the benefits of providing climate finance. To be equitable, such conditionality must come with compensation for the opportunity costs of coal. Indeed, coal owners and coal workers must be compensated for their missed income. Retraining programmes must be funded to make workers qualified for employment in the replacement renewable industry.
The Great Carbon Arbitrage
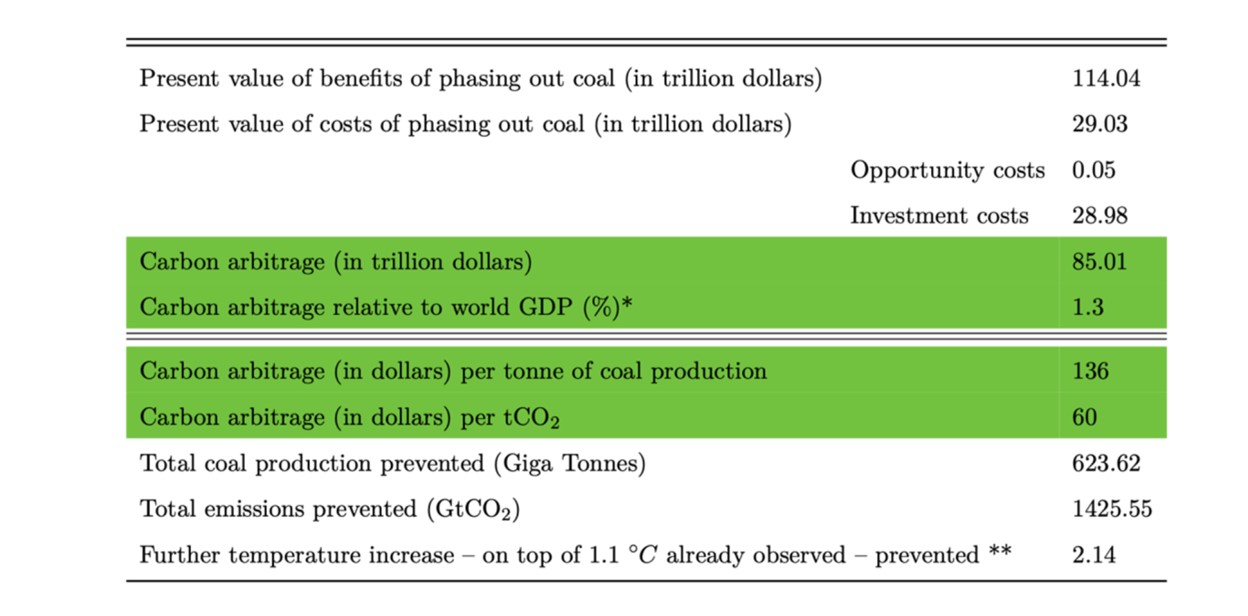
In a recent paper (Adrian et al. 2022), we study the net benefits from phasing out coal and replacing it with renewables. Our quantitative analysis makes a simple but important observation: phasing out coal and replacing it with renewables is not just a matter of urgent necessity to limit global warming. When its costs and benefits are considered, it also turns out to be a source of considerable net economic and social gain – the economic gain is around $85 trillion under a conservative estimate (see Table 1). Faced with the prospect of such an enormous gain, it is puzzling for any economist inculcated with the tenets of “there is no such thing as a free lunch” and “no money left on the table” how the world could indeed leave so much money on the table. Even faced with “high transaction costs” and “poorly defined property rights”, to use the main notions behind the Coase Theorem (Coase 1960), it is astonishing that a Coasian bargain of such proportions could be left untouched. One plausible explanation could be that the countries involved in working out a global agreement to phase out coal are not aware of the size of the benefits from such a phase-out, even taking into account the costs of replacing coal with renewables and the cost of compensating coal businesses and workers.
Benefits consist of the avoided climate damages from reduced emissions by shutting coal mines down early, and are under our baseline conservatively priced at an average social cost of carbon (SCC) of $80/tCO2. Costs consist of investment costs to build replacement renewable energy and compensate for opportunity costs of coal. We observe that the lion share of costs consists of the investment costs in renewables (at $29 trillion), 3 while only a small part consists of costs to compensate for the opportunity costs of coal (at $50 billion).
The quantified global opportunity costs of coal remain small even when we consider a broader definition of opportunity costs that includes not only missed revenues to coal owners from shutting mines down early, but also compensation for missed wages of coal workers losing their jobs in the coal phase out (for the duration of five years while they seek employment in other industries or retire early) and compensation for retraining costs to qualify for employment in other industries (e.g. the renewable industry). These broader opportunity costs bring our baseline estimate of the global opportunity costs of coal from $50 billion up to $331 billion (of which $275 billion is for lost wages and $7 billion for retraining). To our knowledge, this is the first valuation of the net global benefits from replacing coal with renewable energy.
Table 1 Net benefits of a global phase out of coal

In practice, obstacles to bargaining or poorly defined property rights can prevent Coasian bargaining to strike a global agreement on climate finance to replace coal with renewables, but our point is that in light of the large net gains we identify there should be renewed efforts to lift these obstacles. We point to promising avenues to overcome such obstacles and discuss how to make the funding to replace coal with renewables in the economic interests of all key stakeholders involved (i.e. governments, investors, and coal communities). In particular, we identify blended climate finance as a promising avenue to catalyse public investments.
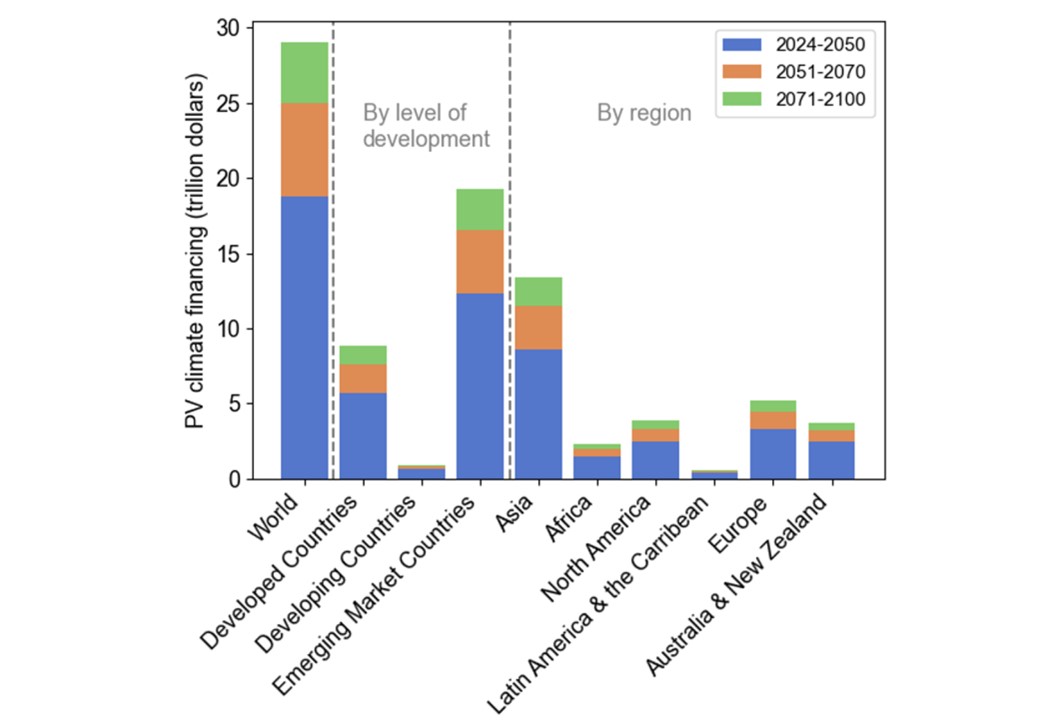
“Here is why blended finance matters – enormously. The beauty of this concept is leverage: if a small pot of multi-lateral development banks or western aid provides the first-loss tranche for investments to replace coal with renewables, it could attract a much larger dollop of private sector capital” (Tett 2022). With a 1:9 ratio of catalytic public to private funding, $26 trillion out of the $29 trillion could thus be raised via capital markets, while governments would only have to invest by around $2.9 trillion to enhance the capacity of MDBs to invest in the equity tranches. In our paper, we quantify climate financing needs for replacing coal with renewables across countries in the world. 4
Figure 1 Climate finance needs to replace coal with renewables (present value)

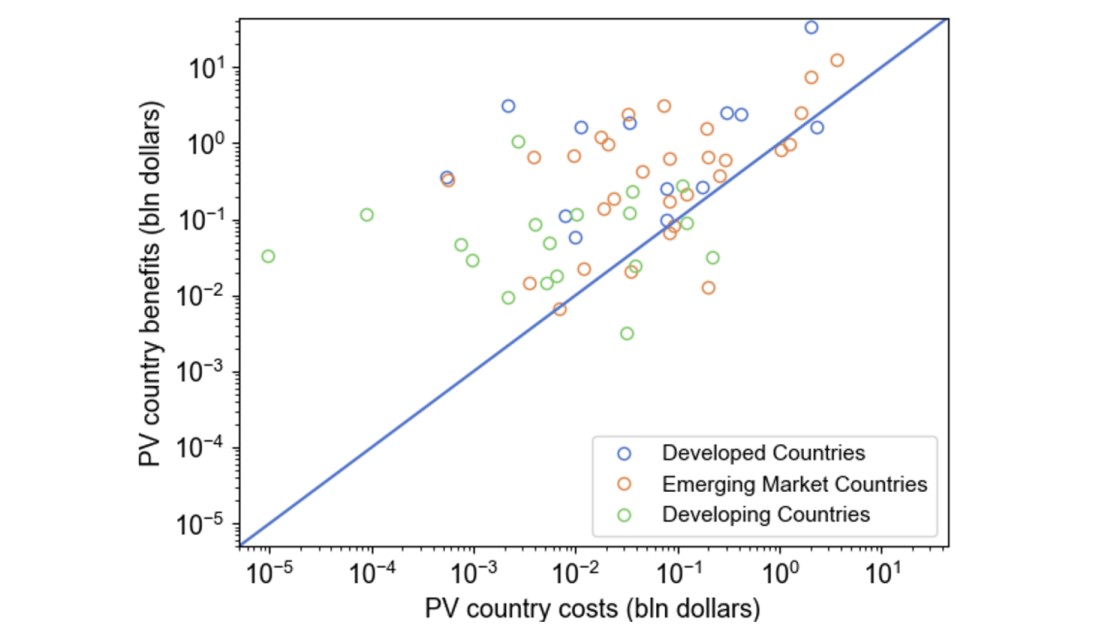
It seems a reasonable baseline under Coasian bargaining that each country cover its own costs to domestically replace coal with renewables. We find that it is in the economic interest of most countries to participate in a global deal to end coal, even in absence of cross-country compensatory transfers (see Figure 2). The benefits for each country from a global deal to phase out coal are given by the quantity of avoided emissions times the country-specific SCC (estimated by Ricke et al. 2018). This multiplication tells what share of the global benefits of avoided climate damages accrues to each country, capturing that impacts of climate change are unevenly felt across countries.
Figure 2 Country-level costs and benefits in a global deal to phase out coal (present value)

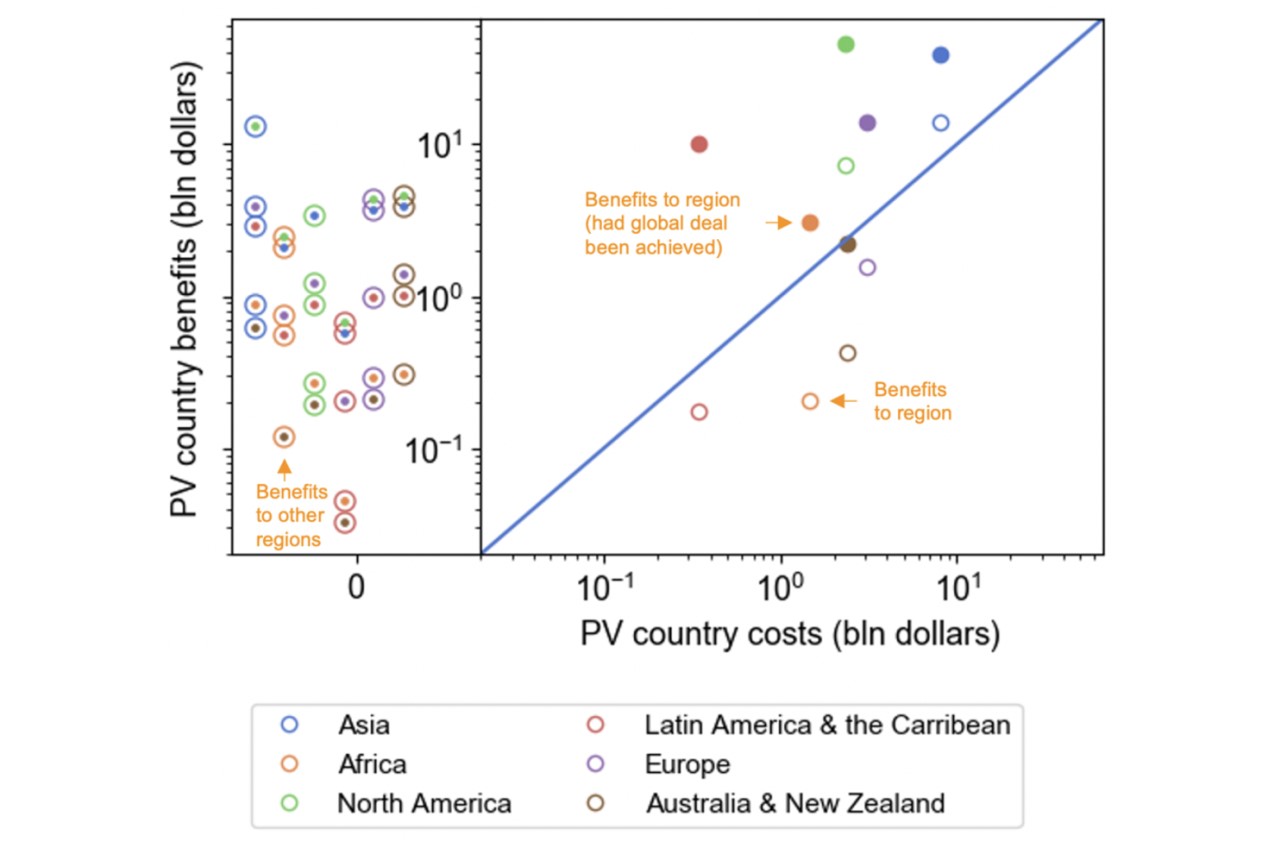
As noted, contributions to help cover foreign climate finance needs may be called for based on equity considerations. Such equity considerations have so far not proved to be a strong impetus for action, however. Once one takes account of the benefits to each country from emission reductions brought about by replacing coal with renewables anywhere in the world, there is a much more direct impetus for action: self interest. Indeed, the Coase theorem states that it is in the economic interests of a region A to pay a polluting region B to stop polluting if that makes region A better off. Take America as an example of region A and Africa as an example of region B (see Figure 3), to illustrate how climate financing from rich regions to poor regions is, in fact, enlightened self-interest!
We observe that the present value of investments Africa would need to make to replace its coal with renewables is $1 billion (of which 90% could be drawn from capital markets if a successful blended finance arrangement is in place). The benefit to Africa in a global deal to phase out coal is given by $3.1 trillion dollars in avoided climate damages, while the benefit to Africa from in a deal that sees its own coal being phased out is $0.2 trillion in avoided damages. In both cases, benefits are computed by taking the collective SCC of Africa and multiplying that by the size of avoided emissions, which then gives an estimate of avoided losses (due to climate change) to Africa’s GDP. Africa may not be able to afford to spend $1 billion to end coal – as recent foreign climate finance offered by rich countries to help South Africa phase out coal indicates (Pilling 2022). Given the greater historical emissions of rich countries, it may also not be fair for Africa to pay for its own coal phase out. The left panel of Figure 3 shows that rich regions, such as North America and Europe, stand to benefit enormously if Africa were to phase out coal. The orange circle with the green dot inside shows the benefits to North America of Africa’s coal phase out are around $2.5 billion; the benefits to Europe of Africa’s phase out are around $0.7 billion. Hence, it is squarely in rich countries’ interest to offer climate finance to help Africa with its coal phase out. With blended finance, these rich countries would only have to pay 10% of $1 billion ($0.1 billion) in present value terms to do so.
Critical for benefits to materialise is that rich countries offer finance to build out renewables, as well as funding to compensate for the opportunity costs of coal of developing countries, conditional on the commitment to end coal. Otherwise, no emission reductions may take place and benefits to rich countries in terms of avoided climate damages are not realised. Phasing in renewables and phasing out coal concurrently is moreover critical to ensure sufficient energy supply for Africa.
Figure 3 Present value of costs to phase out coal in one region and present value of benefits this brings both to the region that is phasing out coal (right part), as well as other regions in the world (left part)
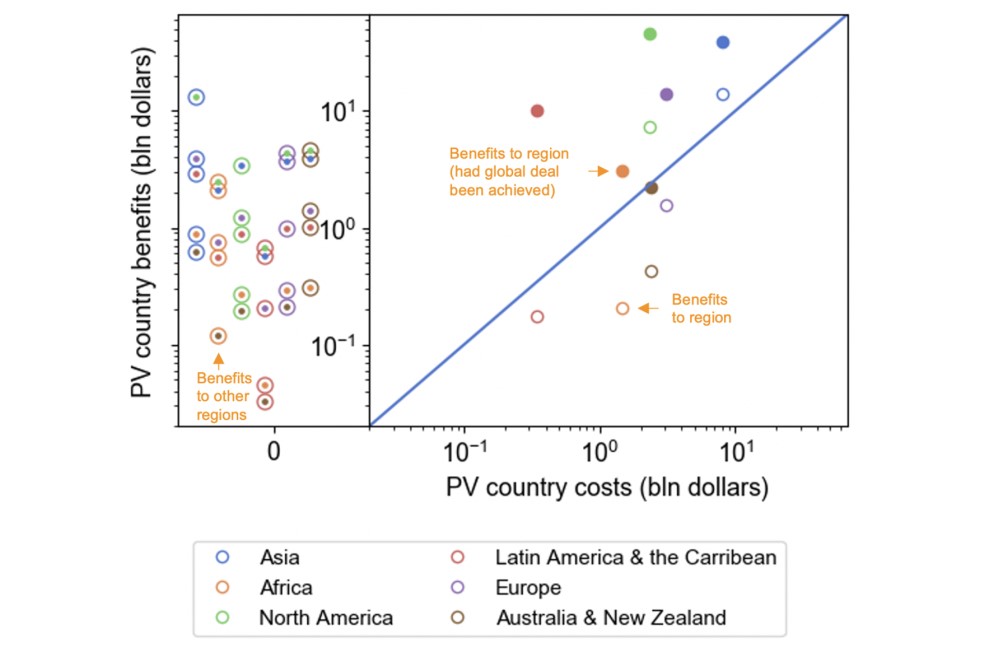
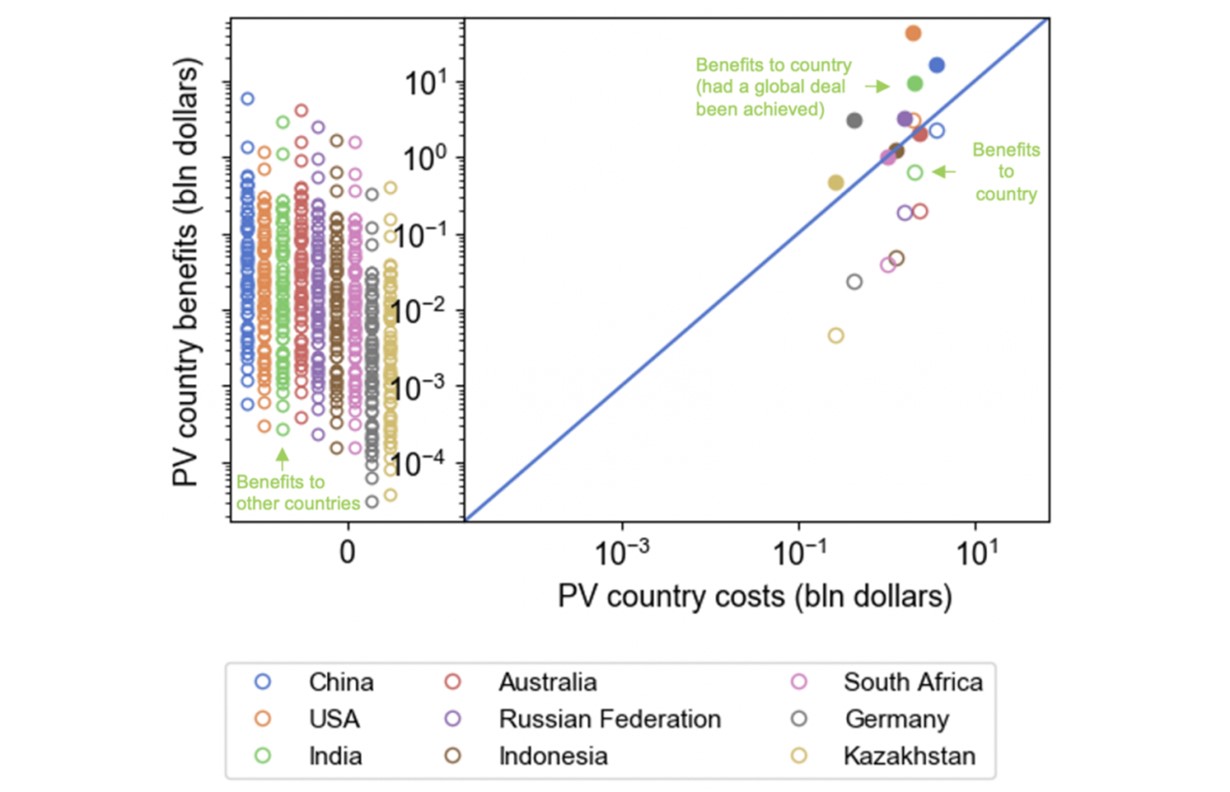
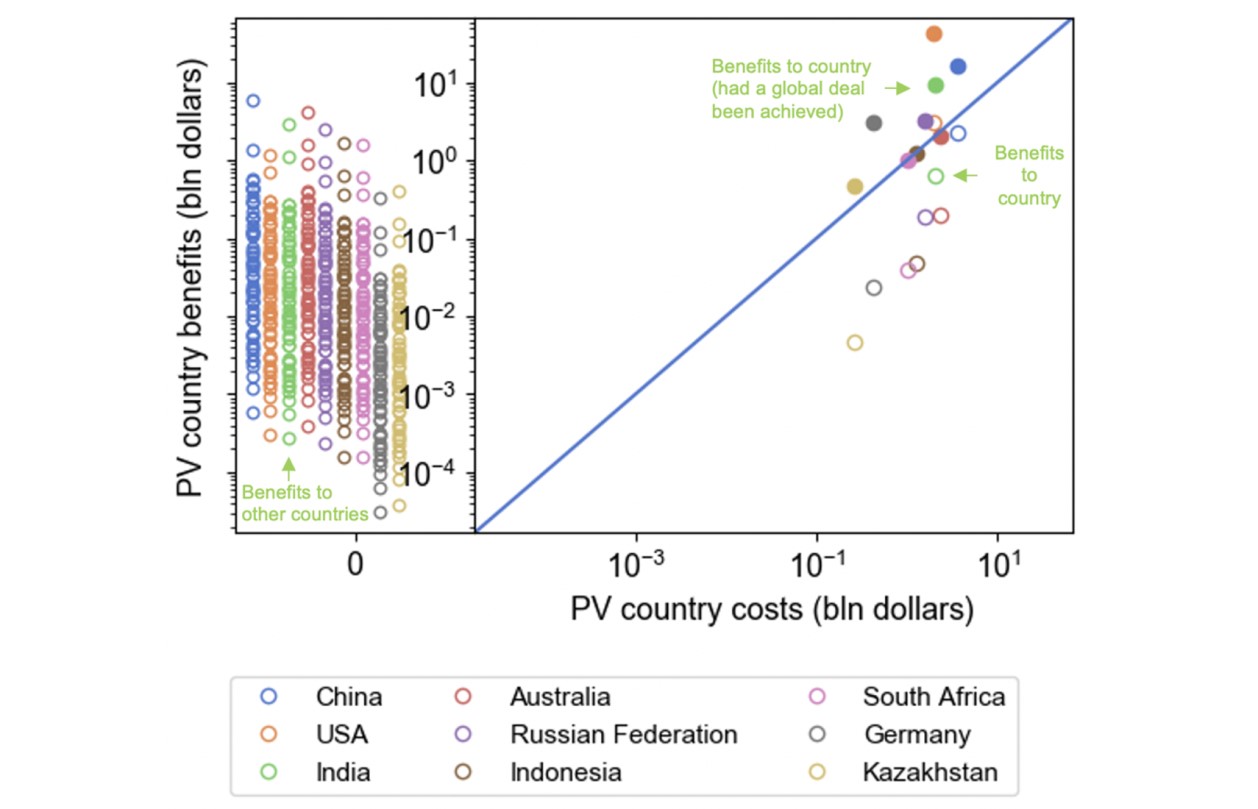
Similarly, it can be in the economic interest of rich countries to help pay for the costs of replacing coal with renewables in the most coal-reliant countries (see Figure 4), such as India, South Africa, and Indonesia.
Figure 4 Present value of costs to phase out coal in one of the top-9 coal countries and present value of benefits this brings both to the country that is phasing out coal (right part), as well as other countries in the world (left part)
Big picture, our conceptual contribution is that paying the polluter – via climate finance – to stop polluting (as is happening now, for example, in South Africa) results in a Coasian bargain. Coase won the Nobel prize for his insight that paying the polluter to stop polluting may make you better off. But, to the best of our knowledge, no work has linked his theory to the idea that the provision of climate finance could result in a Coasian bargain. No work has quantified whether such a bargain exists. Our empirical contribution it to provide the first quantification of the costs of climate finance to end coal and the net benefits this brings to different countries.
Conclusion
While the rationale for climate finance for developing countries has so far focused on equity considerations, we identify a new rationale: self-interest. Rich countries are made better off by helping poor countries phase out coal. For climate finance to be effective, financing for renewables, as well as compensation for the opportunity cost of coal, should be made conditional on the phase out of coal, such that substantive emission reductions take place and tangible benefits are felt in terms of avoided GDP losses (from climate damages) for rich countries. It seems to us that the most probable way to make “finance flows a reality” at COP27 is to make countries aware of the net gain they can reap from financing the phase out of coal.
By highlighting the net gain countries obtain by providing climate finance, while also still emphasising equity considerations, we stand the best chance to make finance flows consistent with a pathway towards low greenhouse gas emissions and climate-resilient development (Article 2c of the Paris Agreement).
27 settembre 2022
David Bloom, David Canning, Rainer Kotschy, Klaus Prettner, Johannes Schünemann
HEALTH AND ECONOMIC GROWTH: RECONCILING THE MICRO AND MACRO EVIDENCE
(synthesis; full article 7 Sep 2022, – https://cepr.org/voxeu/columns/health-and-economic-growth-reconciling-micro-and-macro-evidence -)
Abstract: Economists use micro-based and macro-based approaches to assess the macroeconomic return to population health. The results of both approaches differ widely, which presents a micro-macro puzzle of the role of health in economic growth. This column resolves this puzzle by showing that the estimated direct effect of health is of similar size in both approaches when holding constant the indirect effects of health that are included in macro-based approaches only. Public health measures, as well as policies that target the indirect effects of health on economic growth, are important levers for fostering economic development.
Keywords: public health; labour productivity,development; macroeconomic policy; labour markets.
Although many contributions in the literature document a positive relationship between population health and macroeconomic performance, the size of this return remains subject to debate (e.g. Acemoglu and Johnson 2007, Bleakley 2007, Weil 2007, Bleakley and Lange 2009, Aghion et al. 2011, Cervellati and Sunde 2011, 2012, Bloom et al. 2014). One reason for this debate is that economists apply two conceptually different methods for estimating the macroeconomic return to population health. Micro-based approaches aggregate the estimated effect of individual health on wages to the macroeconomic level. Macro-based approaches, by contrast, estimate an aggregate production function that decomposes human capital into its components, including population health.
While micro-based approaches document a moderate positive effect of health (Shastry and Weil 2003, Weil 2007), macro-based approaches find estimates that are either negative and close to zero (Caselli et al. 1996, Acemoglu and Johnson 2007, 2014, Hansen and Lønstrup 2015) or 2.5 to 18.5 times larger than micro-based estimates (Barro and Lee 1994, Barro 1997, Bloom and Williamson 1998, Gallup and Sachs 2001, Bloom et al. 2004, Sala-i-Martin et al. 2004, Lorentzen et al. 2008, Aghion et al. 2011, Bloom et al. 2014). This presents a micro-macro puzzle of the macroeconomic return to health. In Bloom et al. (2022), we resolve this puzzle by showing that the estimated direct effect of health on labour productivity is of similar size in both micro-based and macro-based approaches when holding constant the indirect effects of health, which are included in macro-based approaches only.
Direct and indirect macroeconomic effects of health
Health improvements influence the economy through many pathways. Most immediately is a direct effect of better health on worker’s productivity (Bloom and Canning 2002, Currie and Vogl 2012). However, many indirect effects also exist. Better health and higher life expectancy create incentives to invest in education (Cervellati and Sunde 2013) and in innovation (Prettner 2013). In addition, a rising life expectancy fosters saving and therefore physical capital accumulation (Bloom et al. 2007). Finally, better health, particularly that of women, reduces fertility and spurs an economic transition from stagnation toward sustained economic growth (Bloom et al. 2015, 2020).
Micro-based approaches estimate the macroeconomic return to health drawing on evidence of the effect of individual health on labour productivity in a Mincerian wage regression. In this regression, individual characteristics such as health, education, and experience determine labour productivity via the exponential function. Controlling for all effects apart from health, this regression uses individual-level data to estimate health’s direct effect on labour productivity—that is, the microeconomic return to individual health. The micro-based approach then aggregates the microeconomic return to individual health to derive the macroeconomic return to population health by summing over all individuals. Importantly, this approach captures health’s direct effect on labour productivity but not its indirecteffects, which are controlled for in the Mincerian wage regression.
Macro-based approaches, by contrast, decompose aggregate output – which equals aggregate income in a closed economy – into physical capital, human capital, and technology. Specifically, these approaches regress income growth on changes in population health and other control variables. This approach yields health’s direct effect if all indirect effects are comprehensively controlled for. Alternatively, it yields health’s total effect if the regression uses exogenous variation in population health that captures both health’s direct and indirect effects.
Reconciling micro-based and macro-based approaches
The previous discussion stipulates that micro-based and macro-based approaches deliver quantitatively similar results for health’s direct effect on labour productivity. In Bloom et al. (2022), we therefore set up a macro-based model that incorporates a Mincerian wage regression, so that we can compare our results of the macroeconomic return to health with the evidence of the micro-based approach. We estimate this model for a panel of 133 countries observed every five years from 1965 to 2015. Our specifications use within-country variation of population health as measured by the adult survival rate, controlling for past economic development, physical capital accumulation, secondary education, demographic structure, institutions, and time trends.
Our results document a positive effect of population health on income per capita. Likewise, the results for the other variables confirm the signs expected from theory. Lagged economic development exhibits a negative coefficient, which implies conditional convergence. In contrast, capital accumulation, growth of the working-age population, and secondary education promote income per capita. In extended specifications, we show the results’ robustness to the inclusion of additional controls, alternative specifications, and changes in sample composition and sample length. The estimated effect of adult survival on income per capita is quantitatively stable across all specifications and significantly different from zero throughout.
Consistency of micro-based and macro-based estimates
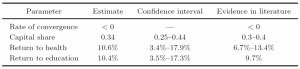
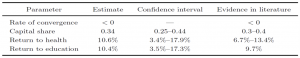
How do these estimates tie in with estimates from the micro-based approach? Table 1 compares our baseline results with those of Weil (2007), which show that an increase in the adult survival rate of ten percentage points raises labour productivity by 6.7% to 13.4% depending on the datasets used in the underlying Mincerian wage regression. Our results indicate that an increase in the adult survival rate of ten percentage points translates into a 10.6% increase in labour productivity (Bloom et al. 2022, p. 14), which falls in the range of plausible estimates reported by Weil (2007). Likewise, the 95% confidence interval of our estimate ranges from 3.4% to 17.9% and includes the plausible values implied by Weil’s (2007) evidence. Hence, the micro-based and macro-based estimates of the direct macroeconomic return to health are quantitatively similar, and the two different approaches are consistent with one another. Moreover, our estimates also match the stylised facts of the empirical literature on the remaining explanatory variables: the estimation results for the rate of convergence, the capital share, and the return to education are qualitatively and quantitatively consistent with evidence from previous empirical studies.
Table 1 Comparison of our estimates with the evidence in the literature
Conclusions
Our results reconcile the micro-based and macro-based evidence of the return to health by showing that the results of both approaches are consistent with one another. Therefore, they provide a rationale for using the micro-based approach to estimate the direct economic benefits of health interventions at the aggregate level. Furthermore, our results indicate that public health measures are an important lever for fostering economic development. Potential policies along these lines are vaccination programs, antibiotic distribution programs, and micronutrient supplementation schemes, which tend to lead to large direct improvements in health (World Bank 1993, WHO 2001, Field et al. 2009, Luca et al. 2018). In addition, policies that target the indirect effects of health on economic growth—such as birth control, family planning, and educational programs (Bloom et al. 2020, Kotschy et al. 2020) – could further promote economic development.
1 agosto 2022
CARSTEN FINK, YANN MÉNIÈRE, ANDREW A. TOOLE, REINHILDE VEUGELERS
The innovation response to the Covid crisis: A new eBook
(synthesis; full article Vox Eu CEPR 30 May 2022 – https://voxeu.org/article/innovation-response-covid-crisis-new-ebook
Abstract: How has the global innovation system fared in the wake of the Covid-19 crisis? A new eBook untangles how the COVID-19 shock affected innovation ecosystems in different parts of the world and how scientists, entrepreneurs, and creative professionals responded to the shock. Innovation not only proved crucial in finding solutions to the crisis, overall the innovation system proved more resilient to the pandemic’s fallout compared to previous crises.
Keywords: Covid-19, Productivity, Innovation, R&D, patents, entrepreneurs, scientific innovation, intellectual property
The World Health Organization declared COVID-19 to be a global pandemic on 11 March 2020. Not only has COVID-19 caused massive losses to public health worldwide, it also prompted major economic havoc worldwide (e.g. Bénassy-Quéré and Weder di Mauro 2020 for Europe, Djankov and Panizza 2020 for developing countries, and more analysis on Vox here). The decline in global GDP in 2020 turned out to be the biggest annual decline since WWII (Gopinath 2021, IMF 2021).
Previous crises have shown that innovators, despite their long-term focus, are not immune to short-term disruptions. During the 2007-2008 global financial crisis and the following Great Recession, for example, firms experienced curtailed access to finance for innovation (Lee et al. 2015) and were less able and willing to invest in innovation (Archebugi et al. 2013). Fiscal contraction in the general economy, in turn, put pressure on aggregate demand and public budgets to support research (Cruz-Castro and Sanz-Menéndez 2016). At the same time, crises can also be a catalyst for innovation, as they alter societies’ immediate and future technological needs. This was manifestly the case for innovative activity during WWII, which prompted major research efforts in the US to develop military technologies and medical treatments to support the war and laid the foundation for many postwar innovations and innovation policy (Gross and Sampat 2020).
How did the innovation system respond to the Covid-19 crisis? A new eBook from CEPR, the European Patent Office (EPO), the US Patent and Trademark Office (USTPO), and the World Intellectual Property Organization (WIPO) takes a first step toward understanding what happened in different parts of the world and how different actors in the innovation ecosystem – private and not-for-profit organisations, governments, and individuals – adjusted (Fink et al. 2022).
Impact across the world: Much similarity, some divergence
The first part of the eBook provides insights into the short-term response of innovators at the global and national levels, as captured by intellectual property (IP) application trends during the first two years of the pandemic. It draws a comprehensive picture of the unfolding of the crisis in the IP world, from which a number of important lessons emerge.
First, the impact of the pandemic on the filing of patents, trademarks and other IP rights has been less severe compared to previous crises such as the bursting of the dotcom bubble in the early 2000s or the Great Recession. Patent filings around the world were negatively hit, but declines proved shallow and short-lived – typically confined to the weeks and months following the pandemic’s onset in March 2020 (see Figure 1 for international patent applications).
Figure 1 International patent applications in crisis times
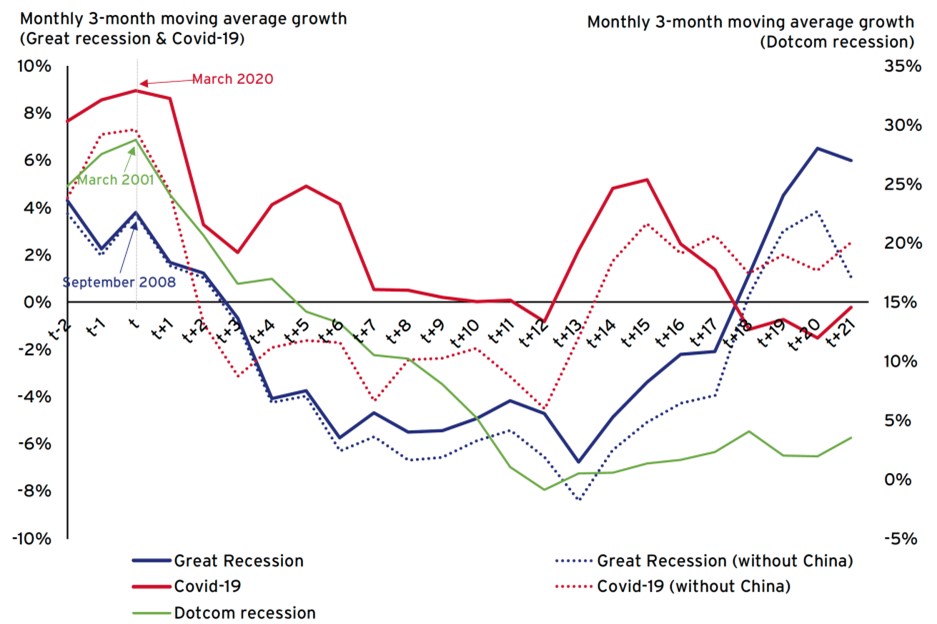
Notes: International patent applications refer to applications filed in the international phase of the Patent Cooperation Treaty (PCT). The figures presented are monthly 3-month moving average growth rates relative the same period in the previous year. Patent counts are based on the international filing date of PCT applications, either at national/regional patent offices or directly at WIPO.
Source: WIPO IP Statistics Database
The crisis nonetheless left its mark on patenting performance across economies and across technology fields. China and the Republic of Korea stand out as the least impacted economies, seeing continued growth in patenting.1 The fastest growing fields of patenting include health-related technologies (pharmaceuticals, biotechnologies, medical technologies) and digital technologies (e.g. digital communication, computer technologies). While already on the rise before 2020, the urgent needs created by the pandemic boosted innovation in these two fields. Conversely, the COVID-19 crisis aggravated the relative decline of patenting in more traditional technology sectors, such as mechanical engineering.
China and the Republic of Korea largely benefitted from this trend, thanks to their specialisation in digital innovation. Both countries showed sustained activity of large incumbent firms as well as local start-ups in this sector during the pandemic. By contrast, the relative specialisation of Germany and Japan in more traditional engineering-based industries may explain why the crisis had a more pronounced negative effect on patent filings from these two countries.
Other indicators confirm the overall resilience of innovative activities. Evidence from the US shows that R&D expenditures by companies exhibited less volatility than investments in physical capital. However, the crisis seems to have impacted some categories of smaller, budget-constrained innovators more severely. US and European SMEs often had to scale down their investments in patented innovations and reported a lack of funding for such investments. Evidence from Brazil also reveals that patenting decreased more among individual micro-entrepreneurs, micro-enterprises and small businesses than among larger companies, with one notable exception: there was a considerable uptake of utility models by local micro-entrepreneurs as the pandemic unfolded.
More broadly, many contributions to the eBook provide evidence for vibrant entrepreneurship unleashed by the crisis and fostered by the rapid adoption of digital technologies. This is evident in trademark filing trends – capturing the commercialisation of new goods and services. Figure 2 depicts the evolution of international trademark filings in the course of the three crises discussed earlier. The COVID-19 crisis stands out in showing the shallowest decline, followed by an extraordinary boom in international trademark applications about a year into the crisis. Healthcare products and ecommerce-related goods and services, broadly mirroring the patenting focus, were one key driver behind this recovery, even if the prominence of different product groups varied across economies.
Figure 2 International trademark applications in crisis times
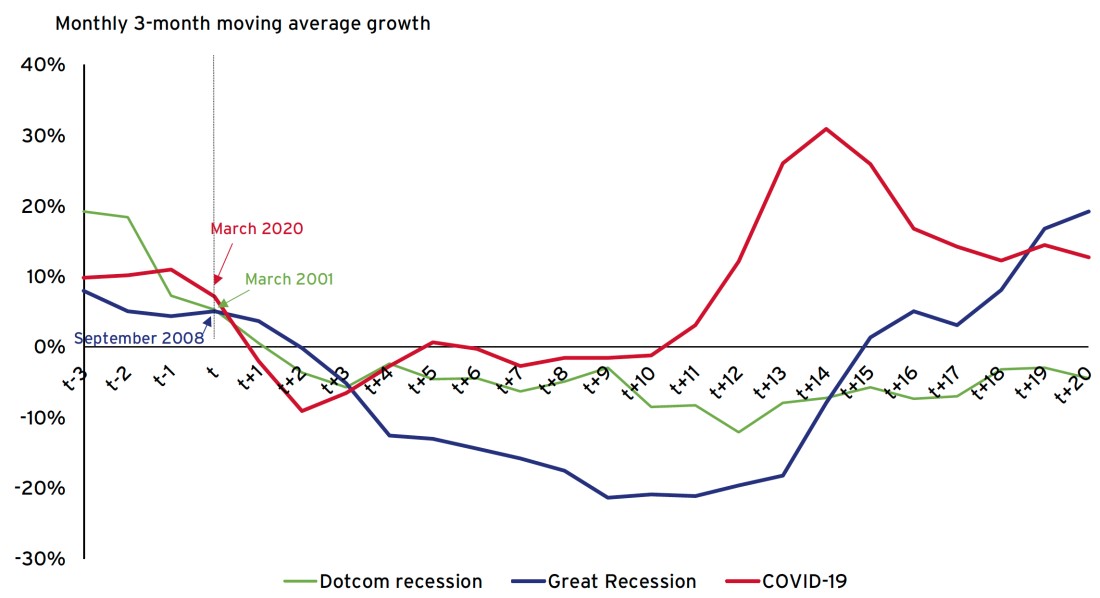
Notes: International trademark applications refer to applications filed under WIPO’s Madrid System. Figures are presented according to the Madrid filing date.
Source: WIPO IP Statistics Database
More explicit measures of entrepreneurship – presented in the contributions from the Republic of Korea (Chapter 8) and Australia (Chapter 10) – confirm a surge in business entries and startup activity in 2021. Interestingly, a similar startup boom occurred in the midst of the Spanish flu pandemic in 1919 (Beach et al. 2020), highlighting how societal disruption generates momentum to start new activities for those entrepreneurs willing and able to take the risk amidst high overall uncertainty.
Responses in the innovation ecosystem
The second part of the eBook focuses on how different segments of the innovation ecosystem responded to the COVID-19 pandemic. One focus is the science sector. Survey evidence from the US (Chapter 12) reveals that total research time decreased substantially for all academic researchers, but these losses were not uniform across scientific fields of study or types of researchers. Women researchers and researchers with children were most heavily affected and the crisis may have permanently altered their scientific career opportunities. The chapter argues that the policy responses by academic institutions may prove insufficient to address these adverse outcomes and may have even accentuated them.
A second focus is how the biomedical innovation ecosystem responded to the crisis. Among other contributions, Chapter 15 tells the story of the mRNA Covid-19 vaccine. It highlights the difficulty of obtaining early-stage financial support for innovation. Only a handful of stubborn scientists, start-up entrepreneurs, angel investors and policy officers at the US Defense Advanced Research Projects Agency were willing to fund the high risk of the high-gain mRNA technology in its early years. In hindsight, the COVID-19 vaccines based on mRNA technologies made crucial contributions to overcoming the impacts of COVID-19, but society could easily have missed out on them.
Policy takeaways and outlook
Overall, the eBook concludes that the global innovation system proved to be resilient to the Covid-19 pandemic and its ingenuity contributed much towards addressing it. Policy support was instrumental for both.
Fiscal support measures cushioned the demand shocks, helping businesses stay solvent and workers to stay employed (Gourinchas et al. 2021). The destruction of productive intangible capital could have been far worse. Monetary policy support, in turn, enabled the continued availability of financing for innovation and fuelling the entrepreneurship wave described above (WIPO 2021). As financial conditions have tightened more recently (through 2022), the availability of risk capital has sharply declined. This raises the question of whether the loose monetary conditions and fiscal policies during the crisis generated an unsustainable degree of ‘innovative exuberance’.
A second takeaway is that policymakers should not take the ingenuity of the innovation system for granted. As already pointed out, the mRNA technology could have been easily missed by a short-sighted, risk-averse innovation support system. To be able to count on the innovation system to quickly deliver powerful solutions to societal challenges, innovation policy should take a longer-term, proactive perspective, supporting new ideas which have the potential to become breakthroughs in their early high-risk phases. Continuous investments in scientific research remain crucial in generating the knowledge underlying technological breakthroughs.
Of course, the crisis is not over at this time and our understanding of its ramifications will remain imperfect for some time to come. While most countries have lifted many of the public health measures put in place to stem the pandemic, COVID-19 mutations are still spreading around the world. The management of future infection waves may cause less disruption than during the pandemic’s first two years – thanks in large part to recent innovations in biomedical and digital solutions. However, it will surely continue to leave a mark on innovation systems.
More research is also needed to deepen our understanding of how innovators responded to the crisis. The full bibliographical details of patent applications are typically only published with a delay of 18 months. Thus, bibliographical data for patents for inventions that occurred after the pandemic’s onset have only recently become available. Future studies can thus shed more light on how different innovation stakeholders will have responded, including the effects on individual inventors and on collaboration across institutions and across countries.
4 luglio 2022
MAKSYM CHEPELIEV, MARYLA MALISZEWSKA, ISRAEL OSORIO RODARTE, MARIA FILIPA SEARA E PEREIRA, DOMINIQUE VAN DER MENSBRUGGHE
Globalisation, not localisation, is the key to post-pandemic prosperity
(synthesis; full article 30 may 2022 – https://voxeu.org/article/globalisation-not-localisation-key-post-pandemic-prosperity)
Abstract: Growing economic nationalism and protectionism in recent years have tested the resilience of global value chains. This column argues that policies that are supportive of rather than hostile to trade could prove critical to strengthen a recovery from the pandemic and reduce extreme poverty in developing countries. Measures to enhance trade could boost integration into global value chains, increase incomes, and lift over 21 million additional people out of poverty by 2030. A more supportive environment for trade also boosts resilience to future supply shocks by supporting diversification and widening access to raw materials, goods, and services.
Keywords: Covid-19 International trade, global value chains, reshoring, localisation, globalisation, Trade barriers
In recent years, extreme weather events and trade tensions spurred by growing economic nationalism and protectionism have tested the resilience of global value chains (GVCs). The sudden and massive Covid-19 induced drop in global trade in the first half of 2020 dealt them another blow (WTO 2020), prompting predictions that the pandemic would result in restructuring of the GVCs, shortening the supply chains, and leading to reshoring (Javorcik 2020, Kilic and Marin 2020). Then, as the world economy was still recovering from Covid-19, the war in Ukraine caused more major disruptions to GVCs, hitting developing countries particularly hard (Chepeliev et al. 2022, Ruta 2022).
Recent studies suggest that GVCs transmit shocks to production and trade from one country to another. On the other hand, participation in GVCs may soften the blow of a domestic shock such as a lockdown (Espitia et al. 2021) or natural disaster like the 2011 earthquake in Japan (Freund et al. 2021), by ensuring access to critical inputs when foreign markets are closed. GVCs can also drive a recovery, spreading the benefits as countries emerge from lockdowns or lift trade restrictions at varying paces.
What further shocks to GVCs should we expect in coming years? Is it possible to design policies to help developing countries enhance resilience to trade shocks without endangering growth?
In a new paper (Chepeliev et al. 2022b), we couple ENVISAGE, a state-of-the-art global economic model (van der Mensbrugghe 2019), with the GIDD microsimulation framework (Bussolo et al. 2010) to simulate three scenarios: (1) high-income economies and China raise barriers to imports and increase domestic subsidies to re-shore production (‘Reshoring leading economies’), (2) wider localisation when developing countries join the reshoring efforts (‘Reshoring all’), and (3) developing countries seek to reduce trade costs and make it easier to use imports in domestic production (‘GVC Friendly Liberalisation + Trade Facilitation (TF)’).
The risk of reshoring and the fruits of liberalisation
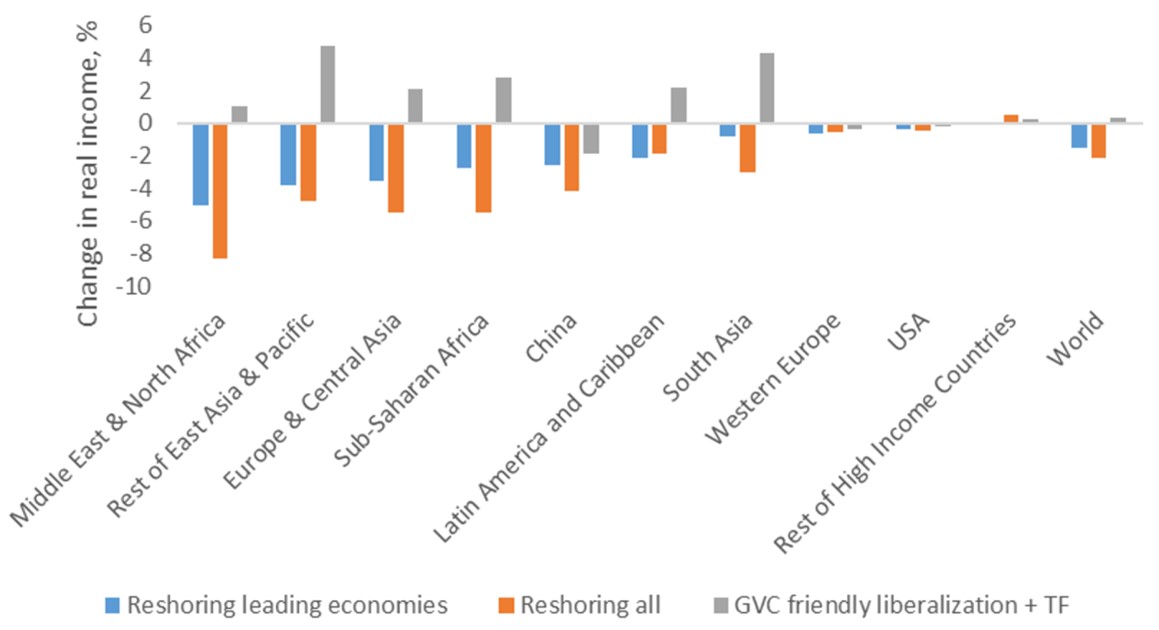
A possible reshoring of production by the leading economies and China would have a negative impact in most regions, with real income decreasing by 1.5% worldwide. A localised world takes the biggest toll on developing countries with the Middle East and North Africa, Rest of East Asia and Pacific, and Europe and Central Asian regions being hit the most severely (Figure 1). However, countries subsidising domestic production would also be worse off as reshoring decreases trade and income, limits the variety of products available to producers and consumers, and increases prices.
To counter the impact on regions that are highly dependent and integrated into GVCs, developing countries may be tempted to respond with their own reshoring policies. But such a response would only compound the damage done when leading economies re-shore production (Figure 1). Developing countries have an alternative. They could mitigate the damage by adopting policies that are more GVC-friendly and support greater integration. This response would produce gains across all developing regions.
Figure 1 Percent change in real income under various scenarios relative to baseline in 2030
Implications for global value chains
In the ‘Reshoring all’ scenario, the global average GVC participation rate for the sectors highly involved with GVCs1 could fall by over 6% in 2030 relative to the baseline. The ‘Reshoring leading economies’ scenario could have a moderate positive impact on GVC participation in selected countries. As trade shifts toward higher-value and more GVC-integrated goods like computers and electronics, Malaysia, Thailand, and Vietnam all become more integrated into GVCs (Figure 2).
It is through ‘GVC friendly liberalisation and trade facilitation’ efforts, when a major positive impact on the GVC participation for sectors under consideration is observed (Figure 2). For most developing countries, corresponding increase in GVC participation is above 10%. Leading economies also see substantial gains, with China benefiting the most with a GVC participation rate increase of more than 20%. Deeper GVC participation translates into faster growth.
Figure 2 Percent change in the global value chain participation rate relative to the baseline scenario in 2030

Note: Estimates are reported for the sectors identified in endnote 1. Columns on the figure report a decomposition of the trade policy impacts. ‘Reshoring all’ case provides impacts relative to the baseline; ‘Reshoring leading economies’ case reports impacts relative to the ‘Reshoring all’ case; and ‘GVC friendly’ option measures impacts relative to the ‘Reshoring leading economies’ case. ‘Total impact’ reports the sum over all three bars and corresponds to the impact of the ‘GVC friendly’ scenario relative to the baseline case.
Developing countries are more resilient to supply shocks in a globalised world
In the ‘Reshoring all’ world, countries face higher trade barriers and have less ability to substitute between domestic and imported commodities or to choose among different import sources. In the ‘GVC-friendly’ world both developed and developing regions are more resilient in the face of disruptions in production or supply chains.
We showcase such differences by looking into a stylised experiment of a supply shock to Thailand’s electronics sector (10% reduction in total factor productivity in 2027) in a similar way in which the floods limited the output of electronics in Thailand in 2010 (e.g. Haraguchi and Lall 2015). We show that in a globalised world, the real income of Thailand’s consumers declines less than in the localised world, indicating a higher level of economic resiliency.
Due to the lower trade barriers and higher trade substitution possibilities, the output of Thailand’s electronics falls more in the ‘GVC-friendly’ world. At the same time, the output of all other sectors increases substantially (compared to the ‘Reshoring all’ scenario) as some resources are shifted away from electronics production. While exports of electronics are hit more in the ‘GVC-friendly’ world, exports of other goods increase, and the export-to-import ratio also grows faster for these sectors (Figure 3). Thailand’s real income is affected less dramatically in the liberalised world.
Figure 3 Impact on the economy of Thailand in 2027 (percent change relative to the corresponding scenario without shock)

Notes: Clustered columns show changes in Thailand’s output by sectors. Scatter plots show changes in the exports-to-imports ratio. All changes are shown relative to the corresponding scenario without shock to Thailand’s electronics production.
GVC-friendly liberalisation could lift over 21 million people from extreme poverty
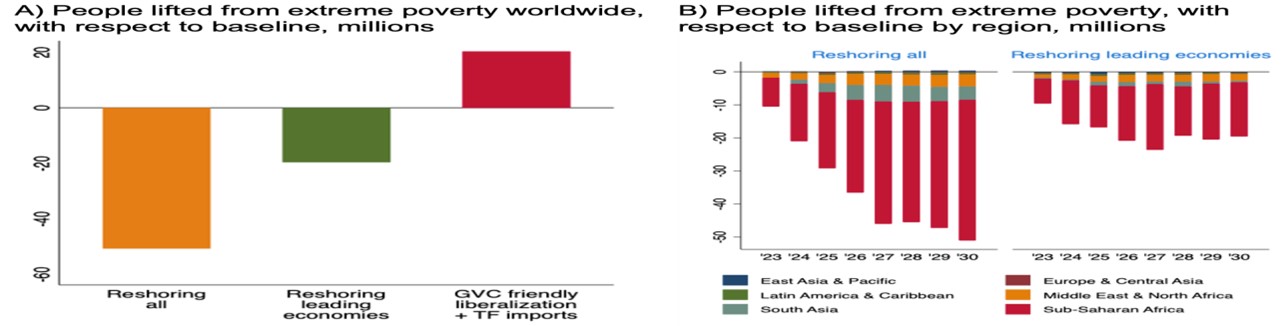
Reshoring efforts could also jeopardise the goal of poverty elimination. By 2030, reshoring efforts by leading economies would lead to an increase in the number of people living in extreme poverty by 19.4 million (Figure 4, Panel A). Under the ‘Reshoring all’ scenario, 51.8 million additional people would fall into extreme poverty by 2030, the equivalent to a 0.6% increase in the global extreme poverty headcount ratio. Sub-Saharan Africa is the most affected region under reshoring policies, accounting for around 80% of the new poor, followed by South Asia and the Middle East and North Africa region.
The ‘GVC-friendly’ scenario, on the other hand, could lift 21.5 million people from extreme poverty by 2030. South Asia, which has been hit particularly hard by the Covid-19 pandemic, benefits the most in terms of poverty eradication in the globalised world. In addition, we find that 56.2 million would graduate to global middle-class status, measured as individuals with a per capita consumption of more than PPP $10.00 a day. More than half of the new entrants in the global middle-class, or 30.9 million, would be in South Asia, and between 6.3 and 7.2 million would come from each of the three other developing regions.
Figure 4 Distributional impacts
Conclusion
The Covid-19 pandemic, trade tensions, wars, and extreme weather events all test the resilience of GVCs. Serving both as transmitters and buffers of external disruptions, GVCs can endanger future economic growth by transmitting negative production and trade shocks from one country to another. They can also drive growth by spreading the benefits of the recovery policies across countries.
While recent and ongoing events have taken a heavy toll on the world economy, fuelling an already heated debate around the benefits and costs of global supply chains, GVC restructuring in the form of reshoring is not the solution. If on a post-Covid recovery path leading economies and China decided to re-shore production, this would have a harmful impact on most countries, particularly in developing regions, leaving them more vulnerable. Having all economies re-shore would compound the damage.
The best policy response to reshoring by leading countries is to make developing economies more GVC-friendly. Elimination of input tariffs and implementation of trade facilitation measures would strengthen the integration of developing countries into regional and global value chains. The gains would be evident in all developing regions through an increase in real incomes and a reduction in extreme poverty. Becoming more GVC-friendly also makes developing countries more resilient to shocks.
17 giugno 2022
MAKSYM CHEPELIEV, MARYLA MALISZEWSKA, ISRAEL OSORIO RODARTE, MARIA FILIPA SEARA E PEREIRA, DOMINIQUE VAN DER MENSBRUGGHE
Globalisation, not localisation, is the key to post-pandemic prosperity
(synthesis; full article – Vox Eu CEPR 30 May 2022 – https://voxeu.org/article/globalisation-not-localisation-key-post-pandemic-prosperity)
Abstract: Growing economic nationalism and protectionism in recent years have tested the resilience of global value chains. This column argues that policies that are supportive of rather than hostile to trade could prove critical to strengthen a recovery from the pandemic and reduce extreme poverty in developing countries. Measures to enhance trade could boost integration into global value chains, increase incomes, and lift over 21 million additional people out of poverty by 2030. A more supportive environment for trade also boosts resilience to future supply shocks by supporting diversification and widening access to raw materials, goods, and services.
Keywords: COVID-19 international trade, global value, chains, reshoring, localisation, globalisation, Trade barriers
In recent years, extreme weather events and trade tensions spurred by growing economic nationalism and protectionism have tested the resilience of global value chains (GVCs). The sudden and massive Covid-19 induced drop in global trade in the first half of 2020 dealt them another blow (WTO 2020), prompting predictions that the pandemic would result in restructuring of the GVCs, shortening the supply chains, and leading to reshoring (Javorcik 2020, Kilic and Marin 2020). Then, as the world economy was still recovering from Covid-19, the war in Ukraine caused more major disruptions to GVCs, hitting developing countries particularly hard (Chepeliev et al. 2022, Ruta 2022).
Recent studies suggest that GVCs transmit shocks to production and trade from one country to another. On the other hand, participation in GVCs may soften the blow of a domestic shock such as a lockdown (Espitia et al. 2021) or natural disaster like the 2011 earthquake in Japan (Freund et al. 2021), by ensuring access to critical inputs when foreign markets are closed. GVCs can also drive a recovery, spreading the benefits as countries emerge from lockdowns or lift trade restrictions at varying paces.
What further shocks to GVCs should we expect in coming years? Is it possible to design policies to help developing countries enhance resilience to trade shocks without endangering growth?
In a new paper (Chepeliev et al. 2022b), we couple ENVISAGE, a state-of-the-art global economic model (van der Mensbrugghe 2019), with the GIDD microsimulation framework (Bussolo et al. 2010) to simulate three scenarios: (1) high-income economies and China raise barriers to imports and increase domestic subsidies to re-shore production (‘Reshoring leading economies’), (2) wider localisation when developing countries join the reshoring efforts (‘Reshoring all’), and (3) developing countries seek to reduce trade costs and make it easier to use imports in domestic production (‘GVC Friendly Liberalisation + Trade Facilitation (TF)’).
The risk of reshoring and the fruits of liberalisation
A possible reshoring of production by the leading economies and China would have a negative impact in most regions, with real income decreasing by 1.5% worldwide. A localised world takes the biggest toll on developing countries with the Middle East and North Africa, Rest of East Asia and Pacific, and Europe and Central Asian regions being hit the most severely (Figure 1). However, countries subsidising domestic production would also be worse off as reshoring decreases trade and income, limits the variety of products available to producers and consumers, and increases prices.
To counter the impact on regions that are highly dependent and integrated into GVCs, developing countries may be tempted to respond with their own reshoring policies. But such a response would only compound the damage done when leading economies re-shore production (Figure 1). Developing countries have an alternative. They could mitigate the damage by adopting policies that are more GVC-friendly and support greater integration. This response would produce gains across all developing regions.
Figure 1 Percent change in real income under various scenarios relative to baseline in 2030

Implications for global value chains
In the ‘Reshoring all’ scenario, the global average GVC participation rate for the sectors highly involved with GVCs1 could fall by over 6% in 2030 relative to the baseline. The ‘Reshoring leading economies’ scenario could have a moderate positive impact on GVC participation in selected countries. As trade shifts toward higher-value and more GVC-integrated goods like computers and electronics, Malaysia, Thailand, and Vietnam all become more integrated into GVCs (Figure 2).
It is through ‘GVC friendly liberalisation and trade facilitation’ efforts, when a major positive impact on the GVC participation for sectors under consideration is observed (Figure 2). For most developing countries, corresponding increase in GVC participation is above 10%. Leading economies also see substantial gains, with China benefiting the most with a GVC participation rate increase of more than 20%. Deeper GVC participation translates into faster growth.
Figure 2 Percent change in the global value chain participation rate relative to the baseline scenario in 2030
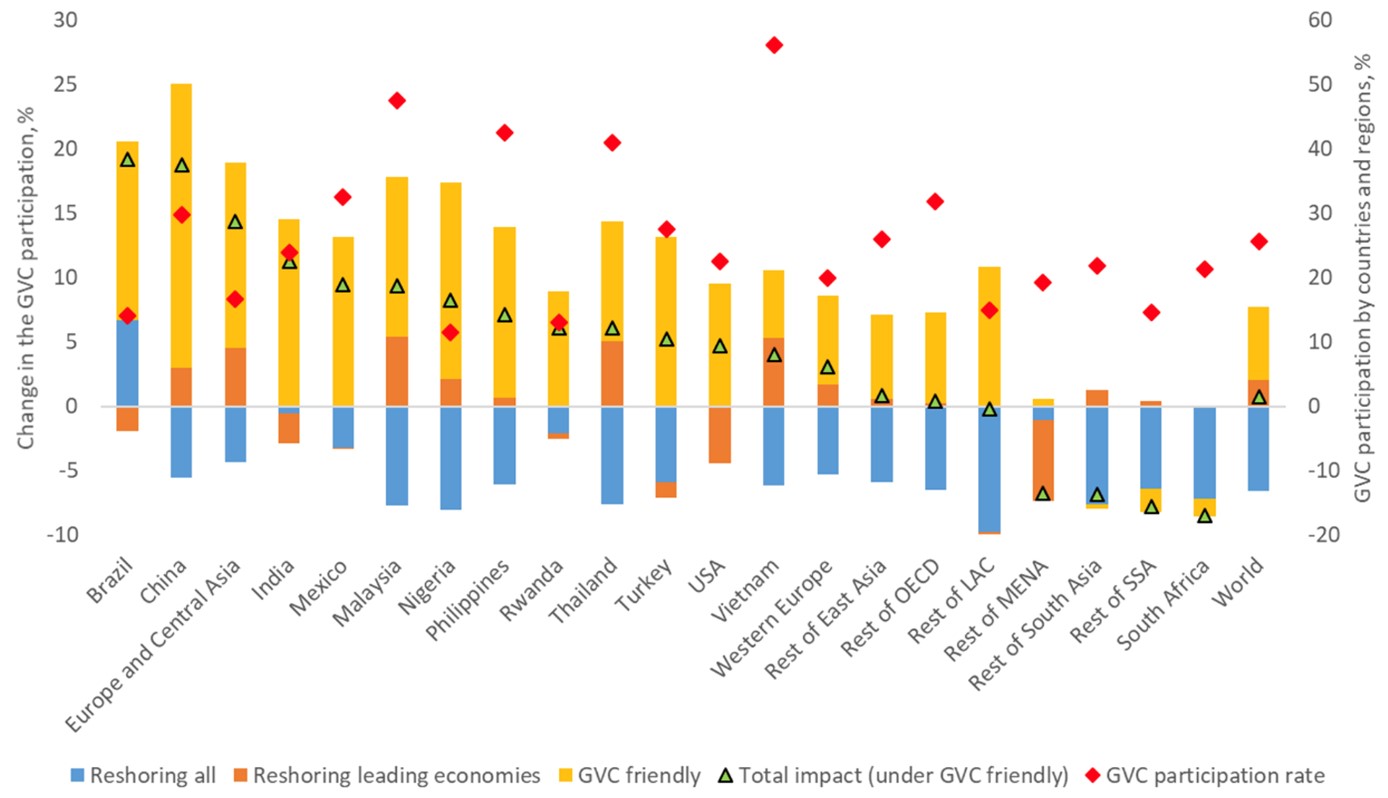
Note: Estimates are reported for the sectors identified in endnote 1. Columns on the figure report a decomposition of the trade policy impacts. ‘Reshoring all’ case provides impacts relative to the baseline; ‘Reshoring leading economies’ case reports impacts relative to the ‘Reshoring all’ case; and ‘GVC friendly’ option measures impacts relative to the ‘Reshoring leading economies’ case. ‘Total impact’ reports the sum over all three bars and corresponds to the impact of the ‘GVC friendly’ scenario relative to the baseline case.
Developing countries are more resilient to supply shocks in a globalised world
In the ‘Reshoring all’ world, countries face higher trade barriers and have less ability to substitute between domestic and imported commodities or to choose among different import sources. In the ‘GVC-friendly’ world both developed and developing regions are more resilient in the face of disruptions in production or supply chains.
We showcase such differences by looking into a stylised experiment of a supply shock to Thailand’s electronics sector (10% reduction in total factor productivity in 2027) in a similar way in which the floods limited the output of electronics in Thailand in 2010 (e.g. Haraguchi and Lall 2015). We show that in a globalised world, the real income of Thailand’s consumers declines less than in the localised world, indicating a higher level of economic resiliency.
Due to the lower trade barriers and higher trade substitution possibilities, the output of Thailand’s electronics falls more in the ‘GVC-friendly’ world. At the same time, the output of all other sectors increases substantially (compared to the ‘Reshoring all’ scenario) as some resources are shifted away from electronics production. While exports of electronics are hit more in the ‘GVC-friendly’ world, exports of other goods increase, and the export-to-import ratio also grows faster for these sectors (Figure 3). Thailand’s real income is affected less dramatically in the liberalised world.
Figure 3 Impact on the economy of Thailand in 2027 (percent change relative to the corresponding scenario without shock)
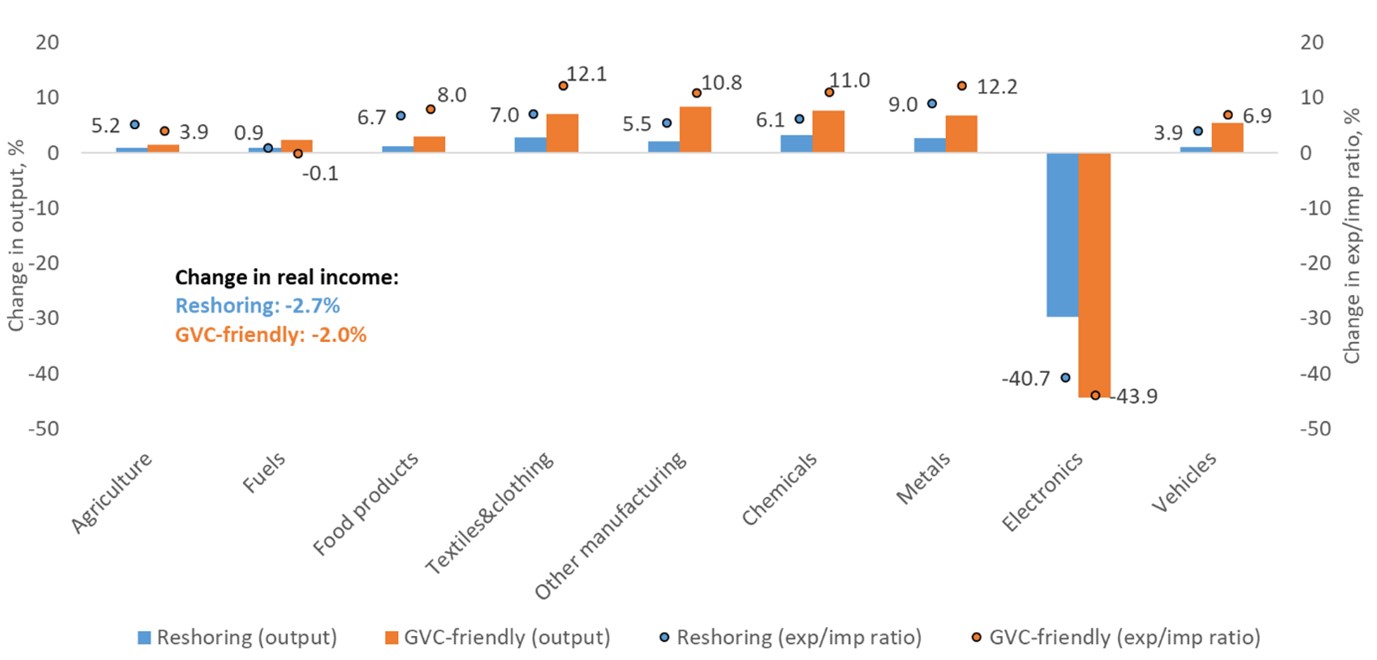
Notes: Clustered columns show changes in Thailand’s output by sectors. Scatter plots show changes in the exports-to-imports ratio. All changes are shown relative to the corresponding scenario without shock to Thailand’s electronics production.
GVC-friendly liberalisation could lift over 21 million people from extreme poverty
Reshoring efforts could also jeopardise the goal of poverty elimination. By 2030, reshoring efforts by leading economies would lead to an increase in the number of people living in extreme poverty by 19.4 million (Figure 4, Panel A). Under the ‘Reshoring all’ scenario, 51.8 million additional people would fall into extreme poverty by 2030, the equivalent to a 0.6% increase in the global extreme poverty headcount ratio. Sub-Saharan Africa is the most affected region under reshoring policies, accounting for around 80% of the new poor, followed by South Asia and the Middle East and North Africa region.
The ‘GVC-friendly’ scenario, on the other hand, could lift 21.5 million people from extreme poverty by 2030. South Asia, which has been hit particularly hard by the Covid-19 pandemic, benefits the most in terms of poverty eradication in the globalised world. In addition, we find that 56.2 million would graduate to global middle-class status, measured as individuals with a per capita consumption of more than PPP $10.00 a day. More than half of the new entrants in the global middle-class, or 30.9 million, would be in South Asia, and between 6.3 and 7.2 million would come from each of the three other developing regions.
Figure 4 Distributional impacts

Conclusion
The Covid-19 pandemic, trade tensions, wars, and extreme weather events all test the resilience of GVCs. Serving both as transmitters and buffers of external disruptions, GVCs can endanger future economic growth by transmitting negative production and trade shocks from one country to another. They can also drive growth by spreading the benefits of the recovery policies across countries.
While recent and ongoing events have taken a heavy toll on the world economy, fuelling an already heated debate around the benefits and costs of global supply chains, GVC restructuring in the form of reshoring is not the solution. If on a post-Covid recovery path leading economies and China decided to re-shore production, this would have a harmful impact on most countries, particularly in developing regions, leaving them more vulnerable. Having all economies re-shore would compound the damage.
The best policy response to reshoring by leading countries is to make developing economies more GVC-friendly. Elimination of input tariffs and implementation of trade facilitation measures would strengthen the integration of developing countries into regional and global value chains. The gains would be evident in all developing regions through an increase in real incomes and a reduction in extreme poverty. Becoming more GVC-friendly also makes developing countries more resilient to shocks.
23 maggio 2022
PATRICIO GOLDSTEIN, EDUARDO LEVY YEYATI, LUCA SARTORIO
Lockdown fatigue: The declining effectiveness of lockdowns
(synthesis; full article – Vox Eu CEPR 30 March 2022 – https://voxeu.org/article/declining-effectiveness-lockdowns)
Abstract: Non-pharmaceutical interventions have been key to containing the impact of the COVID-19 pandemic. This column examines whether the effectiveness of lockdowns on the virus’s spread and death toll has changed over the past year, using data from 152 countries from the onset of the pandemic through 31 December 2020. Initially, lockdowns are associated with a significant reduction in the spread of the virus and the number of related deaths, but this effect declines over time. Lockdown does not work as a continuous containment policy in the event of a protracted pandemic.
Keywords: Covid-19, containment, coronavirus, lockdown, non-pharmaceutical interventions, lockdown fatigue
A growing and diverse literature is emerging on the COVID-19 pandemic’s socioeconomic effects and the efficacy of alternative mitigating policies. A series of empirical studies have provided preliminary findings on the impact of non-pharmaceutical interventions on health outcomes. Focused on the initial months of the pandemic, these studies have for the most part documented significant effects in reducing the spread of the virus (Askitas et al. 2020a,b, Wong et al. 2020, Deb et al. 2020a,b, Li et al. 2020, Caselli et al. 2020).
However, because they are based on data from the first semester of 2020, they fail to capture the incidence of lockdown fatigue, namely, non-linear effects due to the cumulative economic and psycho-sociological burden of the restrictions and the diminishing degree of compliance.1
In a recent paper (Goldstein et al. 2021), we evaluate the effectiveness of lockdowns and de facto declines in mobility been over time. To do this, we build a panel dataset of 152 countries with data from the onset of the pandemic until 31 December 2020, including two high-frequency cross-country metrics of restrictions to social interactions:
- The Stringency Index from Oxford´s COVID-19 Government Response Tracker, which measures the rigidity of school closures, workplace closures, restrictions on public events, among others containment policies
- Google’s measure of workplace mobility based on anonymised location history data from Google Maps.
We analyse the impact of both metrics on the effective reproduction number (Rt) and the evolution of COVID-19 deaths per million. To estimate the effect of non-pharmaceutical interventions over time, we follow Deb et al. (2020a,b) in their use of the local projections methodology, first introduced by Jordà (2005).
By estimating one-step-ahead ordinary regressions for each time period – instead of approximating the data globally through, for example, a vector autoregression – local projections provide impulse-response functions that are not only more suitable for non-linear and flexible relations but also less susceptible to misspecification as well as more amenable to statistical inference.
Figure 1 shows the estimated dynamic response of cumulative and daily growth rates of the reproduction number and the number of deaths per million (7-day averages to smooth out reporting and seasonal noise) to a change of one standard deviation in the Stringency Index over the 90-day period following the intensification of containment measures.
Stringency is associated with a gradual, significant, and negative variation of the spread of the virus and COVID-19-related deaths. The effect is fairly persistent: its cumulative effect on deaths peaks at about 60 days after the increase in intensity; the effect on the reproduction rate peaks at 20 days. Similar results are observed when analysing Google mobility data, confirming the findings of the previous literature.
Figure 1 Impact of OxCGRT Stringency Index on effective reproduction rate and COVID-19-related deaths
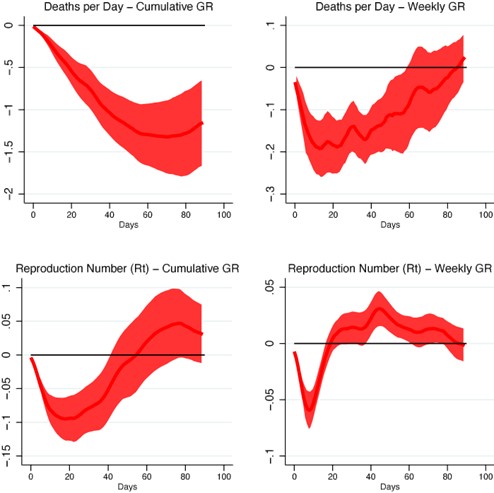
Notes: The graph represents the estimated impulse-response function for a change of one standard deviation in the OxCGRT Stringency Index. The shaded area represents the 90% confidence interval for the coefficient.
Source: Goldstein et al. (2021).
How long does this effect last? More precisely, how much is lost if we go from a one-month to a four-month lockdown – would lockdowns have the same effectiveness if resorted to in subsequent waves of the pandemic?
To do assess that, we include a length dummy that equals 1 after 120 days of strict (and possibly intermittent) lockdown and interact it with the policy variables: stringency and mobility. As can be seen in Figure 2, there are significant differences in the effect of distancing measures in reducing deaths from COVID-19 when comparing the onset of the pandemic with its re-imposition (proxied by the interaction with the length dummy).
Containment policies generate lower reductions in deaths from COVID-19 than in the first stage of the epidemic, and the effect tends to lose its statistical significance faster. By contrast, no significant differences are observed between the two phases of the pandemic for impact on the reproduction rate.
Figure 2 Impact of OxCGRT Stringency Index on effective reproduction rate and COVID-19-related deaths (coefficient and interaction term at 120 days)
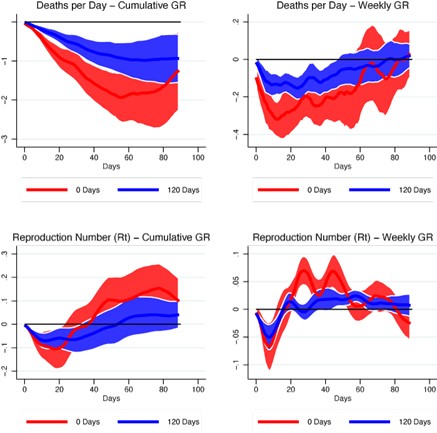
Notes: The graph represents the estimated impulse-response function for a change of one standard deviation in the OxCGRT Stringency Index, including the effect of the duration-Stringency interaction valued at the specified period. The shaded area represents the 90% confidence interval for the linear combination.
Source: Goldstein et al. (2021).
A priori, it could be assumed that the fading impact of the lockdown may owe in part to the fact that compliance with mobility restrictions is hard to sustain economically and socially for long periods of time (Levy Yeyati and Sartorio 2020). If that were the case, one would expect that the estimated effect of the de jure stringency should decline by more than the effect of the de facto mobility variations, simply because de jure restrictions are increasingly ignored.
Indeed, when analysing the effect of more stringent containment policies in reducing workplace mobility (Figure 3), we can see that the impact of the Stringency Index on workplace mobility, while significant, tends to weaken after 120 days of strict lockdown.
Figure 3 Impact of OxCGRT Stringency Index on Google workplace mobility (coefficient and interaction term at 120 days)
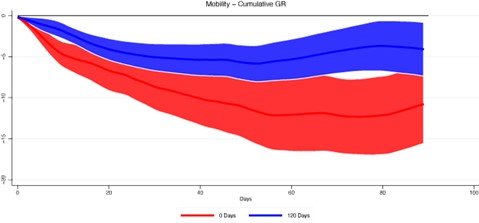
Notes: The graph represents the estimated impulse-response function for a change of one standard deviation in the OxCGRT Stringency Index, including the effect of the duration-Stringency interaction valued at the specified period. The shaded area represents the 90% confidence interval for the linear combination. Source: Goldstein et al. (2021).
However, even if we take as given an increase in de facto non-compliance, the time pattern of the impact of mobility restrictions is still there: after 120 days of strict lockdown, a decrease in workplace mobility has a significantly more attenuated effect on the reduction of COVID-19 deaths and does not have a significant impact on Rt (Figure 4). In other words, non-pharmaceutical interventions lose their effectiveness beyond the effect of diminishing compliance, suggesting other channels may also be affected by lockdown fatigue.
Figure 4 Impact of Google Workplace Mobility on effective reproduction rate and COVID-19-related deaths (coefficient and interaction term at 120 days)
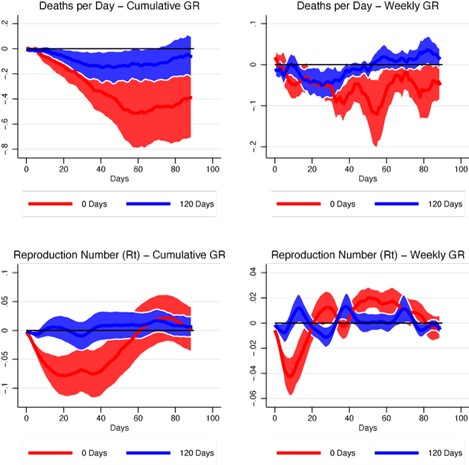
Notes: The graph represents the estimated impulse-response function for a change of one standard deviation in the Google Workplace Mobility index, including the effect of the duration-Mobility interaction valued at the specified period. The shaded area represents the 90% confidence interval for the linear combination.
Source: Goldstein et al. (2021).
Conclusions
These results suggest that restrictions applied for a long period or reintroduced late in the pandemic (for example, in the event of a resurgence of cases) would exert, at best, a weaker, attenuated effect on the circulation of the virus and the number of casualties. Combined with the results in Haug et al. (2020), they suggest that lockdowns should be strict and brief.
These findings are particularly relevant for emerging and developing countries that may face considerable delays in the start of massive vaccination campaigns and will likely face successive waves of infections without having achieved herd immunity levels. After a year of strong economic downturn and substantial health costs, the intensity of lockdowns continues to be an influential factor in the economic and social life of low- and middle-income countries. Even if restrictions played a role early on, they had a one-off effect that would be hard to replicate going forward. This suggests that the heavy reliance on lockdowns as in the early stages of the pandemic may not be advised.
17 maggio 2022
TING LAN, DAVIDE MALACRINO, ADIL MOHOMMAD, ANDREA PRESBITERO, GALEN SHER
Shocks, international trade, and diversification: Lessons from the pandemic
(synthesis; full article – Vox Eu CEPR 11 April 2022 – https://voxeu.org/article/shocks-international-trade-and-diversification)
Abstract: Trade in goods has rebounded quickly from the pandemic, while trade in services has not. This column finds that the pandemic broke the old trade patterns and that lockdowns had unintended international spillovers. Although global value chains have adapted, ongoing supply disruptions and the risk of future adverse shocks point to the need for more resilient value chains. The authors argue that in contrast to those calling for reshoring, a better way to build resilience is to diversify away from domestic sourcing of inputs and make it easier for producers to substitute between inputs supplied by different countries.
Keywords: COVID-19 international trade, global value chains, import, Export, international spillovers, resilience, diversification, Substitutability
The COVID-19 pandemic led to a collapse in international trade (Baldwin 2020), as safety concerns prevented individuals from going out and consuming imported products and workers from producing for export. In the second quarter of 2020, the volume of global trade in goods fell by 12.2% and trade in services fell even more sharply, by 21.4%, compared with the last quarter of 2019. Since then, trade in goods has recovered rapidly, returning to pre-pandemic levels by October 2021, but trade in services remains well below pre-pandemic levels. This divergence between goods and services has been well documented (e.g. IMF 2021), but less well known is that there are different patterns within goods and services. Within goods, it was the trade in goods that are typically produced in GVCs, like automobiles, electronics and apparel, that fell and rebounded quickest. Within services, trade in travel services remains depressed while trade in telecommunications services is stronger than before the pandemic.
The pandemic broke old patterns
Before the pandemic, trade in goods and services closely tracked developments in aggregate demand. Import demand models, which relate a country’s imports to its domestic demand and relative import prices, were good at explaining imports of goods and services before the pandemic. However, these patterns broke down during the pandemic. In 2020, goods trade fell by less than one would have expected from changes in aggregate demand and relative import prices alone. This unexpected deviation was larger in countries with more infections, more stringent containment measures, and lower mobility (Figure 1).
Figure 1 Factors associated with the demand model’s forecast errors in 2020
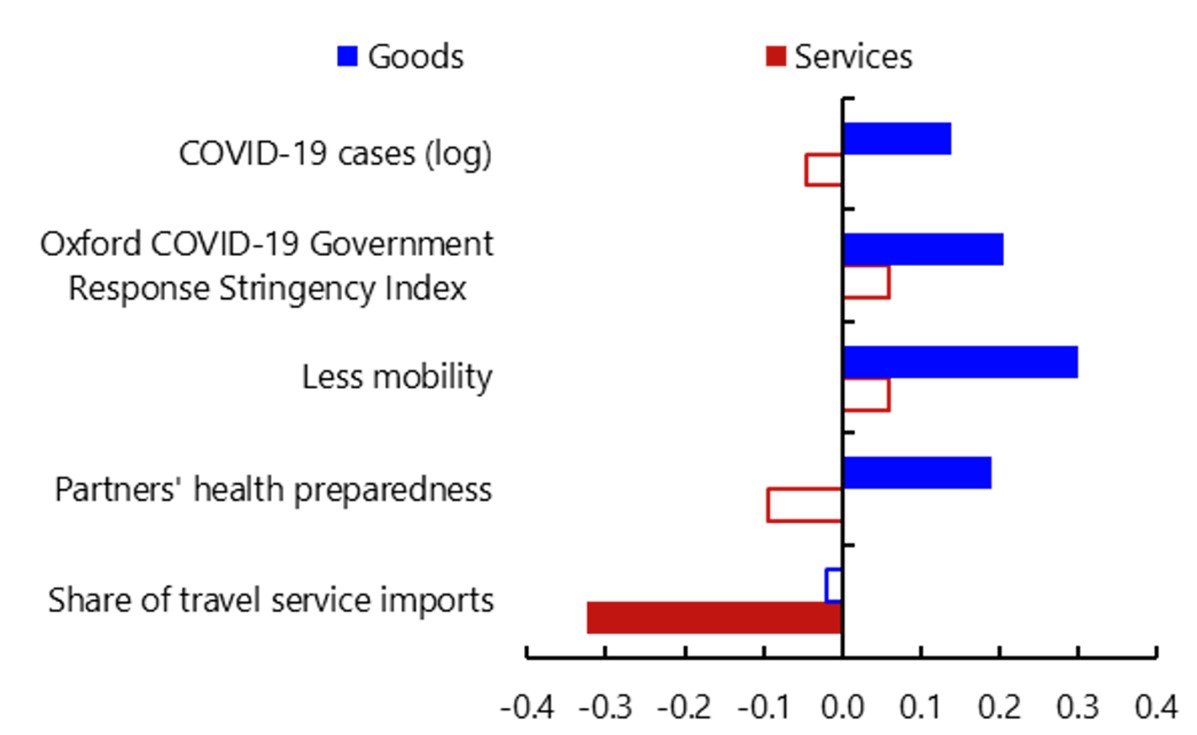
Sources: Global Health Security Index; Google, Community Mobility Reports; Hale and others (2021); Our World in Data; World Trade Organization; and IMF staff calculations.
Note: The figure reports standardized coefficients of regression of residuals from the demand model on the listed variables. Solid bars show coefficients that are statistically significant at the 5 % level; hollow bars show those that are not. Trading partners’ health preparedness for the pandemic is measured by the Global Health Security Index. “Share of travel service imports” captures the share of travel services in a country’s total service imports. See IMF (2022) for more details.
By contrast, services trade fell in 2020 by less than one would have expected from aggregate demand changes alone, and this gap is explained largely by the disruption to imports of travel services caused by the pandemic. These patterns could reflect a shift in spending from services to goods under pandemic waves, or they could reflect difficulties producing goods domestically under pandemic waves, in which case they are imported instead.
The Great Lockdown and unintended international spillovers
Another important reason for the collapse in trade in 2020 is the international spillovers from the containment policies put in place by trading partners (Bonadio et al. 2020, Espitia et al. 2021, Lafrogne-Joussier et al. 2022). Indeed, we find that as much as 60% of the drop in goods imports between January and May 2020 was the unintended consequence of lockdowns imposed by countries’ trade partners (Figure 2). This finding is based on a standard gravity model (Santos Silva and Tenreyro 2006) using detailed product-level data (‘HS-six-digit’) on bilateral goods trade that accounts for developments in importing countries and industries, including demand shifts and factors like trade agreements that could affect product-level trade between pairs of countries.
Figure 2 The international spillover effects of lockdowns

Sources: Hale and others (2021); IMF, Direction of Trade Statistics; and IMF staff calculations.
The spillovers from lockdowns depended on the country imposing them. Spillovers were less than half as large for countries whose exporting partners were more able to rely on remote working. Spillovers from lockdowns also varied over time. They strengthened between February and April as more countries outside Asia began to impose lockdowns and then started waning from May onward, suggesting that trade adapted to them.
The resilience of global value chains
Like goods trade, GVCs also adapted to waves of infections during the pandemic. After containing its initial wave of infections, Asia increased its market share of GVC-intensive products. Between 2019 and June 2020, Asia increased its market share in Europe by 4.6 percentage points and in North America by 2.3 percentage points (Figure 3). The gains appear temporary, since they were pared back to 3.1 percentage points and 0.6 percentage points a year later.
Figure 3 Shifting market shares
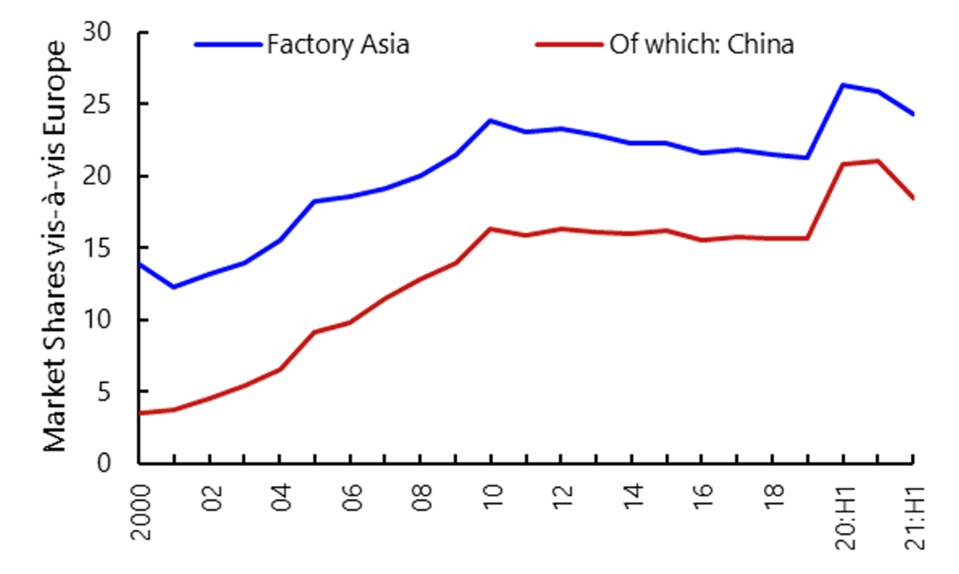
Sources: Trade Data Monitor; and IMF staff calculations.
Note: Market shares of Factory Asia vis-a-vis Factory Europe are computed using only GVC-intensive products, as defined in the IMF (2022). GVC = global value chain. See IMF (2022) for more details.
Nevertheless, the pandemic caused widespread supply disruptions (Celasun et al. 2022) by shifting demand from services to goods while preventing workers from producing and distributing them, leading to elevated shipping costs and congested ports. The war in Ukraine has intensified these disruptions by making energy, metals, and agricultural products scarcer. Pandemics, wars, climate change, and cyberattacks prompt GVCs to become more resilient.
Two techniques for resilience: Diversification and substitutability
Firms can diversify their supplier relationships to source more components from different countries, which would reduce reliance on any single country (including the home country) and provide established relationships that can be tapped during a crisis (Bas and Fernandes 2022). Indeed, our simulations using a global economic model (Bonadio et al. 2021) suggest that more internationally diversified sourcing would reduce the economic impact of a supply disruption in a large supplier country by almost half in the average receiving country (Figure 4). When multiple countries are hit repeatedly by supply shocks, higher diversification reduces the volatility of economic growth by about 5%.
Figure 4 Gains from diversification
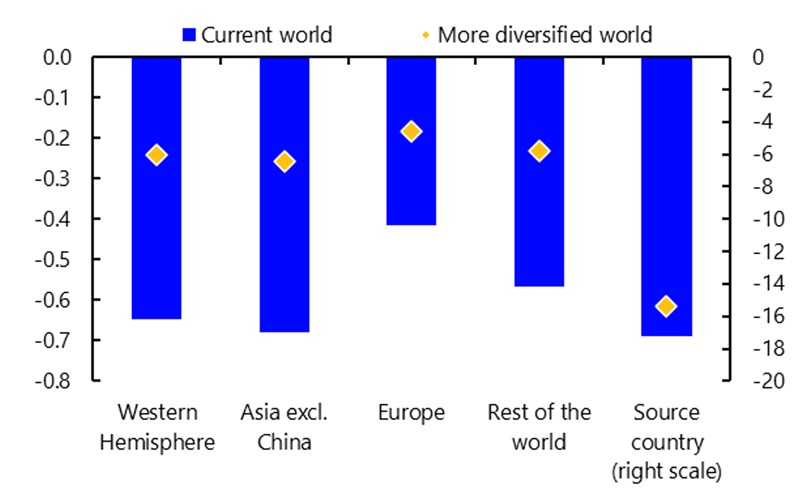
Source: IMF staff calculations.
Note: The figure shows GDP declines in response to a 25% labour supply contraction in a country that is a large global supplier of intermediates. The bars and squares show simple averages of GDP declines across countries within each region. Elasticity of substitution = 0.5. See IMF (2022) for more details.
The greatest room to diversify is to reduce the share sourced domestically. We find that firms worldwide tend to source the vast majority of their intermediate inputs in the home country (e.g. 82% in the Western Hemisphere). Reshoring would worsen this by leaving firms even more exposed to disruptions in their home country.
In addition to establishing relationships with more suppliers, firms could transform their production processes to make it easier to substitute the inputs provided by different suppliers. For example, in response to the semiconductor shortage, Tesla rewrote its software to enable it to use semiconductors that were less scarce. Our simulations with the global economic model suggest that greater substitutability can reduce the economic impact of a supply disruption in a large supplier country by around four-fifths in the average receiving country (but not in the source country).
Implications for economic policymakers
The pandemic has dramatically shaped trade developments, and through trade, it has spilled over between economies. Therefore, preserving exports and imports is one more argument in favour of ending the pandemic in all parts of the world through widespread vaccination.
Firms will ultimately decide where to produce and source inputs, but policy can also play a role given externalities and information asymmetries (Baldwin and Freeman 2022). For example, further simulations in our analysis suggest that reductions in trade costs, such as non-tariff barriers, can encourage international diversification. In addition, governments can provide information to help firms gain greater visibility into their supply chains and facilitate better risk analyses of supply chain networks.
Before the war in Ukraine, the global economy was threatened by calls for reshoring; the war has added further risk of global economic fragmentation. At the same time, it has made visible the risks of a large concentration of imports of key goods. By showing the benefits of international diversification and substitutability, our analysis underscores what can be gained by closer international integration and cooperation.
11 maggio 2022
Richard Baldwin, Rebecca Freeman
Global supply chain risk and resilience
(synthesis; full article – Vox Eu CEPR 06 April 2022 – https://voxeu.org/article/global-supply-chain-risk-and-resilience)
Abstract: Supply disruptions caused by systemic shocks such as Brexit, Covid, and Russia-Ukraine tensions have catapulted the issue of risk in global supply chains to the top of policy agendas. In some sectors, however, there is a wedge between private and social risk appetite, or increased risks due to lack of supply chain visibility. This column discusses the types of risks to and from supply chains, and how supply chains have recovered from past shocks. It then proposes a risk-reward framework for thinking about when policy interventions are necessary.
Keywords: COVID-19, Brexit, Russia, Ukraine war, global supply chains
The past couple of years have been rife with upheaval – whether we are speaking of people’s day-to-day lives, disruptions to business-as-usual, or international trade flows. The Brexit shock in Britain sparked initial concerns about the impact on global supply chains (GSCs). This was followed by the much larger and wider shock from the Covid-19 pandemic. The current political situation between Russia and Ukraine, including many countries’ sanctions and bans on the import of Russian products, is likely to perpetuate the spectre of broad and long-lasting shocks to multiple economies.
What should be done about this? Noting many challenges to GSC resilience, Seric et al. (2021) examine how firms involved in GSCs can help mitigate the effects of supply disruptions. Further, recent research on GSC risks has shown that inventory management helps firms mitigate GSC shocks (Lafrogne-Joussier et al. 2022).
This column, based on Baldwin and Freeman (2021), (1) examines how the literature has thought about sources of shocks, risk and resilience in the context of GSCs, including whether a shift in the thinking around risk is called for; and (2) offers a brief discussion on how to apply our proposed framework to policy discussions and future work on the topic.
Sources of shocks
GSCs are composed of firms and firms face risks. Some of these risks are exogenous supply and demand shocks, other shocks emanate from other firms or transportation disruptions.
- Supply shocks include ‘classic’ disruptions such as natural disasters, labour union strikes, suppliers going bankrupt, industrial accidents, and so on (Miroudot 2020), as well as disruptions from broader sources like trade and industrial policy changes, and political instability. They can be concentrated (e.g. the 2011 Japan earthquake) or broad (e.g. the Covid-19 pandemic).
- Transportation is part of the services sector, and thus potentially subject to different shocks than goods.
- Demand shocks confront firms with risks stemming from damage to product and company reputation, customer bankruptcy, entry of new competitors, policies restricting market access, macroeconomic crises, and exchange rate volatility.
Another important dimension of risk concerns the idiosyncratic-versus-systematic nature of shocks. Most firms involved in GSCs are aware of idiosyncratic shocks – those which affect single sectors or factories in single nations. These are frequent. Systemic shocks are a different matter.
From the 1990s until recently, shocks rarely involved many sectors/nations simultaneously. This is really what was new about the Covid-19 shocks to GSCs, which were pervasive, persistent, and affected multiple sectors at once. And while many firms do have contingency strategies in place, few firms engaged in GSCs – not even the most sophisticated multinationals – had prepared for systemic shocks. This is a real change.
The Business Continuity Institute Supply Chain Resilience Report 2021, which surveyed 173 firms in 62 countries, found that over a quarter of firms experienced ten or more disruptions in 2020, while the figure was under 5% in 2019. Firms cited Covid-19 for most of the rise in disruptions, although Europe-based firms also pointed to Brexit as an important source of shocks.
There are two other likely sources of systemic shocks: climate change and geostrategic tensions. In short, systemic shocks may become the norm and thus require changes to business models worldwide.
Even though the pandemic waxed and waned regionally, it has been global in nature. Because of this, the impact was felt in almost all goods producing sectors. We cannot know how frequently future pandemics or disruptive global events will occur, but it is likely that Covid-19 will continue to be disruptive for many months or years.
Economic analysis of GSC risks, resilience, and robustness
The literature has focused on three aspects of GSC risks:
- The propagation of micro into macro shocks
- Whether GSCs amplify the trade impact of macro shocks
- The costs and effects of delinking/decoupling from GSCs (e.g. through reshoring).
Our paper reviews these three literatures, but for the sake of space, we concentrate on policy issues here. Before doing so, we touch upon the critical distinction between resilience (ability to bounce back quickly after a shock) and robustness (ability to continue production during the shock). To ensure resilience, much of the focus is on designing the supply chain with an eye to the riskiness of locations overall. In contrast, robustness strategies focus more on ensuring redundancy of external suppliers or having multiple production sites for internally produced inputs (Martins de Sa et al. 2019, Brandon-Jones et al. 2014).
Do we need new GSC policies?
A touchstone principle of the social market economy is that government intervention is merited if there are gaps between the private and public evaluations of costs, benefits, and/or risks. When it comes to GSC policy, we argue that policy may improve market outcomes when there is a wedge between private and social evaluations of risk.
We illustrate this for GSCs with a ‘wedge diagram’ (Figure 1). The diagram, styled on classic optimal-portfolio analysis, has risk and reward on the y-axis and the x-axis, respectively. Firms like cost-savings and dislike risk (as shown by the indifference curves), but their choices are constrained by the fundamental risk-reward frontier shown. The frontiers take their shape since putting all production in the cheapest location increases risk by decreasing geo-diversification.
Where does the wedge come from? Public versus private risk appetite. In the GSC world, divergences in public-private risk preferences can arise from a range of mechanisms whereby individual firms do not internalise the full risk of their actions. Private firms optimally choose point P given their preferences. In some sectors, many governments have preferences that give greater weight to risk reduction, so the public trade-off leads to a lower-risk optimum, creating a wedge between public and private risk evaluations. This divergence is clear in sectors such as banking where, in the past, government provided guarantees when the risk went wrong, and in food production where individual producers underinvest in anti-famine actions.
Misperception of the location of the frontier. Another market failure can arise due to information asymmetries. Modern GSC are massively complex and even the most sophisticated firms can be unaware of the location of their third-tier suppliers and beyond (Lund et al. 2020). As a result, private firms may face more risk than they know. This situation is depicted as the actual risk-reward trade-off taking place above the perceived trade-off, which would also result in a wedge. When this is the case, private firms are at point P’ when they think they are at P.
Figure 1 The public-private wedge analysis of GSC risks
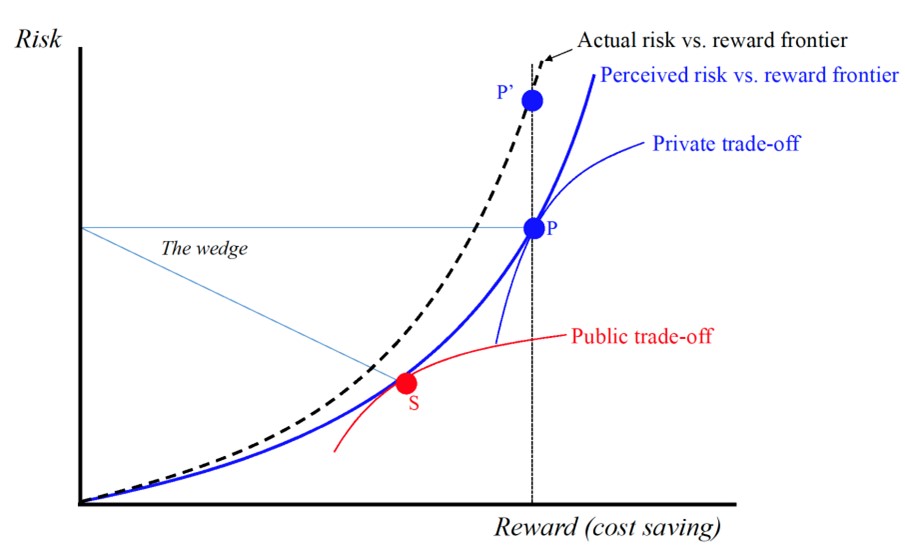
Source: Baldwin and Freeman (2021).
Policies to mitigate risk
Risk mitigating policies – such as those in banking and agriculture – are clearly warranted when such a public-private wedge exists. Banking is the classic sector with a wedge, but food has one as well given that it is almost universally considered too critical to national wellbeing to be left to the market. Most nations have policies that promote domestic production create buffer stocks to smooth demand and supply mismatches, or both. These typically involve large scale outlays such the US Farm Bill and the EU’s Common Agricultural Policy.
It seems likely that critical sectors, including medical supplies and semiconductors, will be viewed more like agriculture and banking going forward than they have been, since the perception is that they are marked by a public-private wedge. Policies that tackle the wedge can be usefully classified into tax/subsidy measures, regulatory measures, and direct governmental control. And, as firms are more likely to shift production structures when they perceive a permanent policy shift (Antràs 2020), we speculate that these sectors are most likely to restructure and reorganise their GSCs. On the policy side, there have been clear moves to evaluate critical sectors. For example, the Biden administration has established a Supply Chain Disruptions Task Force to address the challenges arising from a pandemic-affected economic recovery (White House 2022).
A target-rich research environment
We end our paper, and this column, with a call for research. On the trade theory side, almost no analyses had delved into the role of risk in GSCs when we started circulating our paper in 2021. For example, in the received wisdom literature (Grossman and Rossi-Hansberg 2008), the basic trade-off turns on separation costs versus cost-saving gains in a model without risk. As the discussion of the International Business literature in our paper makes clear, the risk-GSC nexus serves up a rich menu of un-modelled, yet important phenomena. Of course, risk considerations are not entirely new (Costinot et al. 2013), but the theory has largely assumed away risk for convenience, and this has been echoed in the empirics.
On the empirical side, the possibilities are even greater. Nothing helps econometricians more than truly exogenous shocks. The years 2020 and 2021 were bursting with exogeneity. Because of this, coupled with the availability of massive, high-frequency, online data, and headline-grabbing importance, we conjecture that there is a great deal of impactful empirical research to be done on risk and the shape and nature of GSCs. Overall, we see exciting times ahead for GSC researchers. Things have, as they say, changed so much that not even the future is what it used to be. It is riskier than we thought!
19 aprile 2022
CARLOS CARRILLO-TUDELA, CAMILA COMUNELLO, ALEX CLYMO, ANNETTE JÄCKLE, LUDO VISSCHERS, DAVID ZENTLER-MUNRO
Job search and mismatch during the covid-19 pandemic
(synthesis; full article – Vox Eu CEPR 07 April 2022 – https://voxeu.org/article/job-search-and-mismatch-during-covid-19-pandemic )
Abstract: The strength of the labour market recovery from Covid-19, and the extent of the economic scarring, depend on both job creation and whether job seekers look for jobs in the growing sectors of the economy. This column uses a novel dataset to provide direct evidence on the types of jobs sought by workers during the pandemic. It shows that workers increasingly targeted jobs in expanding occupations and industries. Nevertheless, a significant proportion of workers targeted jobs in declining occupations and industries. These workers tend to be the most disadvantaged: the non-employed and those with the lowest education qualifications.
Keywords: COVID-19 pandemic, labour market, jobless workers, policy measures.
The coexistence of a large number of available jobs and many jobless workers is often seized upon as evidence that the jobless are not willing to work. Another possibility is that there is a fundamental mismatch between the types of jobs that firms are advertising and the types of jobs that workers are looking for or have the qualifications to perform. These ideas have come to the fore amid stories of labour shortages following the Covid-19 pandemic, and seem to motivate policy measures such as the UK government imposing benefit sanctions on job searchers who fail to look for jobs outside their past sector or occupation. Analysis in Anayi et al. (2021) suggest unemployment from mismatch is a very real prospect for the US and UK in the wake of the pandemic. This may have consequences for not only labour markets but aggregate productivity too. Patterson et al. (2016) argue that labour market mismatch explained around two-thirds of the shortfall of UK productivity relative to trend after the 2007-08 Great Recession.
Previous attempts to measure so-called ‘mismatch’ unemployment have faced the challenge that data on the type of jobs sought by workers is often not readily available. Often researchers are forced to assume that job searchers look exclusively for jobs in their past sector or occupation (Sahin et al. 2014). In recent work (Carrillo-Tudela et al. 2022), we look at these questions more directly by exploiting a rich and novel data set: the job-search module of the UK Household Longitudinal Study (UKHLS). This module asked respondents who were looking for a job to list the occupation and industry that they were targeting. These data are rich in information that can guide our understanding of unemployment dynamics and inform the appropriate policy response.
Workers show flexibility in the type of job they search for
Our first key finding is that job seekers significantly adjusted their job search in favour of the industries and occupations that expanded during the pandemic. As of June 2020, about 58% of job seekers targeted occupations that were experiencing increases in their employment levels during the pandemic. This proportion increased to 70% by January 2021, as illustrated in Figure 1, which shows the percent of job seekers listing a given occupation as their first preference in their job search. The growing occupations were those which typically require higher skills, offer higher wages, and provide more opportunities to work from home. Across industries, about 41% of job seekers targeted expanding industries in June 2020 and this proportion increased to 50% in January 2021. So, even in the absence of benefit sanctions, workers endogenously change their search direction to target expanding occupations and industries.
Figure 1 Workers increasingly target expanding occupations
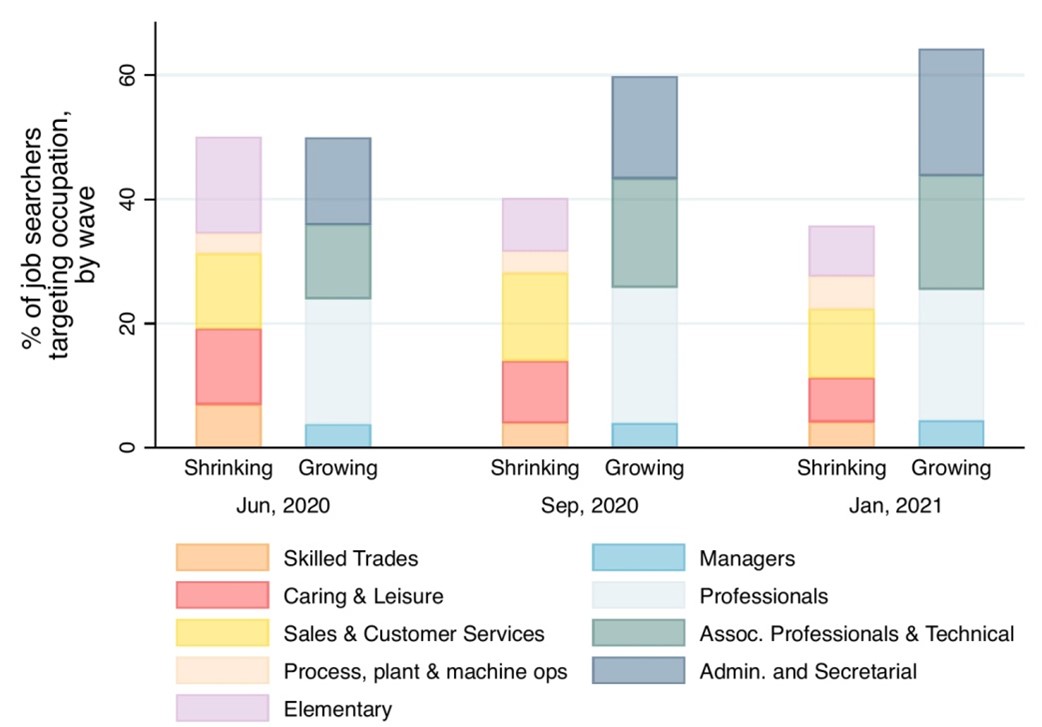
Disadvantaged workers more likely to target declining industries and occupations
However, we still see a significant proportion of job seekers targeting declining occupations and industries: the question is why? Our second key finding is that those at the margins of the labour market were most likely to target declining industries and occupations. For example, we find that non-employed workers were significantly more likely to target a declining industry and occupation in their job search. Those with the lowest education levels were also significantly more likely to target declining occupations. These results hold true even when conditioning on past occupation or industry, so they are not simply a reflection of attachment to previous jobs. However, attachment does play a role as workers from a declining industry (occupation) are more likely to target a declining industry (occupation), suggesting these workers may be trapped in ‘bad job’ cycles. The flip side of this is that employed or higher education workers are more likely to target expanding industries and occupations, as are those who have previously worked in these jobs, implying a more ‘virtuous’ job-cycle for these workers.
It takes two to tango: Workers’ willingness to switch not always matched by firms’ willingness to hire switching workers
Third, and finally, there is a substantial mismatch between the type of career transitions workers are looking for and the type of transitions they make. Among those targeting any occupation switch, the proportion of workers successfully transitioning into an expanding occupation was lower than the proportion of job seekers targeting a switch into an expanding occupation, particularly for those individuals coming from declining occupations (Figure 2). This suggests the presence of a glass ceiling that inhibits workers in declining occupations from realising their desire to switch into expanding occupations. This should perhaps not be a surprise given worker reallocation is an equilibrium outcome of worker and firm behaviour. Firms must be willing to hire workers from other sectors, as well as workers being willing to search for jobs outside of their sector, for a switch to occur.
Figure 2 Targeted versus realised occupation switches
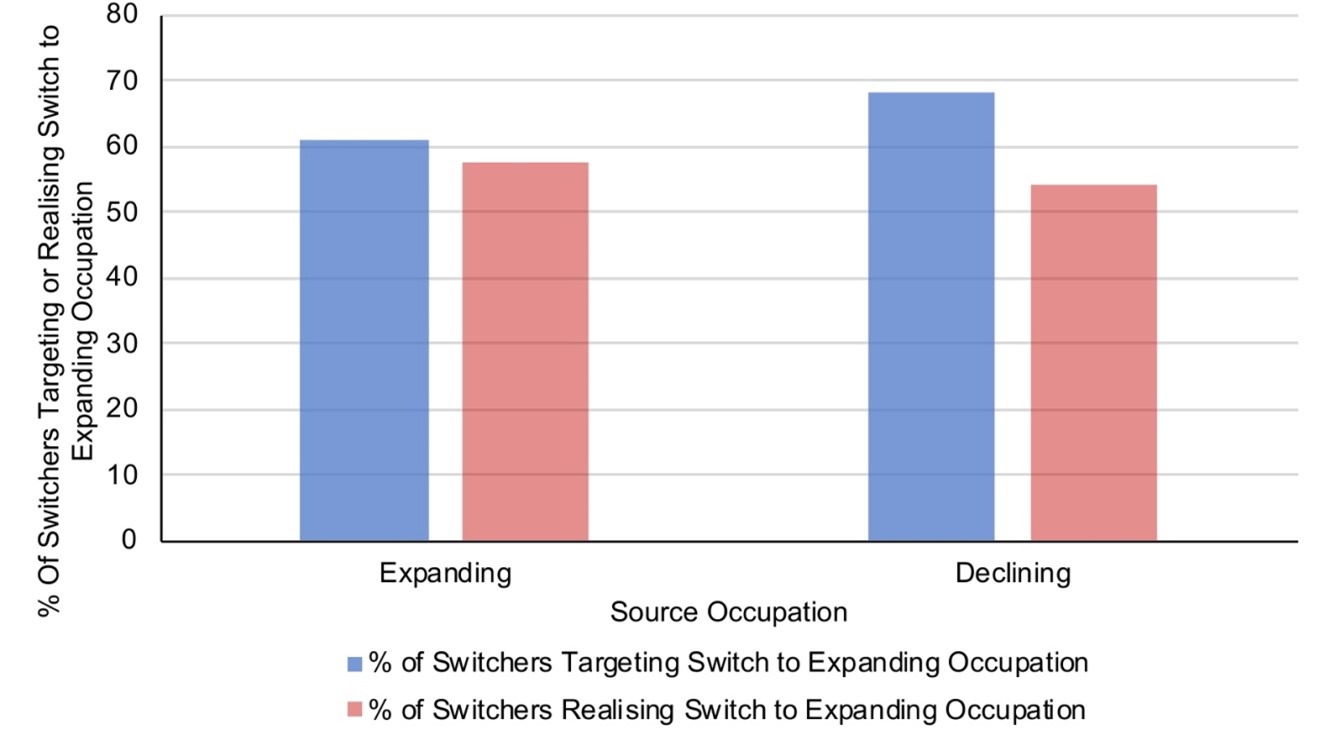
Implications: Helping workers and employers bridge the gap
The three key findings above are rich in implications for the related policy debate. First, we saw that workers, including the non-employed, endogenously change their search direction towards expanding parts of the economy without any impetus from the benefits regime. This calls into question measures to impose benefit sanctions on unemployed workers who do not search outside their previous occupation and sector.
Second, we saw that those workers that did target declining occupations were more likely to be non-employed or have low education qualifications. This points to the importance of retraining/education programs for the jobless, as well as the provision of job search assistance. During the pandemic, the UK government provided funding for adults to acquire an A-level equivalent qualification if they did not already possess one. However, it is not clear this is sufficient to bridge the gap between the skills demanded by employers and those possessed by job searchers.
The importance of retraining schemes is also suggested by our third finding showing the workers from declining occupations switch into expanding occupations less frequently than they desire. Occupation mobility may therefore be inhibited by firms’ willingness to hire workers who lack previous experience in a particular occupation or industry. This suggests policies that target firms as well as workers could have a role in encouraging reallocation. This could include the provision of wage subsidies for firms that retrain or hire unemployed workers in roles they don’t have previous experience in. Stantcheva (2022) highlights the positive record of such employer-focused active labour market policies in the US. Fujita et al. (2020) also highlight the potential role of wage subsidies of the young in promoting an optimal allocation of workers across sectors.
In short, our work shows that workers do tend to search for jobs in the growing parts of the economy. However, the most disadvantaged workers may require assistance to successfully obtain these jobs and employers can play an important role in this.
4 aprile 2022
CARLO CARRARO, BENOÎT CŒURÉ, OTILIA DHAND, BARRY EICHENGREEN, MELINDA MILLS, HÉLÈNE REY, ANDRÉ SAPIR, DANIELA SCHWARZER
A New Era for Europe
(synthesis; full article – Vox Eu CEPR 01 March 2022 (https://voxeu.org/content/new-era-europe)
Abstract: The European Union has responded decisively to the COVID crisis, putting in place major new policy instruments, most notably NextGenerationEU. Nevertheless, the medium- to long-term impact of the pandemic on the economy and society remains to be seen. To stimulate the public discussion on these issues, the EU Commissioner for the Economy, Paolo Gentiloni, invited us to reflect on the main economic, social, and environmental challenges the European economy will face in the post-COVID environment. In the report summarised in this article, we present our main findings. To secure the best outcome for the EU, we make recommendations in five areas: enabling the triple green, digital, and social transition; fair and effective taxation; moving towards a Health Union; strengthening Europe’s role in the world; and making the governance of the Union fit for purpose.
Keywords: COVID-19 crisis, European Union, EU Commissioner for the Economy, post-COVID environment.
The EU has been in a crisis-fighting mode for most of the past decade, withstanding the global financial crisis, the euro crisis, and the refugee crisis in the years leading up to the global pandemic. The COVID-19 pandemic devastated the European Union, yet it also spurred an unprecedented level of cooperation and, perhaps most importantly, a new way of acting together.
In responding to the current crisis, the EU notably departed from its track record of incremental, intergovernmental moves that made it difficult to act quickly or secure centralised fiscal support. The EU and its Member States rallied to meet the challenges of the global health threat with a jointly procured vaccine, and a new-generation economic recovery package financed by joint public borrowing. As a result, two years later the economy has begun to recover.
Now is the time to build on the EU’s short-run success by turning attention to the medium term. Public trust will be essential for the EU to succeed. The best way to earn this trust is by maintaining the momentum moving forward. The sense of urgency fostered by the pandemic must not be allowed to slip away. The EU needs to manage a triple transition in the areas of climate change, digital transformation, and social evolution.
The EU will have a chance to set a course along one of three main scenarios: ‘Business as Usual’, ‘Fragmentation and Conflict’, or a ‘New Era’. Under the first option, the EU does not adapt as needed to protect the environment or give its citizens the skills they need to survive in a digital world, and the EU falls further behind its international counterparts. In the second scenario, EU policies actively unravel the alliances and economic programmes that have taken so long to build, with corresponding threats to political and economic stability. But we also have a better option: pursuing policies that will lead to a New Era within the EU and around the world.
In our report (Carraro et al. 2022), we explore the financial, political, and environmental challenges ahead and put forth a series of recommendations to secure the best outcome for the EU in the future. We structure our recommendations in five areas: enabling the triple transition; fair and effective taxation; moving towards a Health Union; strengthening Europe’s role in the world; and making the governance of the EU fit for purpose.
Moving forward, it is important to recall that the EU’s problem is not underinvestment in general, and certainly not a lack of available savings to invest. Rather, the EU needs to commit to the triple transition and follow through on its reform and investment goals. Channelling public and private finance to the right projects will be key to carrying out the many transitional steps needed.
On the public side, the EU should build on the successful completion of the NextGenerationEU (NGEU) project and create a sufficiently strong joint capacity to invest in provisioning European and global public goods. Moreover, it should adjust its fiscal rules to allow for prudent budgeting practices that fully account for the long-term improvement in fiscal sustainability such investments bring about. On the private-sector side, the EU can spur investment by strengthening Banking Union, moving faster toward Capital Markets Union, and strengthening incentives to choose climate-friendly investments over legacy industries and technologies.
The Union would do well to preserve the public financing component of the NGEU programme, perhaps by separating public borrowing from the temporary funding transfers put in place to ease the acute economic challenge. We propose an NGEU 2.0 that would instead distribute money evenly across the Union for projects that met a jointly agreed definition of public interest. This would provide financing for worthy projects, ease the burden on national balance sheets, and also preserve the safe asset of euro-denominated debt that NGEU made possible. As a follow-on effect, making large-scale EU debt issuance permanent would strengthen the euro as a global currency by bolstering the common currency’s stature on worldwide financial markets. We further suggest the EU adopt a Sustainability and Growth Pact (SGP) 2.0 to improve upon the current Stability and Growth Pact. The SGP 2.0 is a prudential fiscal approach, which will ensure that fiscal planning takes into account large and predictable risks such as climate change. Investing to put the EU on a net-zero emission path is likely to pay for itself in the longer term as it will prevent part of the large costs linked to climate change which would otherwise affect public finances in the future.
The EU also needs to push for stronger public health measures at home and elsewhere, possibly using its influence to coordinate a global vaccine drive. The EU will need to be mindful of its global sway as well as its performance at home. If the EU’s climate protection efforts succeed, Europe will be well placed to offer worldwide leadership on the environment. If other countries sign on to New Era-style policies, these efforts will be more effective at limiting global warming as well as boosting the EU’s soft power. Furthermore, success on the world stage could reinforce political support for EU-level action within the Member States, combatting political polarisation.
Trust will be essential for the EU to carry out its mission. The Union has seen a rise in inequality and economic divergence in recent years. Even before the pandemic, some countries and regions were lagging more and more behind the Single Market’s top performers. With the added strain of lockdowns and other public health measures, adverse effects have piled up for vulnerable groups like young adults, retirees, and women overall, who often have caregiving responsibilities and who may be more likely to work in fields that are not conducive to remote work and expose them directly to the virus.
EU policymakers, therefore, need to take a proactive approach toward supporting all levels of society and geographic regions. Keeping these social considerations in mind will be essential for the EU to make progress on its other goals of protecting the planet and succeeding in an increasingly digital world. Tax policy is one avenue for making society more equitable while also raising the funds necessary for public financing to do its part.
Geopolitical and geo-economic concerns should be paramount in guiding the EU’s approach to international affairs. We urge the EU to be mindful of relations with major world powers like the US, Russia, and China, and we recommend that global and EU-level policies be coordinated to complement and reinforce each other better.
Finally, we recommend that the EU act now to strengthen its institutions. Local, national, and EU-level governments need to be more efficient, more transparent, and more accountable to their citizens. When some countries and regions have access to better public institutions than others, it makes it harder for economic growth to reach all corners of the EU equally.
The EU must do all it can to avoid an economic recovery where only some of its citizens benefit. Some segments of society are well positioned to make the most of digital opportunities and climate-friendly policies. These front-runners may find themselves on opposite ends of the political spectrum from communities that feel they have been left behind. Making EU institutions stronger and more accountable will counteract this trend and possibly act as a bulwark against populist movements.
Successful implementation of the triple transition is the only way to sustain sufficiently high growth that is environmentally and socially sustainable. Green transition is inevitable in the medium term. The later it starts and the longer it lasts, the higher the economic and social costs will be. However, without sufficient progress with digitalisation, and more broadly with promoting innovation, the macroeconomic costs of a more ambitious agenda for green transition could make such transition socially and thus ultimately politically untenable. The COVID crisis adds to this difficult trade-off because of the deep temporary decline it caused and the scars it may leave behind.
The EU now faces enormous challenges as well as a unique opportunity. We hope policymakers will make the most of the moment and set a course for a New Era of better days to come.
28 febbraio 2022
Daron Acemoğlu, Thorsten Beck, Maurice Obstfeld, Yung Chul Park 28 February 2022
Prospects of the global economy after Covid-19
(synthesis; full article – Vox Eu CEPR 28 February 2022 – https://voxeu.org/article/prospects-global-economy-after-covid-19 )
Abstract:
As the world is (hopefully) emerging from the Covid-19 pandemic, major challenges await societies across the world related to climate change, inequality, digitalisation, and the undermining of democracy. A new book from CEPR and the Korea Institute of Finance discusses the institutional changes needed to address these challenges and the necessary reforms to make the global financial system more resilient.
Keywords: COVID-19 pandemic, democracy, inequality, climate change, institutional changes, societal challenges, resource reallocation process.
As the world is (hopefully) emerging from the Covid-19 pandemic, major challenges await societies across the world related to climate change (Pisu et al. 2022), inequality (Angelov and Waldenström 2021), digitalisation (Benzell and Ye 2021), and the undermining of democracy (Freedom House 2021). Economists can contribute to this debate, based on historic insights, theoretical models, and analysis of data.
This column launches a new eBook containing three papers presented at the 30th Anniversary Conference of the Korea Institute of Finance (KIF), as well as the contributions of the discussants and a summary of the panel discussion (Beck and Park 2022). The papers discuss the necessary institutional changes to address societal challenges and the necessary reforms to better manage the global financial commons.
Big societal challenges
As pointed out by Daron Acemoglu at the start of his chapter, today’s world faces four fundamental and existential challenges: the rise in inequality, climate change, demographic change, and the weakening of democracy. These challenges not only require urgent actions, but have also been exacerbated by the pandemic. At the same time, these challenges provide opportunities to make institutions more inclusive, but they also require global cooperation, which has been waning in recent years due to the rising confrontation between the US and China.
Acemoglu argues that the rise in inequality was driven by globalisation but even more importantly, by new digital technologies such as specialised software and robotics that have automated work previously performed by low- and middle-skill workers. These trends have been exacerbated by an increasing focus on corporate profits and weakening of unions, the rise of global BigTech firms without the necessary oversight, and capital being taxed less than labour. These trends are intensifying with the rise of artificial intelligence technologies, which are not just continuing the automation trend but have also contributed to the retreat of democracy and steep falls in trust in public institutions.
The need for new institutions and global cooperation
To counter these trends, Acemoglu calls for the rebuilding of domestic and global institutions capable of harnessing the power of large corporations and significantly redirecting technological change. At the same time, better regulation of technology is required so that the composition of innovations is tilted away from technologies that pollute the environment and cause climate change, and equally tilted away from Silicon Valley’s excessive focus on automation and more towards human-friendly technologies that are capable of creating employment opportunities for a broad range of skills.
Climate change calls for global cooperation and more specifically for a global carbon tax – probably of no less than $150 per metric tonne of carbon, which is in the neighborhood of the level of carbon tax in Sweden today – complemented by aggressive and immediate subsidies to research in renewables and other green technologies, including storage and transport technologies and a smart grid for the allocation of renewable energy.
New risks in a financially integrated world
In his chapter, Maurice Obstfeld chronicles the evolution of the global financial markets since the Global Financial Crisis, focusing on changes in the markets’ domestic impacts, the strains that have emerged due to the Covid-19 crisis, and risks that may lie ahead. A key theme of his analysis is reforms that strengthen market resilience for enhancing financial stability.
One of the trends that has shaped the contour of the evolution has been the slowing but upward trend of international financial integration among advanced economies and emerging market and developing economies (EMDEs). The volume of global financial transactions seems disproportional to any fundamental economic need or activity, yet it produces a system prone to fragility.
Another trend is emerging evidence of a global financial cycle in which global asset and commodity prices, capital flows, and bank borrowings move in a synchronised pattern. While high-income economies seem to absorb the resulting shocks relatively easily due to deeper and more fluid financial markets, their wealth, the generally greater credibility of their policy frameworks, and elements of the global financial safety net (GFSN) from which they benefit disproportionately, for emerging markets the close linkage between the global financial cycle and growth raises the important policy issue of the extent to which a flexible exchange rate system can insulate EMDEs from shifts in global financial conditions.
EMDEs could be vulnerable to sudden stops in the near-term future in the next contractionary phase of the global financial cycle, for two main reasons. First, there has been an uneven rollout of effective vaccines across the globe, which might threaten recovery in many EMDEs. Second, EMDE fiscal responses to the crisis have made them even more vulnerable to hikes in advanced-economy interest rates – which may already be setting off a contractionary phase of the global financial cycle. The concentration of new sovereign debt issuance on domestic bank balance sheets in a number of EMDEs presents the possibility of a sovereign-bank doom loop.
Reforms for a more resilient global financial system
What policy reforms are necessary to make the global financial system more resilient? Obstfeld calls for expanding the regulatory perimeter to non-bank financial intermediation, where risks have shifted in the wake of tighter bank regulation; extending the scope of bilateral central bank swap lines as part of the GFSN; revisiting the use of capital flow measures as part of a larger toolbox to enhance stability in small open economies; and a new architecture for sovereign debt restructuring, which might be needed in the wake of rising sovereign debt burdens in many emerging markets.
Challenges for financial systems
In the third chapter, Thorsten Beck and Yung Chul Park discuss the shorter- and longer-term challenges for the financial sector, both related to the exit from the pandemic and consequent economic crisis and to the challenges posed by economic transformation, digitalization, and climate change. As societies emerge from the pandemic, sequencing of exit strategies from government support is important to avoid cliff effects and scarring, but also in terms of how quickly the economy can recover and manage the necessary resource reallocation process. Beyond the exit from direct support measures for corporate and financial sectors are the challenges of monetary policy normalisation and fiscal consolidation, with different countries and regions of the world facing different challenges and needs for policy normalisation.
Beyond the immediate challenges, the banking system has undergone structural changes over the past decades that have changed its role in middle- and high-income countries. While the share of credit to households rather than enterprises has increased, the corporate sector has seen an increasing role for intangible assets, which are harder for traditional banks to finance than tangible assets – a trend that can also explain increased cash holdings by corporates. Banks’ activity mix has expanded towards non-intermediation businesses, while tighter bank regulation has raised the importance of non-bank financial intermediaries. These trends have changed the way we think about the relationship between the financial system and economic growth, but also stress that we have to look beyond the traditional banking system towards other segments of the financial system, including private equity and debt providers.
Digitalisation might disrupt finance
Digitalisation has been an important disruptive force in banking. Traditional banks face increasing competition from new players, including FinTech start-ups and technology platform (BigTech) companies, with the regulatory response critical for the future structure of the financial system. These potentially decisive changes raise the question of whether the benefits from digitalisation and structural changes outweigh new risks and what the financial sector of the future will look like.
A final challenge that Beck and Park discuss climate change, which both poses problems for the financial system (climate, regulatory and transitional risks resulting in stranded and non-performing assets) and requires the critical function of the financial system for necessary resource reallocation. However, tentative evidence has shown that banks might have limited incentives to support such a transition (especially when compared to public capital markets), which puts the focus on the regulatory response to the climate change challenges but also raises the question of the relative roles of different segments of the financial system.
Conclusions
The debates around these topics reinforce the critical contribution that economists can and should make to the current challenges that humanity as such and advanced, emerging and developing economies face as they exit from the pandemic. This exit poses many challenges for policymakers across the globe but also the opportunity to address fundamental risks for humanity and move towards a safer and more sustainable world.
28 febbraio 2022
VU MINH NGO, KLAUS F. ZIMMERMANN, PHUC V. NGUYEN, TOAN L.D. HUYNH, HUAN HUU NGUYEN
Understanding the setup and speed of global covid-19 vaccination campaigns
(synthesis; full article – Vox Eu CEPR 25 January 2022 https://voxeu.org/article/understanding-setup-and-speed-global-covid-19-vaccination-campaigns)
Abstract: Because vaccinations are crucial to containing the COVID-19 pandemic, it is important to identify the key factors behind successful immunisation campaigns. This column shows that pandemic pressures, economic strength, educational advancement, and political regimes can affect vaccination uptake, given vaccine availability. While democratic regimes initially show faster vaccination uptake, this advantage fades out as countries try to get more people vaccinated. Countries with strong economies and education systems are likely to have faster uptake of vaccination campaigns
Keywords: COVID-19 vaccine, COVID-19 immunisation campaigns, vaccine hesitancy educational background, global challenge..
Democratic countries such as Germany, Israel, the UK, and the US were among the few first to start COVID-19 vaccination campaigns. However, after some initial success, these campaigns soon faced a persistent vaccine hesitance among large parts of the population (Dewatripont 2021). As of November 2021, 46 nations, including Brazil, China, and other emerging countries, have surpassed the US in vaccination uptake rates (Holder 2021). On 13 January 2022, only about 62% of the US population had been fully vaccinated, as well as 71% in Germany, 70% in the UK, and 64% in Israel (Our World in Data 2022, Mathieu et al. 2021).
Recently, mandates for the COVID-19 vaccine have been implemented in Germany and the US to forcefully deal with vaccine hesitancy (Reuters 2021). Many European countries are currently preparing or starting compulsory vaccination at various levels (Burki 2022). Given the many advantages that these countries possess, the current situation raises a lot of questions, including: What explains vaccine resistance? What are common factors of success across countries?
Previous research has mainly focused on behavioural sciences to boost vaccine uptake rates (Schubert 2016). Research from Japan shows that information about vaccinations may inspire others: older persons got vaccinated if they were getting it for free, but younger adults did not seem to be affected by ‘nudges’ (Sasaki et al. 2021). In the US, Chang et al. (2021) found that neither financial incentives nor public health messaging or a simple vaccination appointment planner could raise the uptake rates in the vaccine-hesitant population. Improving take-up will need stronger regulatory levers, ranging from workplace norms to government mandates. In contrast, Campos-Mercade et al. (2021) found that even a mediocre monetary incentive of €20 significantly enhanced vaccination rates.
Given the inconsistent findings in behavioural studies, we use data from 118 countries to provide global evidence on the fundamental factors that improved or hindered vaccination uptake and speed (Ngo et al. 2021).
Data and methodology
While it is much too early to judge the entire vaccination process, which is still ongoing, the rollout after the various vaccines became available and the initial speed can be examined. In our paper (Ngo et al. 2021), we therefore assess the performance of initial COVID-19 immunisation campaigns until October 2021 by counting the days it took each country to reach specified vaccinated population shares (1%, 5%, 10%, 20%, and 30%), as the total number of doses over the total population.
Political, educational, and economic background variables are considered key predetermined driving forces. We employ a democracy index (‘political regimes’) suggested by the 2020 Economist democracy report (Economist Intelligence Unit 2020), which classifies countries into full democracy, flawed democracy, hybrid, and authoritarian regimes based on their democratic score (1 to 10). The expected years of schooling index (UNDP 2020) captures the state of the educational system (‘education’). Further, GDP per capita measures economic strength. We include control variables like continent dummies, population density, population shares of people 65 and older, and vaccine purchases. Average COVID-19 new cases (from January 2020 to 11 October 2021) were used to capture societal pressures. The estimation method was weighted least squares using population size as weights with robust standard errors. We also calculated Owen-Shapley R2-decompositions to judge the contributions of the key variables to the explained variance and hence reveal their relevance.
Our study shows that it took nations around 36 days to attain a 1% vaccination level. The average number of days it took to cross 5%, 10%, 20%, and 30% was about 73, 93, 116, and 134 days, respectively. Higher vaccination rates were achieved faster thereafter.
The sample’s average GDP per capita is US $22,700. However, for the economically diverse 118 nations, economic strength varies greatly, between US $920 and US $116,900. Similarly, education (expressed in projected school years) shows a wide range of 6.4 to 21.9 years, with an average of 14.1 years.
Decomposing the COVID-19 vaccination campaigns
Figure 1 depicts the relationships among education, GDP per capita, infected new cases, political regimes, and the number of days needed to achieve 5% and 30% uptake rates. The colour (light blue to dark blue) represents average new cases, the size of the dot reflects GDP per capita, and the markers reveal the political regimes of the countries.
Figure 1 Education, GDP per capita, new cases, political regimes and number of days needed to achieve vaccination uptake rates.
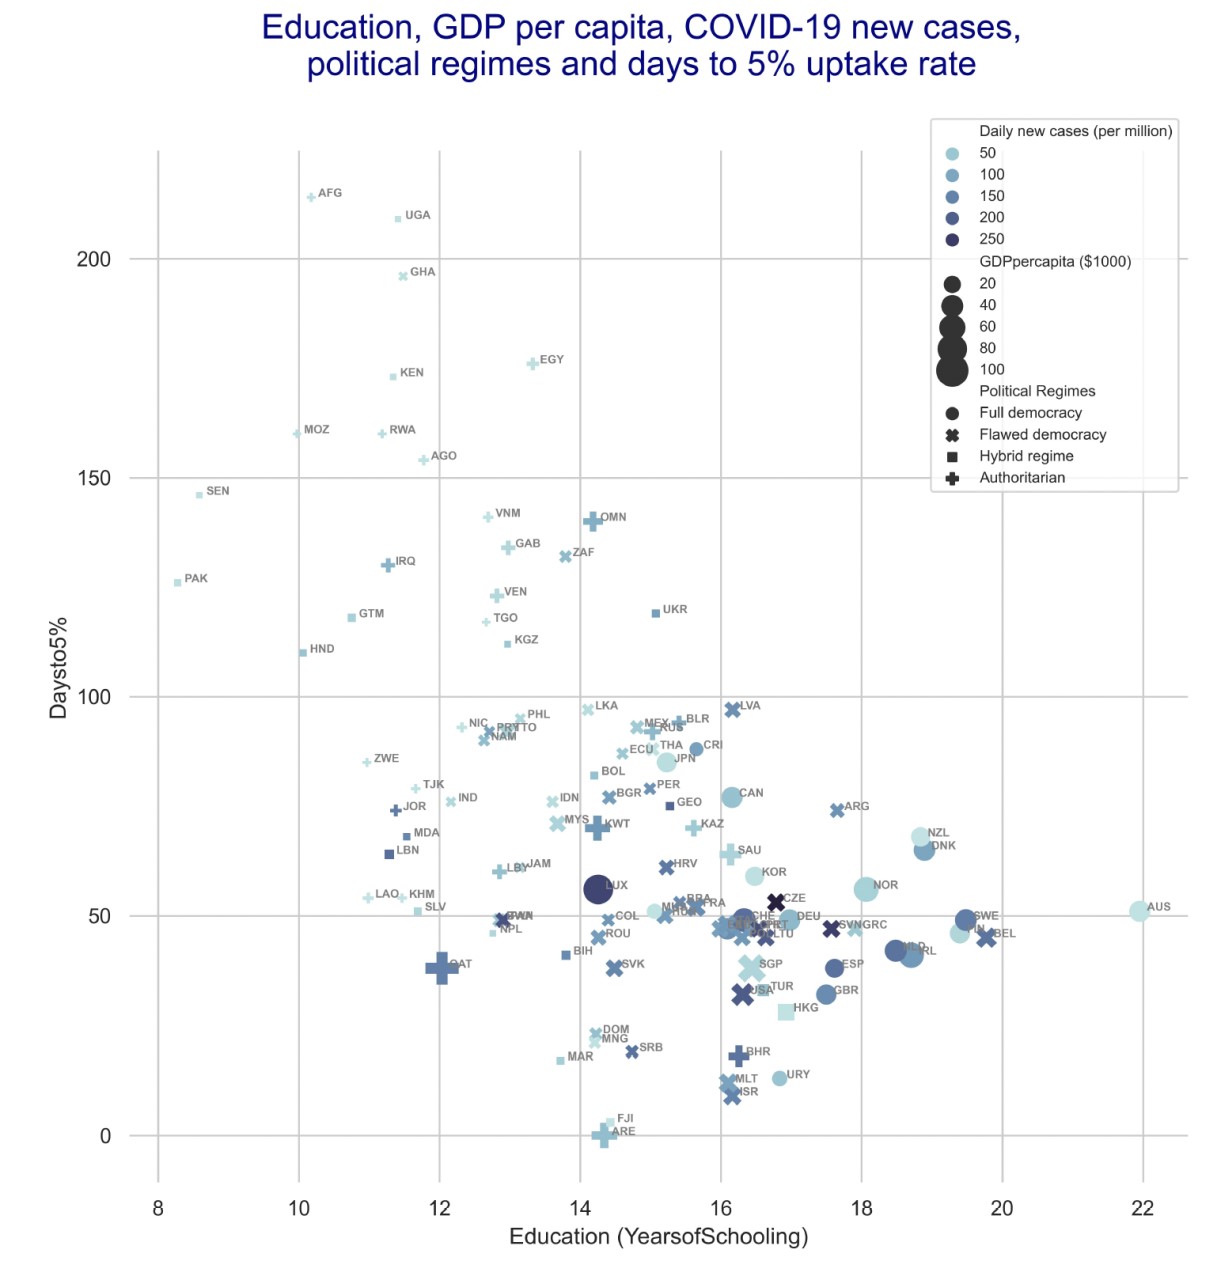
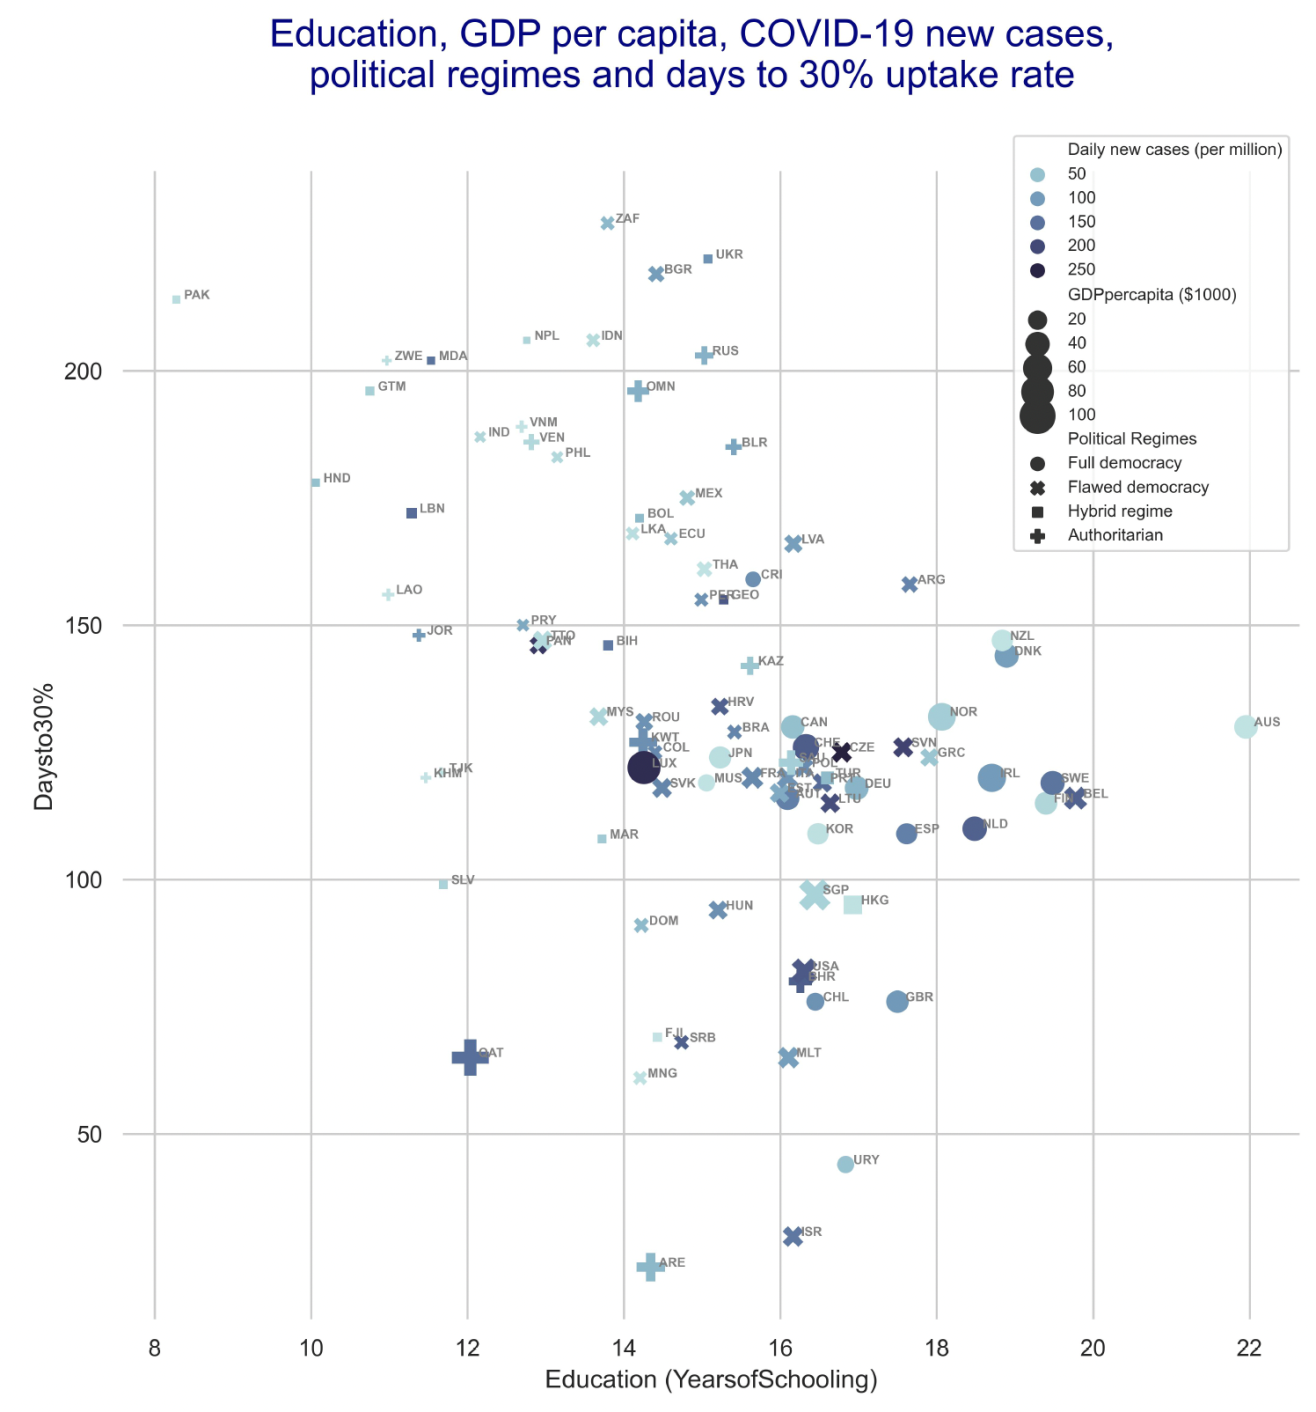
Notes: The colour (light blue to dark blue) represents average new cases, the size of the dot reflects GDP per capita, and the markers reveal the political regimes of the countries.
These two diagrams show the complex vaccination rollout structure, which is more clearly confirmed by our econometric investigation. For both 5% and 30%, the downward sloping cloud of points suggests that education is a strong and persistent factor associated with fast vaccination success. The size of the dots is larger in the lower parts of both diagrams indicating that higher GDP per capita is also associated with faster vaccinations. Not surprisingly, the colour of those countries clustering in the upper parts of both diagrams is light; in general, low levels of infections (new cases) reduce the pressure on vaccination rollout speed.
The 5% panel (Figure 1, top) contains two clusters of countries separated by a line at 100 days. The cluster in the upper left (above 100 days) contains countries with low education, low GDP per capita, few new cases but dominant autocratic or hybrid political regimes. The cluster below 100 days (countries reaching the 5% goal faster) and to the right shows higher education, higher GDP per capita, more new cases but a mixed collection of political regimes, with both more democratic and more authoritarian settings. The importance of political regimes fades out for the 30% uptake rate (Figure 1, bottom panel).
The main results of our regression analysis exploring the role of a larger number of determinants based on Ngo et al. (2021) are visualised in Figures 2 and 3. The symbols represent the parameter estimates and the dashed lines the 95% confidence interval revealing statistical significance. The more negative the parameters are, the faster the vaccination goal is reached; the broader the dashed line is, the lower is the statistical significance. Figure 2 shows that the number of days it took to achieve the different vaccination uptake rates is negatively associated with democratic features, using authoritarian countries as the reference. More democratic countries had faster vaccination campaigns. While the estimated parameters for the three categories of democracy (full, flawed and hybrid) are negative, their significance and magnitudes vary at different uptake rates. They are significant at the 1%, 5%, and 10% levels. The type of democracy accounts for 14.2% of the overall explained variance in the days it took to reach the 1% vaccination level. This finding was quite stable throughout the campaigns, and 14.8% of the measured total explained variance of vaccinations (73%) to reach or pass the 30% threshold is associated with political regime variables.
Figure 2 Impacts of political regimes (authoritarian as reference group) on speed of vaccination campaign, in days
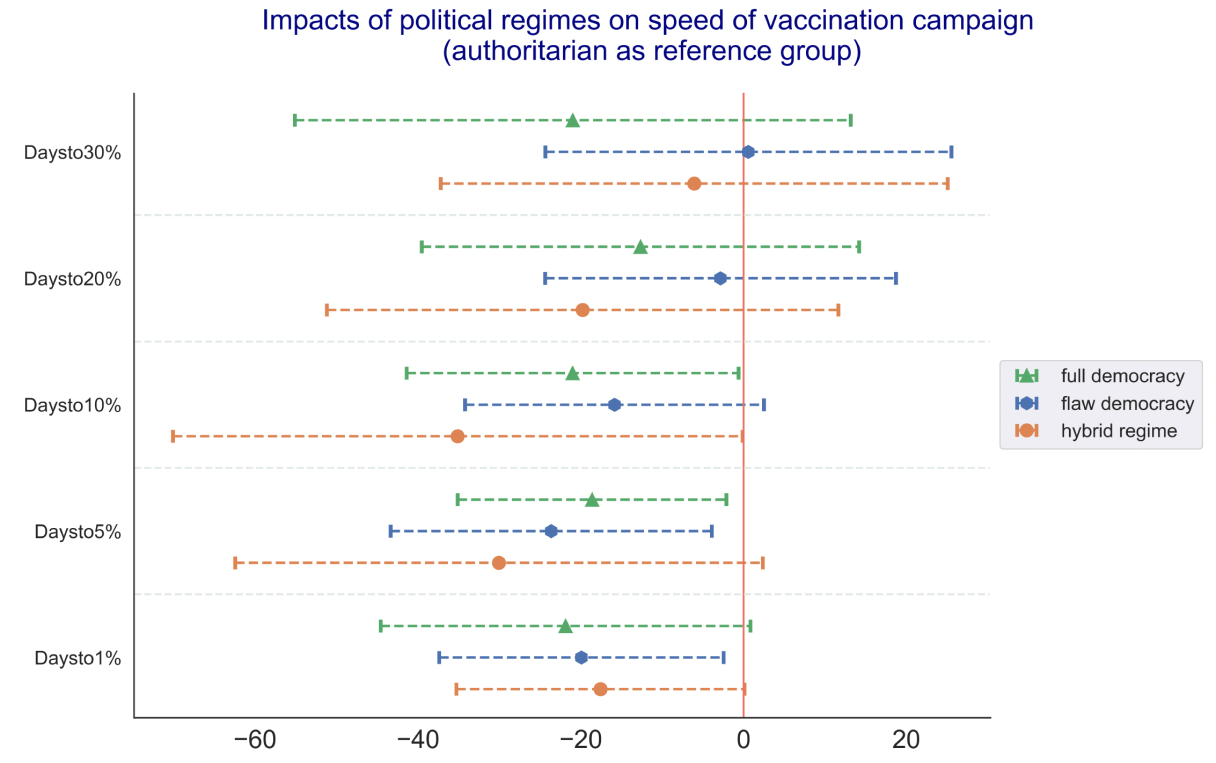
Note: 95% confidence intervals given.
Figure 3 illustrates the strength of education, GDP per capita, and new cases with the various vaccination levels. Educated nations showed a negative and statistically significant influence on the time required to reach certain levels of vaccination. Education accounts for 24.1% of the explained variance in the number of days it took to reach the1% vaccination level; it accounts for somewhat less but still significant amounts of variance in the subsequent vaccination stages (19.1%, 15.1%, 18.7%, and 17.8%). Education is always more important than political regimes for expediting vaccination uptake.
The impact of GDP per capita became larger (and hence vaccination faster) and very significant for higher vaccination thresholds. The Owen-Shapley decomposition assigns the largest contributions of 17.7% on days to reach 10% vaccination levels, 34.5% to reach 20% vaccination, and 34.7% to reach 30% vaccination. GDP per capita also contributes the most to vaccination speed among all variables, including political regimes.
Figure 3 Impacts of education, economic strength, infection intensity on speed of vaccination campaign (days)
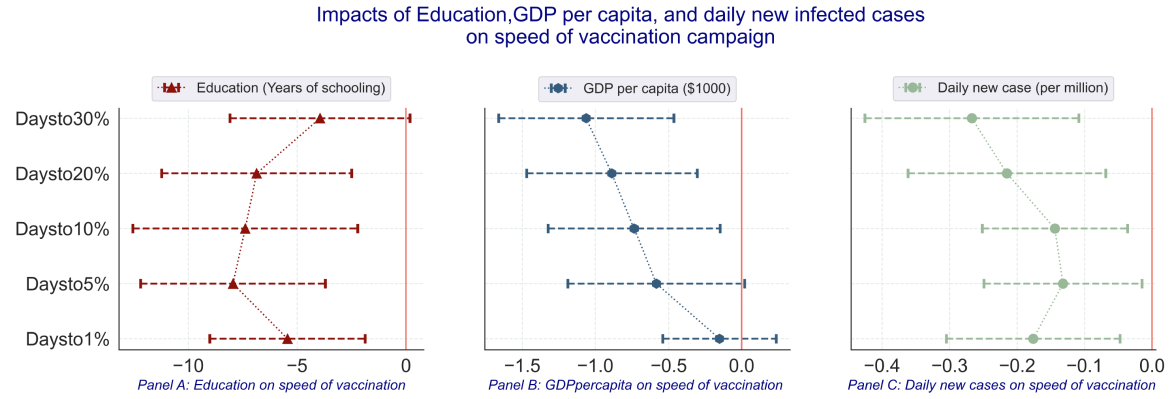
Note: 95% confidence intervals given.
The strength of the epidemic, measured by new cases, encouraged governments to ramp up their immunisation efforts. According to the Owen-Shapley contributions, this pressure is greatest in reaching 1% and 5% vaccination rates, accounting for 19.2% and 14.8% of the total explained variance. Differences in vaccine policies mattered initially, but not afterwards. In contrast to North and Middle America, European and Asian nations reached the 5% and 10% vaccination levels more rapidly, but their pace slowed considerably after reaching 30% vaccination levels and beyond.
Discussion
There are large regional differences in how the pandemic presents itself and how populations and political authorities respond to it. Vaccinations are thought to be the silver bullet to contain COVID-19. While this simple view daily loses ground due to the immense adaptability of the virus, it is important to understand the basic mechanisms of fast vaccination uptake. Education and economic strength are shown to be global factors for success; the type of political regime is not as relevant. This sends an important message for policymaking: since the challenge is global, the rich and educated countries of the world need to support those that are still behind. It is also in their own interest.
21 febbraio 2022
Pawel Adrjan, Gabriele Ciminelli, Chiara Criscuolo, Peter Gal, Alexandre Judes, Giuseppe Nicoletti, Michael Koelle, Timo Leidecker, Francesco Losma, Cyrille Schwellnus, Tara Sinclair
Teleworking is here to stay and may raise productivity if implemented appropriately
10 February 2022
(synthesis; full article – Vox Eu CEPR 10 February 2022 (https://voxeu.org/article/teleworking-here-stay-and-may-raise-productivity-if-implemented-appropriately)
Abstract: The COVID-19 pandemic triggered a surge in teleworking, raising questions about its persistence as well as its impact on firm performance and worker wellbeing. Leveraging real-time online job postings data from Indeed and a recent OECD survey of managers and workers, this column argues that teleworking is here to stay – for most workers in a hybrid mode with two or three working days per week at home. A majority of managers and workers value teleworking positively but emphasise the need for adaptive measures, such as the coordination of schedules and investment in ICT hardware, software, and skills.
Keywords: COVID-19 curve, mobility restrictions, telework, surge in teleworking, online job.
COVID-19 triggered a surge in teleworking, with about 40–50% of the workforce in advanced economies working from home at the height of the pandemic (Taneja et al. 2021, Barrero et al. 2021a, Davis et al. 2021). In two recent and complementary studies, we source new data to answer three questions related to the surge in telework. First, will teleworking persist when pandemic-related mobility restrictions recede? Second, what is the impact on productivity and wellbeing as perceived by managers and workers? Third, how can policymakers and managers maximise the benefits and minimise the risks from more widespread teleworking?
In the first paper (Adrjan et al. 2021), we analyse developments in online job postings that advertise telework on the global job site Indeed in 20 countries over the past two years. In the second paper (Criscuolo et al. 2021), we report the results from an OECD survey on teleworking of both workers and managers that we implemented in 25 countries.
Job postings advertising teleworking measure its medium-term adoption
Indeed retrieves job postings from a variety of sources, including direct postings on its proprietary platform as well as thousands of online job boards, career sites, and recruiter listings. In the 20 countries covered by our study, Indeed job postings represent the near-universe of online job offers. Using state-of-the-art text analysis algorithms, we identify postings that mention the possibility of teleworking in the title, description or location and construct a variable measuring the share of job postings advertising telework.
Job postings that advertise teleworking differ substantially from measures of realised teleworking because they relate to the firms’ future hires rather than their existing workforces. Hence, measuring teleworking through online job postings gives us the best available measure of its medium-term adoption, beyond ad-hoc arrangements adopted during COVID-19-related lockdowns. Another advantage is that data on job postings are available in near real-time, currently up to the end of 2021.
The share of job postings advertising teleworking more than tripled during the pandemic
Taking a first look at the data, we find that the average share of remote postings across the countries in the study more than tripled over the pandemic, from just 2.5% of job postings in January 2020 to 8.5% in December 2021 (Figure 1). The increase was initially associated with the introduction of pandemic-related mobility restrictions: across countries, restrictions to mobility during the pandemic were positively correlated with changes to remote postings. In countries with high restrictions, such as Ireland, Italy, Spain and the UK, the share of remote working increased significantly more than in countries with low restrictions, such as Japan and New Zealand. However, despite the easing of restrictions during the first half of 2021, the average share of remote postings has remained near the peak it first reached in April 2021.
Figure 1 Share of job postings advertising telework and government restrictions index
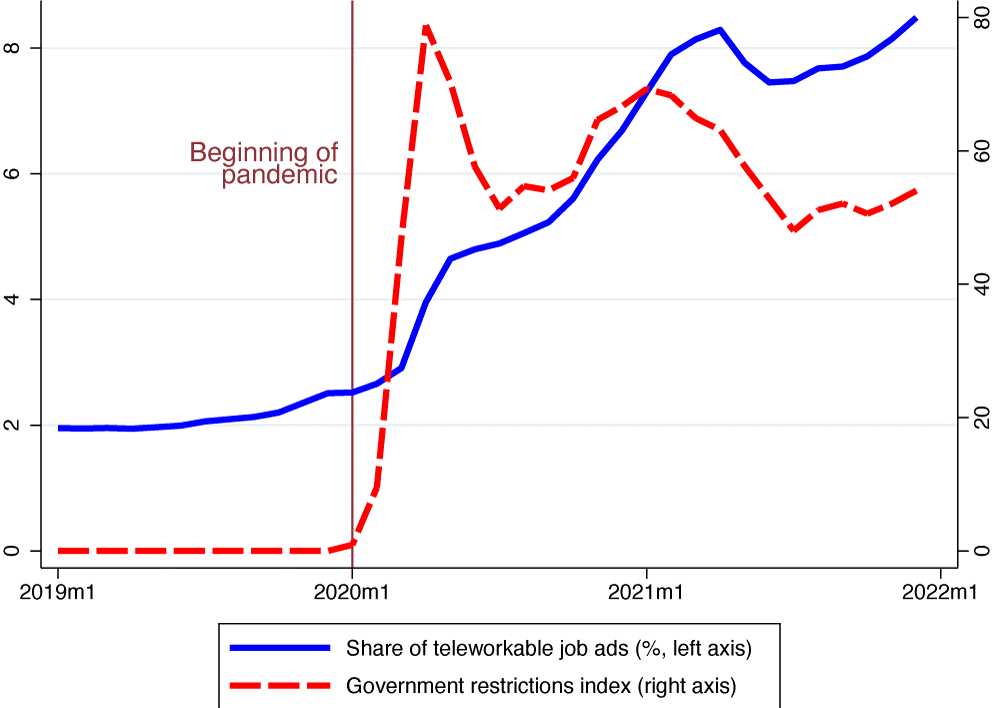
Note: The figure plots the average values of the share of teleworkable job postings on Indeed (left axis) and of the government restrictions index based on the Oxford COVID-19 Government Response Tracker across countries (right axis).
Advertised teleworking increased most in knowledge-intensive occupations
As one might expect, the effects of pandemic-related mobility restrictions are largely driven by knowledge-intensive occupations where teleworking is more feasible. These include occupations such as software development and marketing, where advertised teleworking increased by 12–13 percentage points. By contrast, in occupations such as food preparation or driving, which typically require physical presence at the workplace, the share of advertised telework in online job ads increased very little, confirming evidence from other sources (OECD 2021).
Will teleworking revert back to its pre-pandemic level once the pandemic is under control? To answer this question, we separately analyse the effects of a tightening and an easing of pandemic severity on the share of job postings advertising teleworking. For the estimation, we exploit the two stylised facts we just established – that teleworking increased more in countries with more severe restrictions and in occupations where it is more feasible – to develop an econometric triple-differences strategy. Specifically, we compare the evolution of advertised telework (i) over time, (ii) across countries, and (iii) across occupations with a higher or lower potential for teleworking, which we measure using the classification of jobs into teleworkable and non-teleworkable from Dingel and Neiman (2020).
Pandemic severity was a catalyst for remote work.
We first look at the effect of a tightening of mobility restrictions. We find that, on average, a one standard deviation increase in the stringency index of the Oxford COVID-19 Government Response Tracker (corresponding to about 10 points on a scale of 100) raises advertised teleworking by about 0.6 percentage points in high-potential occupations relative to low-potential ones over a six-month window (Panel A of Figure 2). Since the average increase in teleworking in low-potential occupations is negligible, this estimate roughly corresponds to the absolute effect of a tightening of pandemic severity on teleworking in the occupations where it is feasible. We estimate even larger effects when we measure the severity of the pandemic using COVID-19 fatalities or reductions in the Google Mobility Index.
Figure 2 Effect of tightening and easing of pandemic restrictions on advertised telework at different time horizons
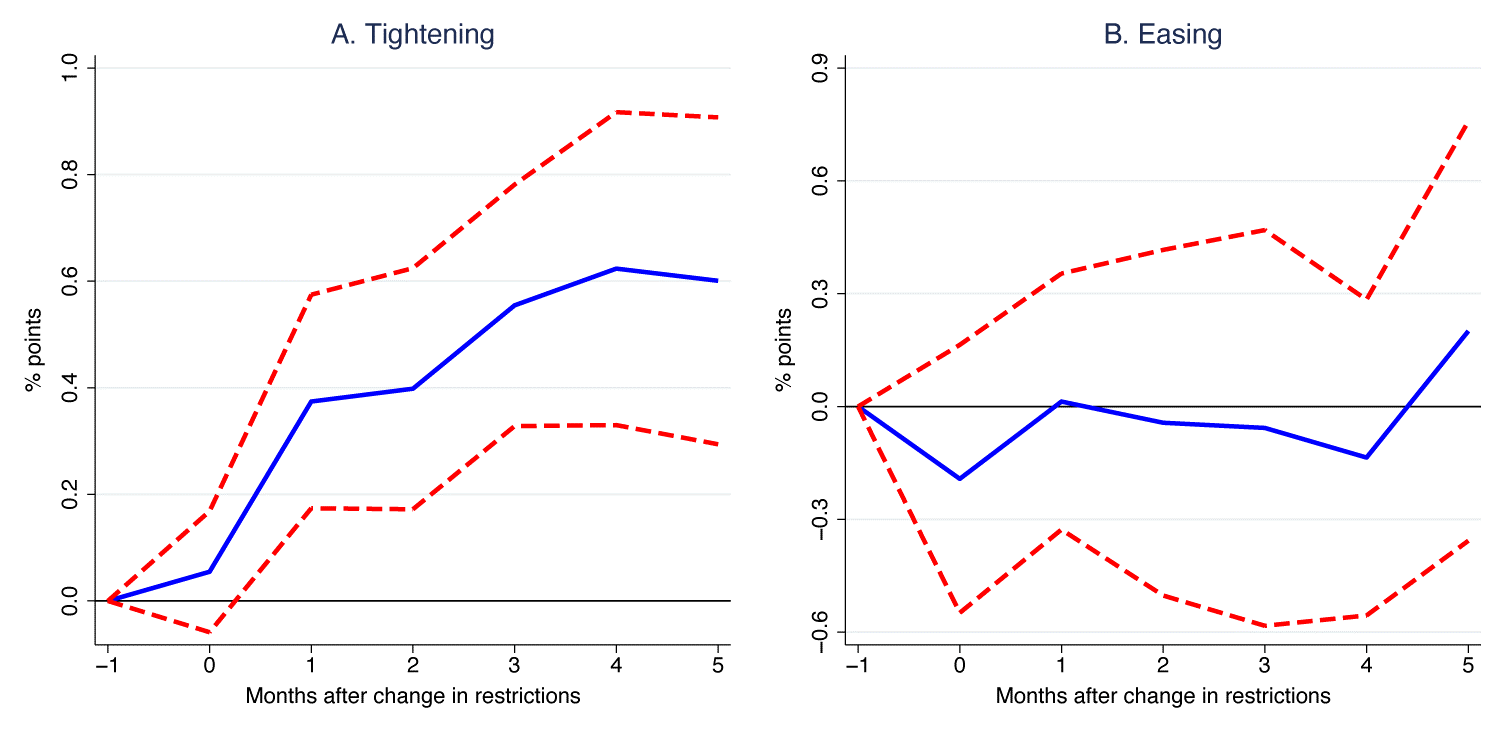
Note: The figure shows the cumulative differential effect (impulse response functions) of a change in government restrictions at time zero on the share of job postings on Indeed advertising telework between occupations with a high and low telework potential over a 6-month window. Contemporaneous, immediate effects correspond to time zero on the x-axis. Effects are estimated and reported separately for a tightening and easing of restrictions, in a unified model. For full details of the econometric methodology, see Adrjan et al (2021).
… but the easing of the pandemic has so far not reduced advertised teleworking
Next, we turn to the effect of an easing of pandemic severity. Regardless of the measure that we use to measure pandemic severity, our analysis suggests that an easing does not have any effect on advertised teleworking. In other words, the pandemic appears to be durably driving up advertised teleworking. In complementary analysis, we find that this is particularly true in countries with good digital infrastructure as measured by broadband internet penetration. This path dependence could reflect large investments into digital tools and infrastructure as well as the acquisition of teleworking skills on the part of both employers and employees.
In sum, the analysis from our first paper (Adrjan et al. 2021) suggests that teleworking is here to stay, especially in knowledge-intensive occupations and in countries with good digital infrastructure. This is consistent with results from our complementary survey-based paper (Criscuolo et al. 2021), which further shows that, across countries, managers and workers agree on 2–3 working days per week as the ideal intensity of telework – similarly to previous findings by Bloom et al. (2021) for the UK. We now turn to perceptions of teleworking and expectations among managers and workers in more detail.
How does teleworking impact productivity and wellbeing? Perceptions of managers and workers.
The impact of teleworking on firms’ productivity and workers’ wellbeing is a priori ambiguous. In a previous policy note (OECD 2020), we postulated that this relationship might be hump-shaped: low levels of telework adoption – and the consequent lack of flexibility – might reduce workers’ satisfaction, hamper their efficiency, and hence reduce the company’s performance. However, high levels of telework adoption might also be counterproductive: some workers start feeling isolated, and communication and knowledge flows within the company could become more difficult.
To shed light on the subjective opinion of managers and workers towards teleworking in a systematic manner, we undertook an online survey among a network of employer and employee associations in the first half of 2021, which resulted in more than 5,000 responses from 25 countries.
Figure 3 shows the three most important perceived advantages (Panel A) and disadvantages (Panel B) of teleworking emerging from the survey for both managers and workers. Around 60% of managers think that workers work more and more productively in a teleworking environment – a result well aligned with findings from Barrero et al. (2021b) and Taneja et al. (2021). A similarly high share of managers also values the possibility of hiring workers living far away from the office premises.
Figure 3 Advantages and disadvantages for managers and workers
Panel A) Advantages for firm performance (managers) and individual well-being (workers)
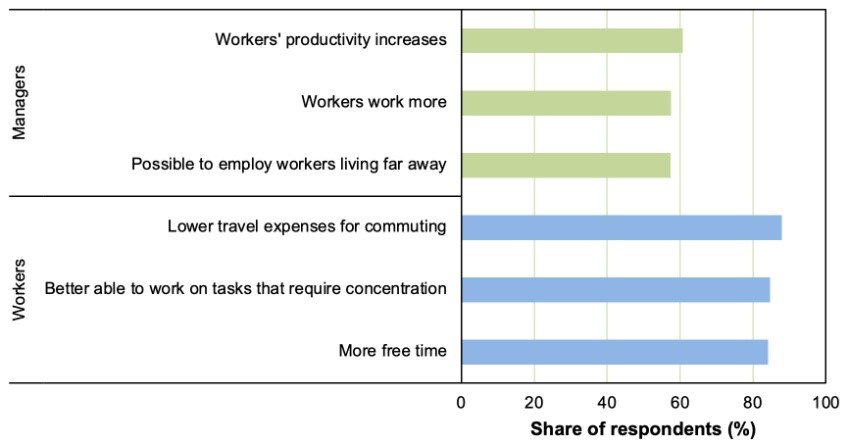
Panel B) Disadvantages for firm performance (managers) and individual well-being (workers)
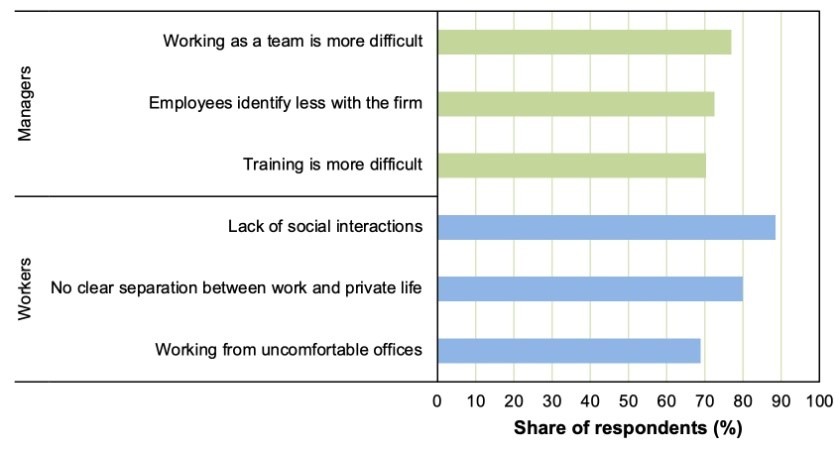
Note: Data are from the OECD Global Forum on Productivity Survey among managers and workers. Results based on Q10Managers: “In your view, how important are the following potential benefits for your company’s performance from telework?”; Q10Workers: “In your view, what are the most important potential benefits for employees from telework?”; Q11Managers: “In your view, what are the most important potential downsides for your company’s performance from telework?”; Q11Workers: “In your view, what are the most important potential downsides for employees from telework?. The share is calculated based on those answering 3 or higher on a scale from 1 (not important at all) to 5 (very important).”
Workers value the advantages of teleworking even more prominently. Almost 90% of employees cite less commuting as the most important upside of this working arrangement. As in Barrero et al. (2020), the time saved on the commute allows workers not only to work more on their primary activity but also to have more free time (according to 84% of them). Finally, 85% of employees indicate that they can work better on tasks that require more concentration as an additional benefit of teleworking.
Still, between 70% and 80% of managers seem to fear reduced collaboration, corporate identity, and knowledge sharing that may result from an excessive adoption of teleworking. On the workers’ side, more than 80% of them consider lack of social interactions and the fusing of private and professional life as the major downsides of teleworking. Working from uncomfortable office spaces represents a third crucial perceived drawback for almost 70% of workers. Overall, workers’ opinion about the pros and cons of teleworking confirms our conjectured trade-off regarding worker satisfaction.
Seizing opportunities while addressing risks
If teleworking is here to stay, firms and governments will have to implement additional measures to maximise its benefits and minimise its drawbacks. Our survey allows us to investigate the measures companies foresee (and workers desire) to accommodate and facilitate the use of this working arrangement. Figure 4 shows that there is agreement among a significant share of managers and workers that the schedules of workers should be coordinated, so that at least on some office days colleagues have the possibility to meet in person, exploiting the advantages of both planned and informal interactions.
Figure 4 Planned and desired measures to be implemented in the future to maximise the benefits of telework
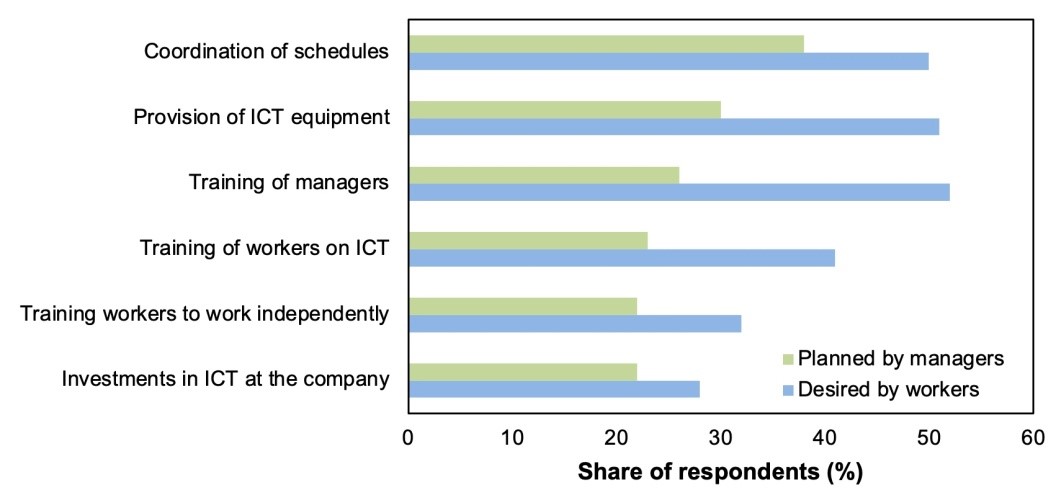
Notes: Data are from the OECD Global Forum on Productivity Survey among managers and workers. Results based on Q9Managers: “What types of organisational changes and HR management practices do you plan to introduce to better accommodate teleworking?”; Q9Workers: “What types of organisational changes and HR management practices would you find useful to introduce to better accommodate teleworking?”.
The second area where actions are required is company investment in information and communication technologies (ICT). More than 20% of managers and 40% of workers also stress the importance of providing ICT training to workers (‘hard skills’), complemented with training for managers on how to manage remote and hybrid teams and for workers on how to work independently from home (‘soft skills’). Our survey also finds that more productive firms plan to introduce these adaptive measures more intensively. This asymmetric response to the challenges of more intensive teleworking risks further widening performance gaps across businesses (Andrews et al. 2017), especially given the differences in the skills of the workforce of the most productive firms – in particular digital and managerial skills. (Criscuolo et al. 2021).
To ensure gains from telework, public policies should enable, empower, and protect
In this context, public policies play a key role in ensuring that teleworking has a positive impact on productivity and wellbeing, and that its advantages are not reaped solely by the most advanced firms and highest-skilled workers (Adams-Prassl et al. 2020). First, policies should enable access to teleworking from anywhere by promoting investments in broadband access and childcare facilities – both in urban and rural areas. Second, they should empower workers and managers by supporting upskilling and training on both hard (notably ICT) and soft skills. Finally, policies should protect workers from excessive teleworking by adapting the legal environment – with a special focus on health insurance coverage for remote working and the right to disconnect. Importantly, regulations should ensure this working arrangement remains a choice made jointly by employers and employees. Dialogue among social partners will be crucial to achieving these goals.
14 febbraio 2022
PRAGYAN DEB, DAVIDE FURCERI, JONATHAN D. OSTRY, NOUR TAWK, NAIHAN YANG
The effects of fiscal measures during COVID-19
(synthesis; full article – Vox Eu CEPR 02 February 2022 (https://voxeu.org/article/effects-fiscal-measures-during-covid-19)
Abstract: Countries worldwide launched wide-scale fiscal support measures to mitigate the unprecedented output losses caused by lockdowns aimed at flattening the COVID-19 curve. This column examines the effects of fiscal policy measures during the pandemic, using a novel database of daily fiscal policy announcements and high-frequency economic indicators for 52 countries from January 1 to December 31, 2020. The authors find that fiscal policy announcements have been effective in stimulating economic activity, boosting confidence, and reducing unemployment, but their effect varies by the type of measure and the stage of the pandemic.
Keywords: COVID-19 curve, lockdown losses, emergency lifelines, fiscal policy.
Since the beginning of the COVID-19 pandemic, countries worldwide have launched wide-scale fiscal support measures to mitigate the unprecedented output losses caused by necessary lockdowns aimed at flattening the COVID-19 curve (Gourinchas 2020, Auerbach et al. 2021, Deb et al. 2020). These measures have varied both in size and scope, with much larger announced interventions in advanced economies compared to emerging market and developing economies. In addition, a multitude of measures were used: emergency lifelines (which provided continued liquidity support to households and businesses in the form of loans or capital injections) were deployed in conjunction with demand-support measures (such as grants, direct transfers, tax relief schemes that can boost households and firms’ income). Fiscal space constraints likely played a role in determining the size and nature of fiscal packages. Countries with higher debt-to-GDP ratios relied more on below-the-line measures, while countries with relatively more space favoured above-the-line measures (Figure 1).
Figure 1 Fiscal measures by type and debt-to-GDP

Source: Deb et al. (2021).
In a recent paper (Deb et al. 2021), we quantify the effect of fiscal policy announcements on economic activity in a cross-country setting, through the use of a novel daily database of announcements of fiscal policy interventions in 2020. We also explore how effects vary across different types of measures, according to countries’ structural characteristics (e.g. per capita income, fiscal space), and according to the severity of the pandemic
Effect of fiscal measures on economic activity
We examine the effect of announced fiscal stimulus measures on economic activity using economic indicators available at daily, weekly, and monthly frequencies. At a daily frequency, it is unlikely that fiscal announcements react to developments in the economy, which limits concerns about reverse causality. To further address endogeneity concerns, we purge the daily announcements from lagged daily measures of activity that have been used recently to track the economic effects of the COVID-19 crisis – specifically, nitrogen dioxide (NO2) emissions, international and domestic flights, mobility indicators, and daily financial variables that capture expectations regarding future economic activity.
Our results suggest that fiscal announcements are associated with a persistent increase in stock market indicators and, consistent with theory and evidence in Auerbach and Gorodnichenko (2016), with an appreciation of the domestic currency vis-à-vis the US dollar (Figure 2). These results are corroborated at weekly frequencies, where we find that fiscal announcements are followed by an increase in the OECD economic tracker indicator.
Figure 2 Effect of fiscal measures on exchange rates and stock price indices (deviation from the baseline, logs)
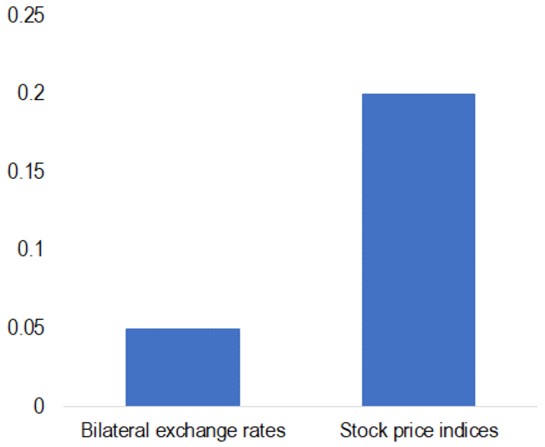
Source: Deb et al. (2021).
Note: The bar shows the effect after 30 days of fiscal policy announcements (as % of GDP) on bilateral exchange rates and stock price indices.
We also explore the effect of fiscal measures on more standard indicators of economic activity available at the monthly frequency, namely, industrial production (IP) indices, manufacturing purchasing managers’ indices (PMIs), unemployment rates, the OECD’s Composite Leading Indicator (CLI) for confidence, and sovereign credit default swap (CDS) spreads. For this purpose, and following Gertler and Karadi (2015), we aggregate the daily shocks into monthly average shocks. The results suggest that fiscal policy announcements have had, on average, a significant effect on economic activity (Figure 3). In particular, a fiscal shock of 1% of GDP increases industrial production by 0.25%, with the effect equivalent to a fiscal multiplier of 0.2 for the sample on average. Results also show that fiscal announcements boost PMIs and the CLI, and lead to a reduction in the monthly unemployment rate, and a narrowing in sovereign CDS spreads.
Figure 3 Effect of fiscal measures on IP, PMI, CLI unemployment, and sovereign CDS spreads (% (LHS), percentage points (RHS)
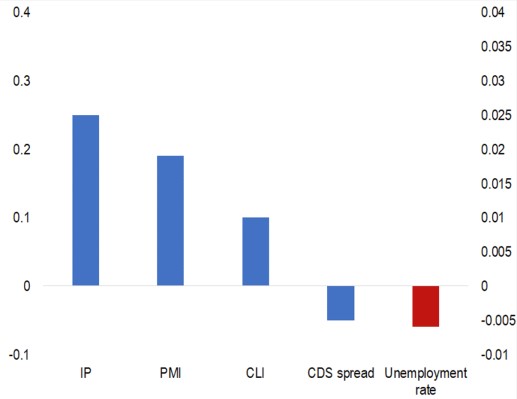
Source: Deb et al. (2021).
Note: The bar shows the monthly effect of 1% fiscal policy announcement (as % of GDP) on economic activity indicators. The effect on the unemployment rate is in percentage points and presented on the right hand-side axis.
The role of country characteristics
The average effect of fiscal stimulus measures on economic outcomes also varies depending on country characteristics. The results suggest that fiscal effects are larger for the advanced economies (Figure 4), consistent with previous findings in the literature (Ilzetzki et al. 2013). In addition, fiscal shocks appear much more effective in countries with lower public debt levels before the crisis, as the crowding-out effects on private investment and consumption are typically larger in countries with high debt (Nickel and Tudyka 2014, Furceri and Zdzienicka 2020).
FIgure 4 Effect of fiscal announcement shocks on IP, depending on country characteristics (%)
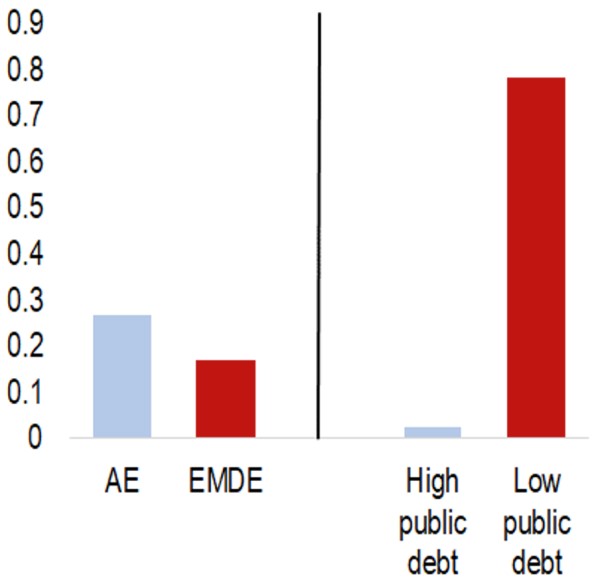
Source: Deb et al. (2021).
Note: The bar shows the monthly effect of 1% fiscal policy announcement (as % of GDP) on industrial production depending on a country’s income level (AE or EMDE) and the level of public debt. Light shaded bars denote no statistical significance.
Type of fiscal measures and the pandemic cycle
While fiscal measures appear effective on average in boosting economic activity and confidence, their effect may also differ depending on the type of measure deployed, and on whether stringent containment measures are in place. Our results suggest that on average, emergency lifeline measures (the bulk of which are classified as below-the-line measures), are more effective than demand-support measures (which are mainly classified as above-the-line measures) (Figure 5). However, this result masks important heterogeneity with respect to the pandemic cycle. We find that emergency lifelines, which aim to reduce supply constraints and keep firms operating and workers employed, were more effective during lockdowns, as they provided much needed cash flow and liquidity support during the months of constrained economic activity. Meanwhile, the effects of demand-support measures are much stronger when containment measures are being eased, as domestic consumption opportunities are higher at that stage.
Figure 5 Effect of fiscal announcement shocks on IP, by type and depending on the pandemic cycle (%)
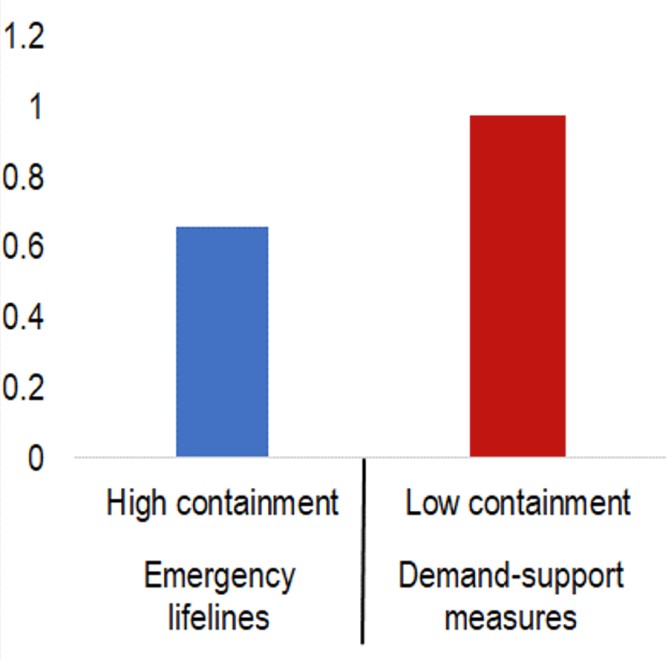
Source: Deb et al. (2021).
Note: The bar shows the monthly effect of 1% fiscal policy announcement by type of measure (as % of GDP) on industrial production depending on whether containment measures are high or low.
31 gennaio 2022
JEAN-CHARLES BRICONGNE, BAPTISTE MEUNIER
The best policies to fight pandemics: Five lessons from the literature so far
(synthesis; full article – Vox Eu CEPR 10 August 2021 (https://voxeu.org/article/best-policies-fight-pandemics-five-lessons-literature-so-far)
Abstract: While repeated waves of Covid-19 infections are prolonging the global pandemic, the literature is drawing tentative lessons from the various measures implemented. This column highlights five. (1) A stringent and early lockdown seems more efficient. (2) Although a comparison across measures is econometrically challenging, the cancelling of public events stands out as one of the most efficient. (3) While the merits of geographical targeting seem mixed, numerous models advocate for targeting by age and type of job. (4) Even without a lockdown, pandemics affect economic activity through voluntary social distancing. (5) Relaxing a lockdown should be done gradually even during vaccine roll-out, as avoiding a resurgence relies on rigorous sanitary measures.
Keywords: COVID-19 waves, pandemic effects, lockdown measures, economic models, sanitary measures.
In the context of continuing waves of Covid-19 infections and associated measures to fight the pandemic, the literature is starting to draw lessons from the various policies implemented. In this column, we highlight five lessons, while acknowledging that disentangling the effects of the different factors – among which are lockdown measures – is challenging since they have been at play simultaneously or following the same sequence across countries.
Lesson 1: A more stringent and earlier lockdown seems more efficient to contain an outbreak, even though the importance of sanitary measures should not be downplayed.
More stringent and earlier lockdowns – when the number of cases is low – are more efficient to curb infections. According to empirical findings in IMF (2020), the number of infections has been significantly lower for countries with early lockdowns. In addition, a more stringent lockdown has an immediate effect on curbing infections; otherwise, the effect is non-significant. Other empirical studies on US (Demirguc-Kunt et al. 2020) or European data (Dave et al. 2021b) confirm these results.
Theoretical models confirm that an early and stringent lockdown reduces the economic impact and death toll of the pandemics. Alvarez et al. (in press) conclude that it is optimal to implement a strict lockdown for only two weeks after the first Covid-19 cases. Other models support this finding both in the medical (Buckman et al. 2020, Vinceti et al. 2020) and economic (Eichenbaum et al. 2020, Farboodi et al. 2021) literatures. However, this might not indicate that returning to a lockdown would be unnecessary thereafter. Caulkins et al. (2021) show that it can be optimal to have two or three distinct lockdown periods, depending on local preferences regarding how to balance health and economic impacts.
Various studies have also highlighted the benefits of sanitary measures based on mass testing, generalized use of masks, and screening. Summers et al. (2020), Shaw et al. (2020) and Yalaman et al. (2021) document the efficiency of Asian countries’ strategies based on: (i) early and massive introduction of borders screening, (ii) stringent process to isolate suspect cases and virus-bearers, (iii) use of new technologies for efficient contact tracing, and (iv) generalised use of masks. Making masks compulsory is assessed to reduce the number of infections between 25% and 40% compared to optional mask-wearing (Mitze et al. 2020, Krishnamachari et al. 2021, Chernozhukov et al. 2021). Masks not only help prevent viral transmission but also reduce exposure to cold environments (Bubbico et al. 2021). These sanitary measures are more efficient, however, if combined with social distancing (Firth et al. 2020, Ando et al. 2021) and if the population’s civic sense is high (Barrios et al. 2021). As regards testing, Atkeson et al. (2020) find that the economic benefits of rapid screening programmes exceed their costs by a ratio of 4 to 15. But while most also point to a positive effect of extensive testing (Brotherhood et al. 2020, Hellmann and Thiele 2020, Su et al. 2021), Acemoglu et al. (2020b) report an ambiguous impact since it might lead the population into reducing its social interactions less, fostering the spread by undetected virus-bearers.
Lesson 2: A cost-benefit analysis across different measures is econometrically complex and might be complicated by heterogeneities, but it tends to show the efficiency of cancelling public events for curbing infections. The negative impact of such measures, notably on inequalities and human capital, can also be highlighted.
Disentangling empirically the marginal impact of each measure is complex as they have generally been implemented simultaneously or following the same sequence (Hsiang et al. 2020) with the low quality of data on infections being an additional challenge (Bonacini et al. 2021). Studies have nevertheless estimated their marginal impact. Among those, Deb et al. (2020) estimate not only the health benefits – i.e. how it slows the spread of the virus – but also the economic costs. They find that workplace closures are efficient in reducing infections but are also the costliest in terms of economic impact. They also report that school and public transport closures have a high economic cost but a limited effect on the outbreak. Finally, the authors find that international travel restrictions and, to a lesser extent, limits on the size of gatherings and cancelling of public events display the greatest benefit-to-cost ratios.
The impact of each measure remains, however, highly debated. Table 1 recapitulates how various studies estimate the health benefits of different measures. It highlights large discrepancies. A consensus seems to emerge, however, on the high impact of cancelling public events, and on the mild impact of public transport and non-essential business closures. On the latter, while Song et al. (2021) estimate that it has indeed been significantly protective for workers in this sector, it however translated into higher unemployment (Sjoquist and Wheeler 2021). Studies point to the benefits of an alternative more targeted closure for only high-contact places such as restaurants, gyms, and pubs (Courtemanche et al. 2020, Chang et al. 2021).
Studies also bring forward heterogeneities associated with duration, geographical factors, and government efficiency. Li et al. (2021) find evidence that the impact depends on time horizon with for example international travel restrictions efficient after seven days but not after 28 days. Burlig et al. (2021) model a same non-linear impact in time for domestic travel bans. More generally, Bakker and Goncalves (2021) show that the impact of measures on infections declined over time. As regards geographical heterogeneities, Russell et al. (2021) show that international travel restrictions might have little impact on pandemics except in countries with low Covid-19 incidence and large numbers of arrivals from abroad. Bennett (2021) show a significant efficiency of lockdown measures in high-income areas but non-significant in the low-income ones while Becchetti et al. (2020) find them to be more effective in highly polluted areas. Pan et al. (2020) also report heterogeneities associated with racial composition and poverty. Finally, Bakker and Goncalves (2021) find that measures have been more efficient in countries with higher government’s effectiveness.
Table 1 Relative impact of various measures on containing infections
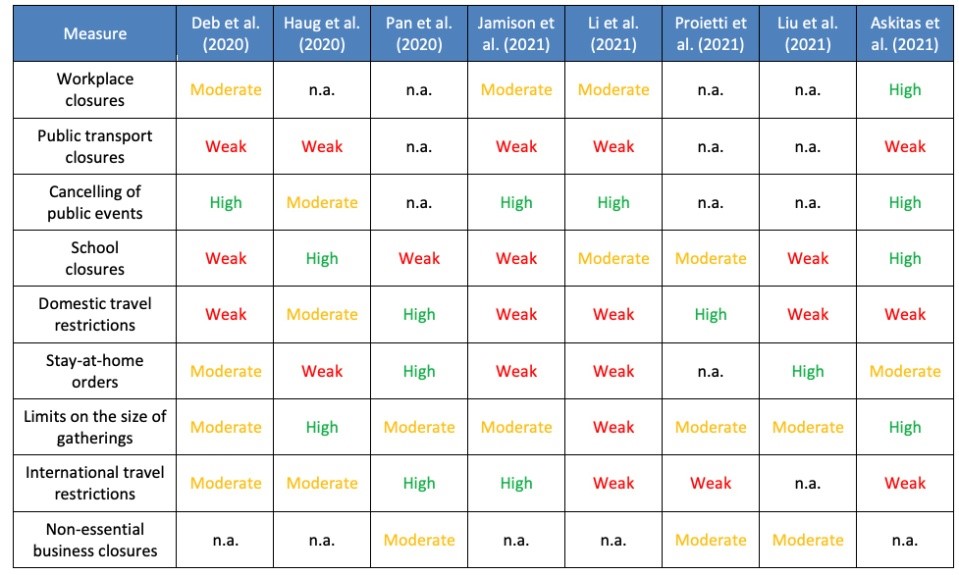
Whatever their individual impact, however, most studies converge on their combined efficiency – even though voluntary social distancing also naturally reduces infections. Flaxman et al. (2020) estimate that comprehensive lockdowns (a mix of workplaces and school closures, cancelling of public events, stay-at-home orders, and limits on the size of gatherings) in Europe have reduced the reproduction rate by 80%. Santeramo et al. (2021) for Italy and Ferguson et al. (2020) for the UK and the US reach the same conclusion. Voluntary social distancing taken spontaneously by the population might however explain a share of the reduction in infections. Agrawal et al. (2021) and Berry et al. (2021) fail to find that places that implemented lockdowns earlier or for longer have lower excess deaths, while Singh et al. (2021) find only a modest effect. In the same vein, studies have documented that lockdown measures account for a relatively small share of the change in individuals’ behaviours (Gupta et al. 2020b, Cronin and Evans 2020).
On top of a negative short-term economic impact, stricter measures might entail long-term detrimental effects on inequalities, mental health, and human capital. The impact of lockdowns is disproportionate on vulnerable groups such as low-skilled workers (Cajner et al. 2020), whose jobs are less likely to be able to be performed remotely (Dingel and Nieman 2020). School closures and lack of access to reliable childcare have taken a higher toll on young parents (Papanikolaou and Schmidt 2020), and notably women (Del Boca et al. 2020, Albanesi and Kim 2021). This has even been the case in academia where women, particularly those who have children, report a disproportionate reduction in time dedicated to research relative to others (Deryugina et al. 2021). In the longer run, job losses might have hysteresis effects with workers falling into long-term unemployment. In addition to this immediate destruction of human capital, school closures can also weigh on future generations’ capacity to accumulate human capital (Fuchs-Schündeln et al. 2021). Isolation measures such as stay-at-home orders also affect mental health (Béland et al. 2020b, Sibley et al. 2020). Finally, the aggregate effect on the death toll might be more ambiguous. Mulligan (2020) and Faust et al. (2021) show that the pandemics and associated recession may lead to a significant increase in the number of deaths from suicide, substance abuse, and murder – in particular among disadvantaged populations (Chen et al. 2020b, Krieger et al. 2020). Lin et al. (2021) also show that in low-income countries, recessions coming with lockdowns increase child mortality, leading to an inter-generational trade-off with the Covid-related deaths avoided mostly for seniors.
Lesson 3: While no consensus emerges on geographical targeting, several models advocate for differentiating restrictions by age and type of jobs. In Europe, studies point out the benefits of a coordinated approach both in implementing and relaxing lockdowns.
Targeting might seem a priori relevant. Studies have documented heterogeneous impacts depending on population density (Dave et al. 2021b), age and dependency ratio which particularly influence the mortality rate (Levin et al. 2020, Bürgi and Gorgulu 2020), and workers categories (Akbarpour et al. 2020).
Numerous theoretical models advocate for targeted measures on seniors and employees whose job can be performed remotely. Acemoglu et al. (2020a), Alon et al. (2020), and Gollier (2020) conclude that applying more stringent measures to those aged 65+ reduces the economic cost while maximizing health benefits. Focusing on deaths and ICU (intensive care unit) bed occupancy, Ferguson et al. (2020) estimate that social distancing only for those aged 70+ has two to three times the effect of social distancing for the entire population. In addition, Aum et al. (2020) show that locking-down only employees whose job can be performed remotely reduces by half the economic cost compared to a situation where all workers are required to stay at home – for the same health benefits. Another possibility is the implementation of alternate slots in firms and schools to reduce social interactions (Akbarpour et al. 2020). A counterargument, however, comes from studies such as Checo et al. (2021), who find that targeted measures have a higher macroeconomic cost as they remain in place for longer. Another is given by Singh et al. (2021), who empirically find that only measures targeting the general population have a statistically significant impact.
The literature provides mixed evidence regarding geographical targeting. Li et al. (2020) and Lin and Meissner (2020) conclude that local lockdowns have a limited impact on the spread of the virus. Elenev et al. (2021) also provide evidence of spillovers from stay-at-home orders. Dave et al. (2021c) also show how a ‘super-spreader’ event in a US state with a loose lockdown can impact infections in other states with more stringent measures in place. On the opposite, Fang et al. (2020) empirically show how locking down 63 cities in Hubei had successfully contained the spread across China. On a more theoretical perspective, Fajgelbaum et al.’s (2020) model demonstrates that stringent measures only to selected boroughs in large metropolis could be as efficient as a generalised lockdown while significantly reducing the economic impact. Similarly, in a model separating cities and rest of the state, Bisin and Moro (2021) find that a city-only lockdown does not induce a much larger fraction of infected persons than a general lockdown. Finally, Crucini and O’Flaherty (2020) suggest that local restrictions are optimal in a fiscal union as a national policy would be too restrictive for mildly infected areas, weighing therefore too much on the local economic activity.
At the European level, some studies show the benefits of a coordinated approach not only when implementing lockdowns but also when relaxing them. Ash (2020) estimates that relaxing together would delay the resurgence of the virus by five weeks. Symmetrically, she shows that a coordinated implementation of lockdowns across Europe has a stronger impact on infections – in line with the findings of Ruktanonchai et al. (2020). This is particularly due to strong health spillovers across Europe (Costa-i-Font 2020).
Lesson 4: Even in the absence of lockdown measures, the spread of the virus affects economic activity due to voluntary social distancing. The negative impact of such measures should therefore not be overvalued.
Countries with more stringent lockdowns have experienced sharper GDP contractions. This relation remains valid for other macroeconomic indicators such as households’ consumption (Baker et al. 2020b, Carvalho et al. 2020), employment (Béland et al. 2020a, Schotte et al. 2021) or industrial production (Deb et al. 2020). Theoretical models back such a correlation (e.g. Baqaee and Farhi 2020).
However, even in the absence of lockdown measures, the spread of the virus affects economic activity. Voluntary social distancing has a major impact on activity while heightened uncertainty (Baker et al. 2020a) and deteriorating economic prospects (Baek et al. 2020) also weigh on it. Studies recapitulated in Table 2 show that lockdown measures are estimated to account for around 10 to 60% of the total economic impact of Covid-19. The literature provides vast evidence for an impact of the pandemics in the absence of lockdowns. Chetty et al. (2020) note a contraction of activity before the start of lockdowns in the US. Rojas et al. (2020) and Kahn et al. (2020) observe that the surge in unemployment claims has been homogeneous across the US, notwithstanding local measures. Going forward, Chen et al. (2020a) and Berry et al. (2021) find even no robust empirical evidence for a significant effect of lockdown measures on economic activity.
Table 2 Share of the economic impact attributed to lockdown measures
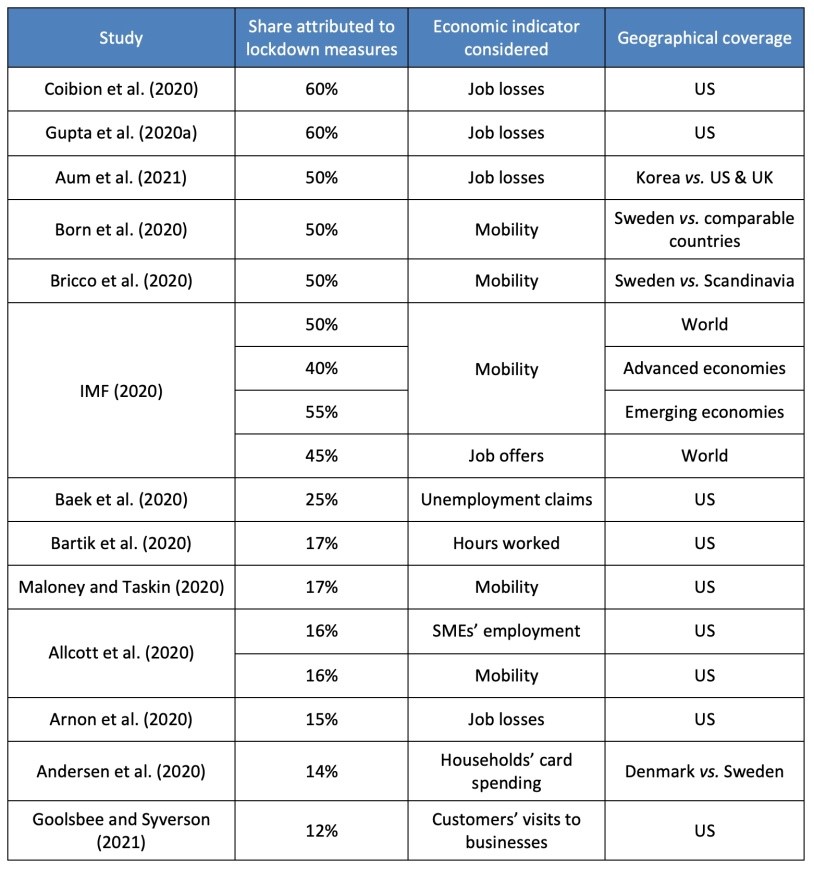
Studies regarding the Spanish flu also tend to find no significant effect of lockdowns on economic activity, both in the short and medium run. Some studies have documented an economic impact of the Spanish flu at the local (Dahl et al. 2020) or the global level (Barro et al. 2020) – in contrast however with Velde (2020) attributing the contraction to uncertainty surrounding the end of WWI. On US data, Correia et al. (2020) and Bodenhorn (2020) find no evidence for a significant economic impact of lockdowns in the short term, while Lilley et al. (2020) and Chapelle (2020) reach a similar conclusion regarding medium-term GDP growth. Such results should, however, be taken cautiously given the poor quality of the data and the fact that lockdown measures were far less stringent back then (Beach et al. in press).
Lesson 5: Relaxing the lockdown should be done gradually even during vaccine roll-out as the absence of an epidemic resurgence relies on rigorous sanitary measures.
Relaxing the lockdown should be done gradually and, where appropriate, differently depending on age and sectors. Gradualness is particularly essential if herd immunity has not been reached (Toda 2020). Dave et al. (2021d) and Singh et al. (2021) have documented anyway the persistence of individuals’ stickiness to pandemic behaviour, suggesting that even rapid and broad-based reopening may have muted impacts on mobility or economic activity. As such, the effects of restrictions and re-openings might be asymmetric depending on the phase of the pandemic (Dave et al. 2021a) with, for example, a smaller role for information shocks and lower demand for mitigation behaviours in the late-pandemic period. In addition, Favero et al. (2020) advocate for relaxing by age groups and by sectors to foster a quicker recovery. Baqaee et al. (2020) and Chang et al. (2021) also call for maintaining restrictions for ‘super-spreaders’ places (e.g. restaurants, gyms, pubs) and large public events.
Once lockdowns are relaxed, studies show the importance of sanitary measures to limit the spread of the virus even during vaccine roll-out. Renardy et al. (2020) find that delaying the re-opening does not reduce the magnitude of the following infectious wave, but only delays it; on the contrary, reducing levels of social interactions both delays and lowers it. Courtemanche et al. (2021) also document how the re-opening of schools in the midst of high virus spread and with only superficial social distancing rules substantially accelerated the spread of Covid-19 – in line with others putting this finding in perspective with the fact that, if associated with sanitary measures, school reopening has only modest effects on Covid-19 cases (Bravata et al. 2021, Goldhaber et al. 2021). Finally, Cot et al.’s (2021) model finds that vaccinations alone are not enough, and strict social distancing measures are still required until sufficient immunity is achieved. Agarwal et al. (2021) also find that relaxing restrictions during vaccine rollout significantly increase mortality.
While vaccination curbs infections and severe cases, fighting vaccine hesitancy might be key to achieve herd immunity and might require adequate policies. Broad-based vaccination campaigns have been shown to effectively limit the spread of the virus but above all the emergence of severe cases (Moghadas et al. 2021). However, building confidence in vaccines remains central to achieve a sufficient level of immunity in the population (Dror et al. 2020, Harrison and Wu 2020). General beliefs about vaccination and the own risk of infection can explain variations in this confidence (Wang et al. 2020, Sherman et al. 2021), but there is evidence that vaccine hesitancy is higher among low-income and low-educated people (Khubchandani et al. 2021). For this disadvantaged population, Alsan and Eichmeyer (2021) point to the benefits of relying on non-experts since the lower socioeconomic proximity of experts to them may undermine their trust in the vaccine. In addition, Gans (2021) finds that reducing the costs of access to the vaccine – for example, by providing vaccines at low-priced general merchandise retailers as suggested by Chevalier et al. (2021) – can improve its adoption. He finds, however, that this is not the case with policies that target the utility of un-vaccinated agents – for example, and most notably, vaccine passports – which either lead to equivalent or lower vaccine adoption. Finally, in terms of vaccination strategy, Więcek et al. (2021) show that fractional dosing would substantially reduce infections and mortality if it enables to increase the rate of vaccination.
17 gennaio 2022
JANICE EBERLY, JONATHAN HASKEL, PAUL MIZEN
‘Potential capital’, working from home, and economic resilience
(synthesis; full article – Vox Eu CEPR 13 January 2022 https://voxeu.org/article/potential-capital-working-home-and-economic-resilience)
Abstract: The impact of an economic shock depends both on its severity and the resilience of the response. The COVID-19 pandemic caused a widespread decline in recorded GDP, but this was buffered by an unprecedented and spontaneous deployment of ‘potential capital’ – the dwelling/residential capital and connective technologies used while working from home. This column estimates that together, potential capital and labour working from home provided additional output margins and capacity which roughly halved the decline in GDP in the US and revises downwards the estimated total productivity gains in the business sector during the pandemic.
Keywords: COVID-19 pandemic, economic shock, economic resilience, remote labour, potential capital, labour market adjustments.
Large shocks test an economy’s ability to adapt, adjust, and continue – a capability called ‘resilience’ – in response to the unexpected (Brunnermeier 2021). Critical infrastructure may be damaged or unavailable, leaving other systems stretched beyond capacity. Whether a natural disaster, terrorism or cyber attacks, or a global pandemic, the severity of a crisis is determined not only by the size of the shock, but also by the resilience of the response. The COVID-19 economic and health crisis greatly stressed the major economies (Altig et al. 2020, Aneyi et al. 2021) and led to labour market adjustments (Barrero et al. 2020), but in some cases also elicited unplanned resilience.
In a recent paper (Eberly et al. 2021), we argue that fungibility of factors of production at different locations contributed substantially to economic resilience during the COVID-19 pandemic. This required not only the much-discussed ability of some (fortunate) workers to work from home (Bloom et al. 2015), but also the capital they needed to deploy from these remote-from-work locations, including the capital to connect them to each other and the workplace. We call this ‘potential capital’. Conceptually, it is the equipment – home offices, laptop computers, and internet connections – that can be combined with remote-from-workplace labour to produce output.
We identify two puzzles and two results due to the resilience provided by both potential capital and remote-from-workplace labour.
Why did output fall by so little in the pandemic?
Consider the Covid pandemic – one of the largest economic shocks in living memory and the largest in 300 years for some countries.1 The dark bars in Figure 1 show the peak-to-trough (2020Q1 to Q2) actual decline in GDP for the seven countries we study in our paper. The decline is dramatic: it shows quarterly declines of between 9 and 20 log points.2 Yet, catastrophic as the collapse was, it could have been worse. Many workplaces were closed and people were advised to isolate and to work from home (WFH). As we shall document, since much of the workforce was working from home, there was a fall in hours at the workplace of nearly 30 log points from 2020Q1 to 2020Q2 (an unweighted average in our seven countries). Based on an output elasticity of two-thirds, output should have fallen by 20 log points – far more than the actual (average) drop of 14 log points. Thus, first puzzle: why did output fall by so little in response to these large changes in hours at the workplace? Could the decline in output have been buffered by economic resilience arising from remote labour?
Figure 1 Actual output and workplace output 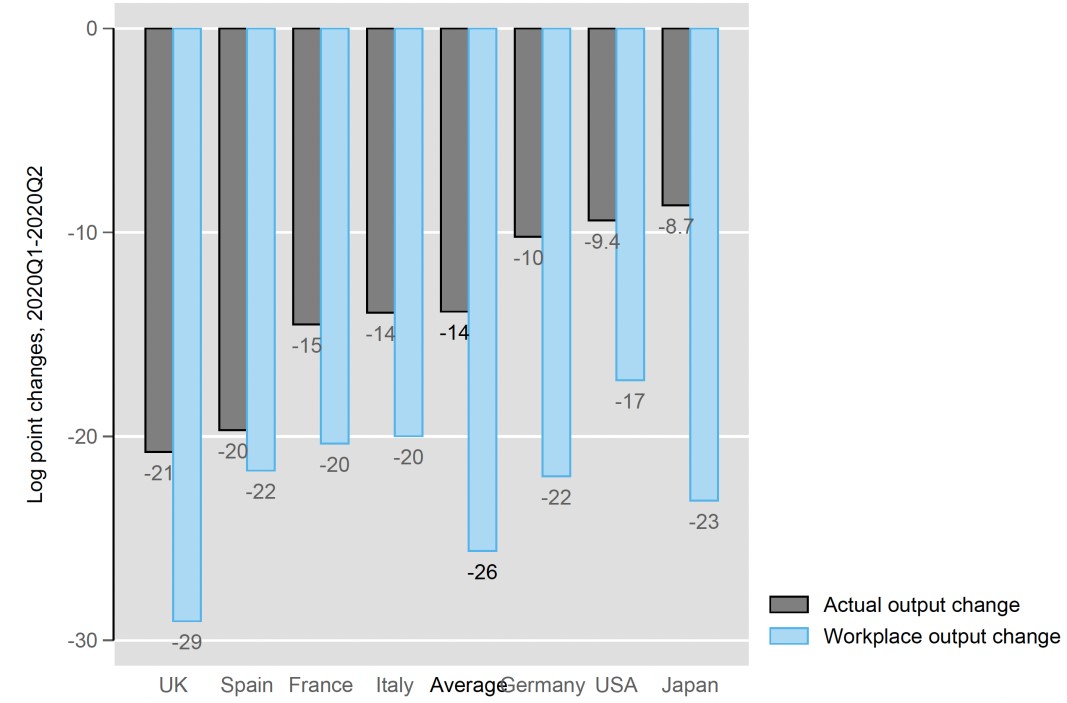
Notes: Actual Output is the decline in GDP from Q1 to Q2 of 2020 in National Accounts data. Workplace Output is calculated based on factor use at the workplace, from Eurostat, BEA, National Accounts and own calculations (see data appendix in Eberly et al. 20201). Work from home from ONS and Google mobility data is described in the appendix. Average is an unweighted average of all countries.
A second puzzle emerges if we consider capital in addition to labour. As Mokyr (2001) documents, the history of industrialisation shows the point of going to the workplace is that workers have capital with which to work. It seems hard to believe that the economy substituted a 30-log-point fall in hours with a rise in workplace capital in a matter of weeks. Rather, with fewer workers at the workplace, it seems very likely that workplace capital utilisation also fell. Based on industrial electricity consumption, we estimate a fall in capital use at the workplace of just over 20 log points, which, with an output elasticity of one-third, should have reduced output by a further 7 log points. Thus in Figure 1, the light bars, which are the implied workplace output changes, lie below actual bars illustrating our puzzle: why did output fall by so little in response to these large changes at the workplace? Expanding our question above, could the decline in output have been buffered by economic resilience arising from capital deployed from home?
We propose that the answer to these puzzles is that capital equipment and structures at home were brought into use for production, providing the capacity to respond to a large unanticipated shock. During Covid, potential capital alongside labour working from home helped to offset the expected decline in output due to low workplace labour and capital utilisation rates, which explains why output did not fall as much as it might have done. Production was buffered by use of capital and labour at home. Productive labour and capital at home gave firms flexibility to respond to a large shock like Covid. Fungibility between capital and labour at home and the workplace is therefore a source of economic resilience because capital at home has both productive capacity (e.g. it can run software) and connectivity with other workers, making WFH both possible and productive.
Some growth accounting
We will assume the standard structure for growth accounting and TFP estimation, that is, constant returns to scale, perfect competition, and optimising behaviour.3 So as to isolate the effects of interest, the only deviation is to add home versus workplace production. Changes in output, Y, are therefore changes in the inputs times their output elasticities. We suppose that labour services, L*, are hours and capital services, K*, are capital (later we shall write capital services as a product of capital stocks and capital utilisation.) Trends in online sales follow a similar (but more modest) pattern, with some increase in the share of sales being made online during the pandemic, some of which is expected to persist over the medium term (Figure 3). Just over a third of firms expect to sell more online than they did pre-pandemic. This is a significant share, but it affects only around half as many firms as the increase in homeworking. Our new distinction is to differentiate factors at the workplace and those at home. Them the growth in total nominal output (YW and YH being output produced at the workplace and home, respectively) is the growth in labour hours at work and at home (HW and HH) times the relevant elasticities, and similarly for capital services at work and at home (KW and KH), plus the contributions of total factor productivity at work and at home. To get back to the concept of resilience, it is important to note that Y falls if L and K at work fall, which is conventional, but is offset if L or K migrates to home.
To measure the change in log GDP we set the L and K shares as two-thirds and one-third, respectively. By assuming that labour is paid the same at home or at work, then the payments weights are the share of hours at home and at work. But in the labour market we must account for the possibility of furloughs. In the UK, a furlough policy allowed firms to temporarily suspend workers rather than laying them off, with the government paying 80% of their wages. We remove these workers from the calculations. Other countries did not have the same scheme, but we can make sector-by-sector adjustments to remove those who were effectively furloughed.
For the capital shares, using national accounts conventions we can measure share of KH as the dwelling payments as a share of total capital payments. This estimate needs to be adjusted in at least three ways. First, we multiply dwellings capital by labour force participation, assuming that dwellings capital can be potentially brought into production in proportion to the fraction of the population who may potentially be WFH. Second, KH is not just dwellings capital but, for example, domestic computers and the internet, which are not counted as investment in national accounts but as consumption. We also need to adjust for utilisation, which we proxy using final commercial and domestic energy use, corrected for seasonality and temperature, and excluding the output of the energy generation sector itself and (the very volatile) transport sector.
International evidence
The results below show a growth accounting exercise for seven advanced economies. Data are drawn from the OECD, Eurostat, ONS and Bank of England, with details in Eberly et al. (2021). Figure 2 shows the time series response of four key variables: an index of output, labour hours and energy consumption (100 = 2019Q4), and WFH share of the total workforce. The first three indices show the decline in output, labour hours, and energy use demonstrating the impact of the shock. The fourth shows the response in the workforce, as the share of working from home increased peaking in 2020Q1 in Japan and 2020Q2 in the remaining six countries.
Figure 2 Output, labour, energy, and working from home
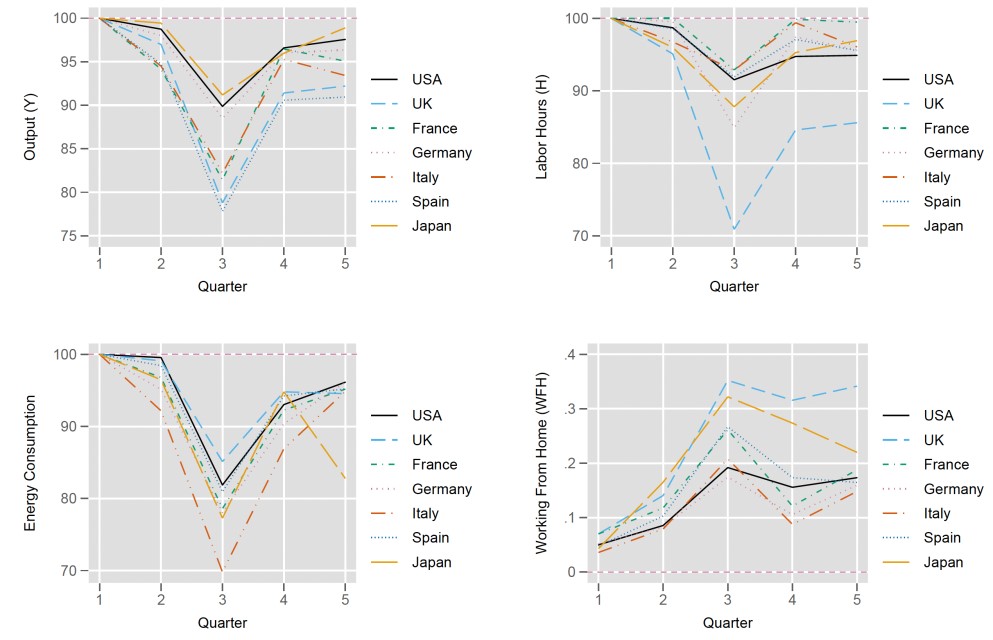
Actual output and workplace output
Our results in Figure 3 show log point changes in output and workplace output, as in Figure 1, but for all quarters in 2020. In all countries, output fell in 2020Q1 and precipitously in 2020Q2. After lockdowns were eased in the summer output rebounded across the board. As the lighter line shows, workplace output fell by more in 2020Q1 and 2020Q2, but this was offset to a degree by the use of potential capital and labour working remotely, demonstrating the resilience effect of working from home. In later quarters, workplace output recovers – in some countries by more than actual output (Japan, Germany, Italy) – as it replaces some remote work, which declines. We estimate economic resilience in the pandemic accounted for 8–14% of GDP in the trough of the COVID recession.
Figure 3 Actual output and workplace output
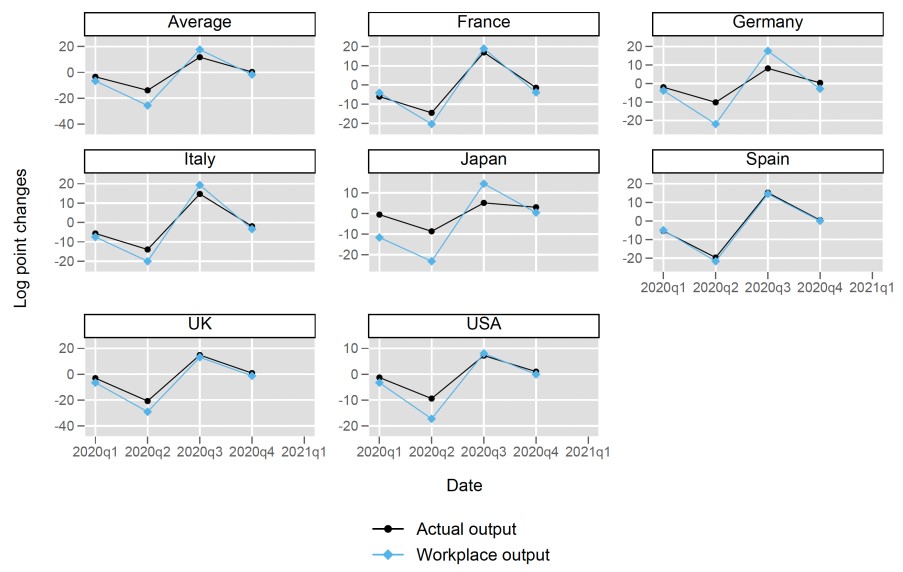
Exploring the contributions that were made ‘at work’ and ‘at home’, we see in Figure 4 the use of inputs at the workplace fell in 2020Q1 and 2020Q2 (light bars), rose in 2020Q3, and was somewhat flatter in 2020Q4. The contributions from home inputs (dark bars) were the opposite: rising in 2020Q1 and Q2 and then falling. Notice that the contributions were considerable in 2020Q1 in all countries, especially in countries where the virus struck relatively early, such as Japan. The data are more mixed in 2020 Q2, reflecting the later impact of the virus in the US and UK, where there was a substantial offset from the contribution of home output.
Figure 4 Capital and labour contributions to home and workplace output
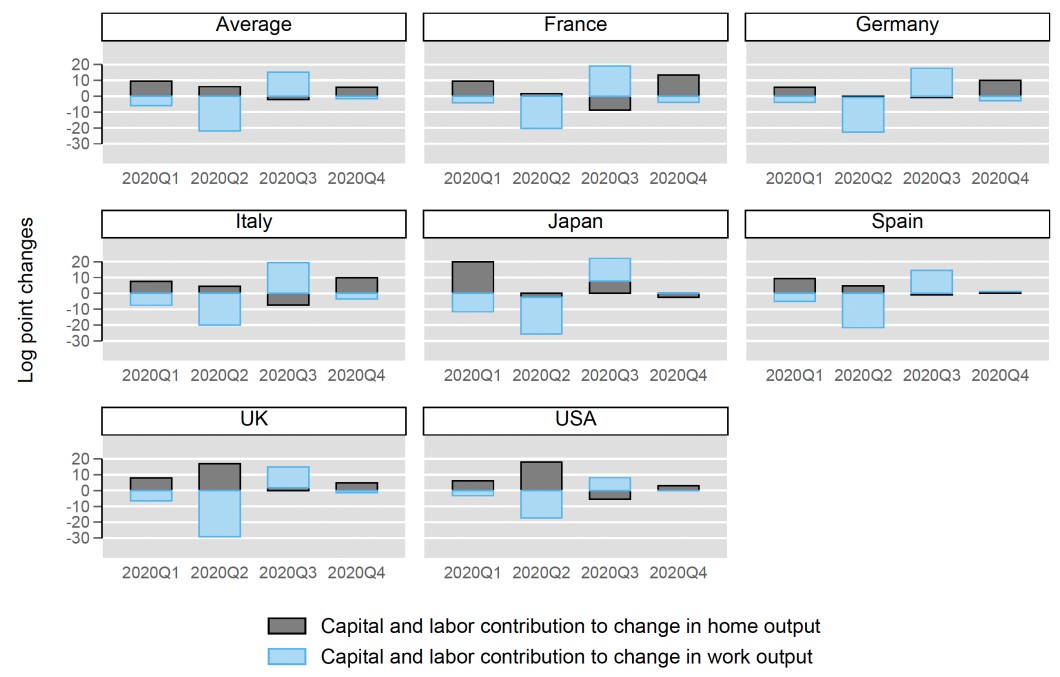
Total factor productivity
Figure 5 plots the effect on TFP. Workplace TFP takes actual output and subtracts off the contribution of workplace input. This generates an apparent rise in TFP in the UK and US initially, since these countries had a large cushion from working from home. That is, in those countries the ‘hidden’ input from working from home causes an apparent rise in TFP. There is then a large drop in workplace-based TFP, as resources switch back to the workplace.
Figure 5 Total factor productivity
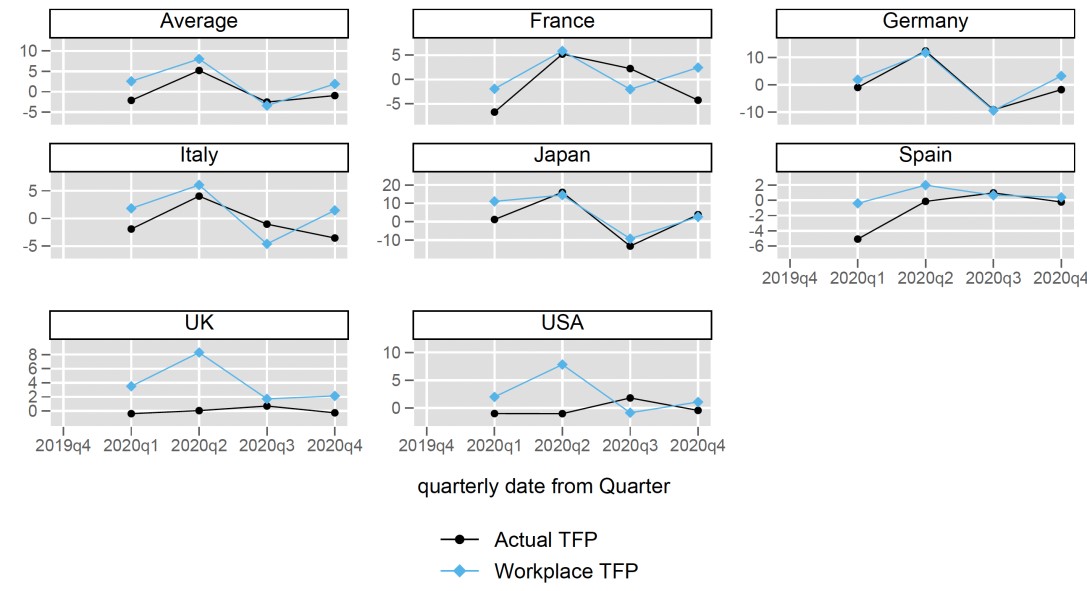
Ignoring home capital, the UK and US would have been misconstrued as seeing a productivity boom during the pandemic. Similarly, in continental European countries, productivity would have been higher, although not quite the boom that would have been observed in the US and the UK. The exception is Germany, where manufacturing for export continued to produce output without much interruption, but labour hours across all sectors was lower in 2020Q2 than it had been before COVID; after making adjustments for labour and capital at home the boom is still observed
Conclusion
Home capital and home working proved to be a source of economic resilience that we estimate accounted for between 8% and 14% of GDP in the trough of the COVID recession. Following one of the largest economic shocks in living memory, our results emphasise that the quantitative effects were not as large as they might have been due to the large-scale restructuring of production at pace. If WFH were to be ignored along with potential capital, output would appear to have fallen and productivity would have been exceptionally strong in 2020Q1 and 2020Q2, due to mismeasurement of labour and capital inputs to production of goods and services. The pandemic has revealed under-utilised capital across the economy and across the globe. The gig economy previously uncovered and deployed some of this capacity, such as the part-time driver who uses their domestic vehicle for commercial rides, yet none of these explorations envisioned the deployment of home capital at the scale and speed, with the potential consequences, observed in the context of the COVID-19 crisis. The pandemic revealed unused capacity as a macroeconomic phenomenon.
20 dicembre 2021
KIERAN MC MORROW , FRANÇOIS BLONDEAU, FRANCESCA D’AURIA, BJÖRN DÖHRING, ATANAS HRISTOV, CHRISTOPH MAIER, ANNA THUM-THYSEN
Output gaps, potential output and the Covid-19 crisis: Policymaking under uncertainty
(synthesis; full article – Vox Eu CEPR 10 December 2021 https://voxeu.org/article/output-gaps-potential-output-and-covid-19-crisis)
Abstract: Strong policy actions have dampened the impact of Covid-19 on workers and businesses. Amid a rapid recovery, dents to potential output are set to remain limited and transitory. But many uncertainties persist and some economic scarring from the pandemic may only emerge over the coming years. This column summarises the insights from a recent conference on the implications of the Covid-19 recession for the EU’s growth potential.
Keywords: COVID-19 crisis, Global crisis, Euro area economies, Policy support, productivity growth.
Potential output and the output gap are key metrics for policymakers to assess the cyclical position and productive capacity of the EU and euro area economies (Ademmer et al. 2019). Output gap estimations, despite being subject to uncertainty in real time, provide valuable information to policymakers, most notably when the economy is hit by large and overlapping shocks, as is the case with the Covid-19 pandemic.
In this context, a key macroeconomic take away from a recent joint OGWG-ECFIN-JRC conference on “Assessment of output gaps and potential output in the context of the COVID-19 pandemic and its aftermath” is that the Covid-19 shock to the EU’s potential output is very different from that of the 2008-09 Global Crisis. Participants largely agreed that the Covid-19 shock is likely to be more temporary in nature and that strong policy support has limited the kind of scarring effects that persisted long after the Global Crisis (Figure 1).
Figure 1 Financial and Covid shocks are very different
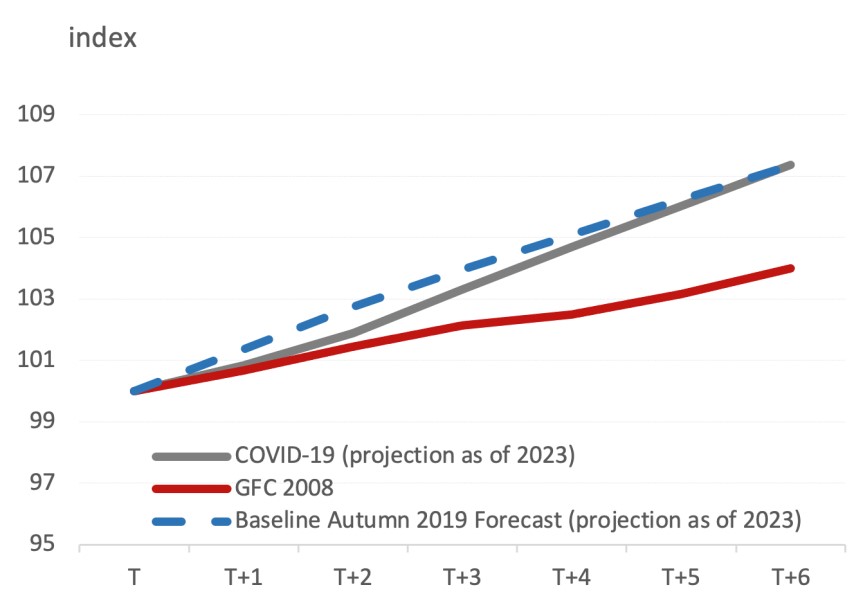
Source: European Commission
Estimation of output gaps and potential output in the face of crises
The EU’s Output Gap Working Group (OGWG) has been responsible, over the last 20 years, for the development of the EU’s Commonly Agreed Methodology for producing potential growth and output gap estimates (EUCAM). Given the complex dynamics of ever-evolving economic systems, EUCAM will always be ‘work in progress’. Indeed, over the two decades of its existence, the OGWG has been ‘learning by doing’, particularly when EUCAM was confronted with major economic shocks.
- Having overestimated potential substantially in the pre-2008 boom, the productivity and structural unemployment components of EUCAM were subsequently revised. More external oversight was introduced, with peer reviews by independent academic experts and systematic cross-checks against alternative methodologies (the ‘Plausibility Tool’).
- A decade later, criticism addressed at EUCAM and its role in the EU’s fiscal surveillance procedures focused on the plausibility of closing output gaps amid protracted low inflation (Brooke 2019, Tooze 2019). Following a careful weighing of the evidence (Buti and Carnot 2018, Buti et al. 2019), the methodology was left unchanged.
- Finally, Covid-19 necessitated a series of temporary adjustments to EUCAM to avoid excessive procyclicality in the potential output estimates (Thum-Thysen et al 2022). These adjustments ensured that almost all of the pandemic-related downturn in actual GDP went into the output gap estimates, reflecting the view that the ‘frozen’ capital and labour components of the EU’s supply-side capacity could emerge largely unscathed from the pandemic – as long as the policy response was sufficiently robust and the recovery was rapid.
The joint Commission-OGWG conference helps support the OGWG in its responsibility to review new analytical insights that could lead to improvements in EUCAM.
Covid-19 affects humans, not machines
Michael Burda (Humboldt University Berlin) stressed that the most significant impact of the crisis was on the labour part of the production function in terms of illness, labour hoarding, and search and matching effects. In the EU, reliance on labour hoarding was larger than in the US, resulting in labour productivity per person rising in the initial phase of the crisis in the US but temporarily falling in the EU. He also noted that mismatch and labour shortages are on the rise (currently more so in the US than in the EU), and that the Phillips curve model was especially challenged in the pandemic-context due to labour hoarding (since it does not account for unfilled vacancies and search-and-matching).
Post pandemic, total factor productivity will revert to its weak pre-pandemic trend
Nicholas Bloom (Stanford University) and Gregory Thwaites (Nottingham University) looked at productivity growth from the past, present and future perspectives. They argued that the secular decline of productivity growth in advanced economies is due to the fact that ‘ideas are getting harder to find’. Total factor productivity (TFP) growth rates have continued to decline despite a massive increase in research efforts in the US since the 1950s. Turning to the present, private sector TFP dropped by up to 4% during the pandemic, with a projected 1% aggregate TFP reduction over the medium term. ‘Within-firm’ productivity dropped sharply and is only partly offset by positive ‘between-firm’ effects, as less productive sectors, and less productive firms within those sectors, contracted. With respect to future productivity trends, despite changes induced by the crisis, such as working from home, their central scenario is that economies will return to their relatively weak pre-pandemic productivity patterns.
Transitory effects of Covid-19 on potential… though uncertainty remains
While all participants acknowledged that it was still too early to assess the full implications of the complex mix of pandemic-induced demand- and supply-side disruptions, an assessment of the latest evidence provided grounds for optimism. The message from the presentations from the European Commission (Anna Thum-Thysen), the OECD (Yvan Guillemette), the IMF (Allan Dizioli), and the ECB (Katalin Bodnar and Bela Szörfi) on the impact of Covid-19 was generally upbeat (Figure 2). Speakers suggested that the lasting impact of the pandemic on potential output, assuming ongoing policy support, was likely to be relatively limited and short-lived. Despite this optimism, all speakers stressed that downside risks needed to be closely monitored. Negative long-term implications of Covid-19 could still arise from adverse sectoral developments; the withdrawal of part of the labour force from the labour market; underinvestment and earlier obsolescence of physical capital; a wave of delayed bankruptcies; the negative effects of Covid-19 on human capital accumulation; as well as frictions in the reallocation of labour and capital.
Figure 2 Potential growth estimations in spring 2021
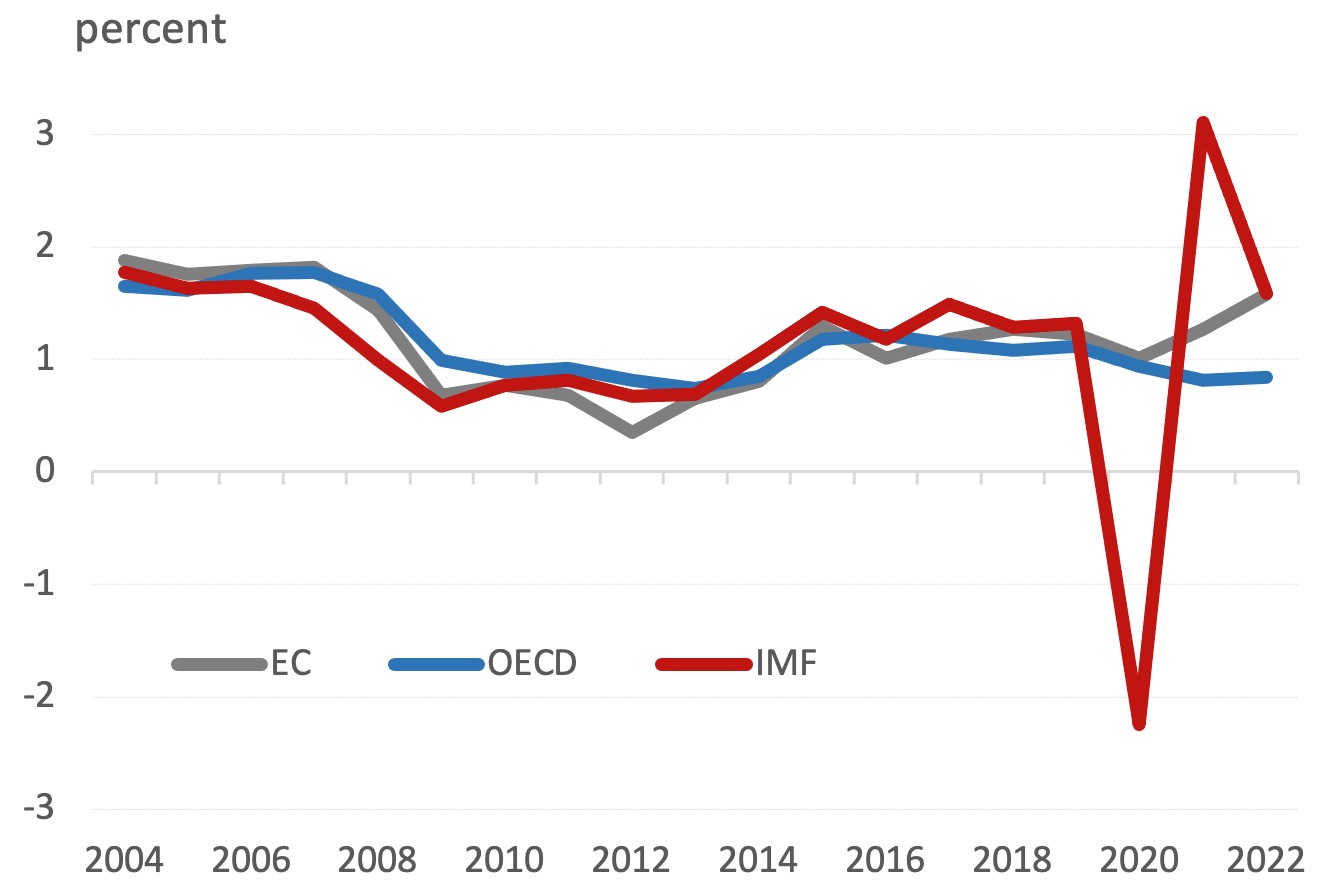
Source: European Commission European Economic Forecast, OECD Economic Outlook, IMF World Economic Outlook, Spring 2021 vintages
Avoiding hysteresis and the clogging up of reallocation channels
Ethan Ilzetzki (London School of Economics) argued that statistical trend/cycle decomposition methods track actual output too closely and thereby identify a loss of potential output when GDP slumps for a prolonged period. This can lead to misguided policy advice, in particular an insufficient demand boost from fiscal policies. Monetary and fiscal policies can and should lean against the risks of cyclical underemployment becoming structural (hysteresis) or a prolonged period of low demand affecting potential (scarring).
Atanas Hristov (DG ECFIN) proposed a possible improvement to the estimation of the ‘non-accelerating wage rate of unemployment’ (NAWRU). His model of the labour market takes into account changes to the labour input both at the extensive (employment) and the intensive (hours worked, effort) margins. First evidence suggests that this could outperform the existing EUCAM specification, in particular in combination with a proposed new labour hoarding indicator based on firm-level data (Hristov and Thum-Thysen 2022).
Finally, addressing uncertainty about the long term effects of Covid-19, Pilar Cuadrado (Bank of Spain) presented alternative estimates based on production function, sectoral, and statistical approaches. Although short-run estimates differed considerably across the three methodologies, all of the estimates involved a fast recovery of potential growth rates to close to pre-pandemic values, pointing to the absence of sizeable scarring effects on Spanish potential growth.
Developing more robust capital input data and exploiting the potential of Big Data
All trend/cycle decomposition exercises ultimately depend on the quality of the input data. For production function approaches, capital stock data are crucial. Robert Stehrer (WiiW) and Eurostat (J Cabeca, A Panizo Espuelas, Jenny Runessen, and Christine Gerstberger) reported on their efforts to improve the cross-country comparability of national accounts capital stock data and to compile and publish capital productivity and multifactor productivity indicators by the end of 2021.
Marco Ratto and Luca Onorante (JRC) presented the results of a project to ‘nowcast’ GDP in the context of the crisis. Their approach joins nowcasting techniques and timely available ‘big data’ (such as internet search terms and real-time mobility data) to gauge the crisis impact. They concluded that big data can be useful for analysing the economy both during the Covid-19 crisis and in more normal times. But analysts should cross-check the signal coming from a number of models and should carefully select data sources.
Price inflation may not be a good gauge of the output gap amid persistent demand shocks
Kieran McMorrow (DG ECFIN) discussed whether a co-movement or decoupling relationship should currently be expected between output gaps and inflation. He raised concerns about the trend/cycle decomposition methodology used by the ‘Campaign Against Nonsense Output Gaps’ (CANOO) (Brooks 2019), which postulates co-movement of output gaps and inflation. This approach disregards the possibility of trends in price inflation and fails to provide accurate signals in different cyclical circumstances.
Picking up on the ‘missing inflation puzzle’, Werner Roeger (DIW) looked at the relationship between the output gap and inflation in the presence of persistent demand shocks. He showed that a change in trend inflation can occur in a long-lasting liquidity trap or secular stagnation environment. This offers a plausible explanation as to why the euro area experienced a closing output gap with low inflation before the pandemic (Figure 3).
Figure 3 Unemployment and core inflation in the euro area
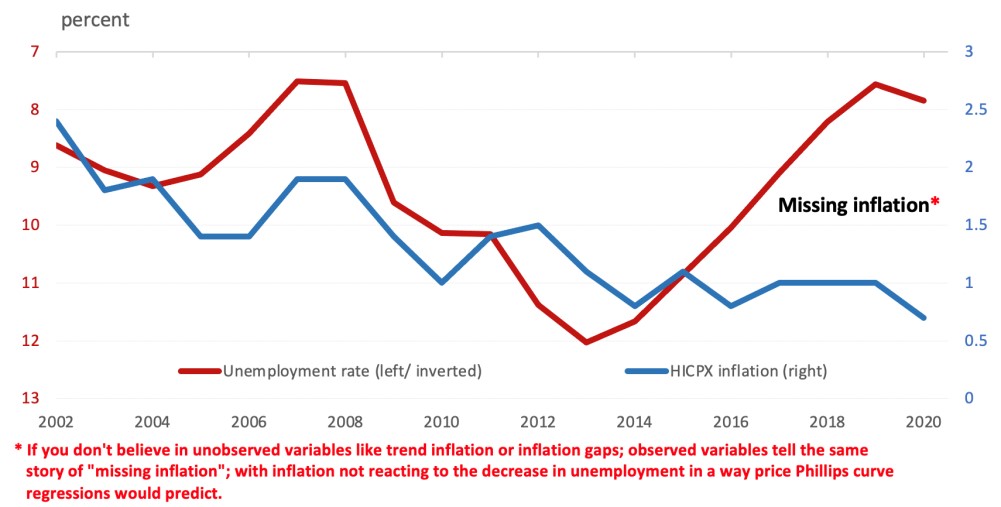
Note: HICPX is HICP inflation excluding energy and food and hence abstracting from large swings in oil prices and food commodity prices, respectively. Such a measure of HICP excluding food and energy can be interpreted as an ‘anchor indicator’ for inflation.
Source: Bobeica and Sokol (2019)
Andreas Zervas (Greek Ministry of Finance) explored the stability of the wage and price Phillips curves for the euro area. His results suggest a fall in the estimated effect of the business cycle variables (output or the unemployment gap) on inflation.
New approaches to output gap calculation could also help to reduce uncertainty
The concluding session was devoted to the exploration of alternative trend/cycle decomposition approaches. Fabio Canova (Norwegian Business School) investigated the properties of output gaps and of transitory fluctuations in a variety of DSGE models. He proposed a number of explanations for the distortions generated by popular statistical filters. He concluded that gaps were best approximated with a polynomial filter, and that a differencing approach should be adopted for transitory fluctuations.
Knut Aastveit (Norges Bank) went on to argue that a dynamic factor model can substantially reduce revisions of real-time output gap estimates for the US economy. A combination of forecasted and nowcasted data greatly reduces the end-of-sample imprecision in his gap estimate, with benefits for real-time policy advice.
Vasja Sivec (STATEC Lux) proposed to estimate the output gap with inequality constraints. This new method corrects the output gap when it is inconsistent with macroeconomic theory and leaves it unconstrained otherwise. Using a vintage dataset from 2004 to 2021, he showed that the new output gap estimates are better correlated with selected cyclical macroeconomic variables; revisions are smaller; and forecasting power increases.
13 dicembre 2021
DEBORA REVOLTELLA, JULIE DELANOTE, TESSA BENDING
EU firms and the COVID crisis: So far so good, but uncertainty, lack of skills, and pockets of vulnerability remain
(synthesis; full article – Vox Eu CEPR 03 December 2021 https://voxeu.org/article/eu-firms-and-covid-crisis)
Abstract: The European economic policy response to the COVID-19 pandemic has ensured business continuity and shielded investment, but digital and green transitions are now ever more urgent. This column uses data on 12,000 European firms from the European Investment Bank Investment Survey to show that the pandemic spurred many firms to start accelerating transformation efforts. Policy should seek to support this momentum amid post-pandemic economic recovery..
Keywords: COVID-19 impact, European economy, Policy support, European firms, Investments
The year 2021 was one in which many policymakers and economists breathed a sigh of relief. The pandemic is not over, but the worst of the economic fallout in advanced economies certainly seems to be. A significant rise in unemployment was avoided, thus mitigating fears that the crisis would have a large-scale scarring effect (Portes 2020, IMF 2021). Investment was relatively resilient and corporate bankruptcy rates even fell slightly.
Credit for these outcomes largely lies with the strength of the policy support deployed to keep businesses operating and prevent ripple effects through the economy and financial systems, as well as the sharp rebound in demand that comes with the lifting of lockdown measures (Djankov and Zhang 2021).
The question remains, however, of how much these measures will have enabled firms to adjust to the emerging ‘new normal’ or how much they may have merely delayed problems, including by keeping resources tied up in what might otherwise be ‘zombie firms’.
Even with massive policy support, the impact of COVID-19 on the European economy was severe
The European Investment Bank Investment Survey (EIBIS)1 data reveal some of the impacts of what was a massive shock, albeit one felt asymmetrically across sectors and geographies. Some 49% of EU firms suffered a drop in sales due to the pandemic, compared to 21% with increased sales. Low (pre-crisis) productivity was a strong predictor of lost sales, and more digitally advanced firms proved to be slightly more resilient.
Meanwhile, divergent effects by firms size and sector may fuel a degree of asymmetry across countries: compared with the pre-pandemic norm, the number of loss-making firms tripled in the hotels, restaurants, arts and recreation sectors, and doubled among transport firms, but other sectors were less affected.
Small firms suffered a significant loss of sales (down at least 25%) more often than medium-sized and large firms; in the manufacturing sector, they were three times more likely to do so. Small and micro firms across sectors were also twice as likely to enter insolvency.
Impacted firms also delayed investment, to an extent. In 2020, the number of firms carrying out investment declined from 86% to 79%. Faced with declining sales, 23% of firms revised future investment plans downward, with only 3% planning to invest more. The greater the loss of sales in 2020, the less likely firms were to plan to invest more in the coming year than in the last.
Unsurprisingly, therefore, the process of transformation to a smarter and greener economy also slowed. The uptake of advanced digital technologies did not progress overall in 2020-2021, remaining constant at around 61% of EU firms. Meanwhile, COVID-19 seems to have led some firms to delay climate-related investment, with the share of firms carrying out investment to adapt to extreme weather events and to reduce carbon emissions decreasing slightly in 2021, from 45% to 43%.
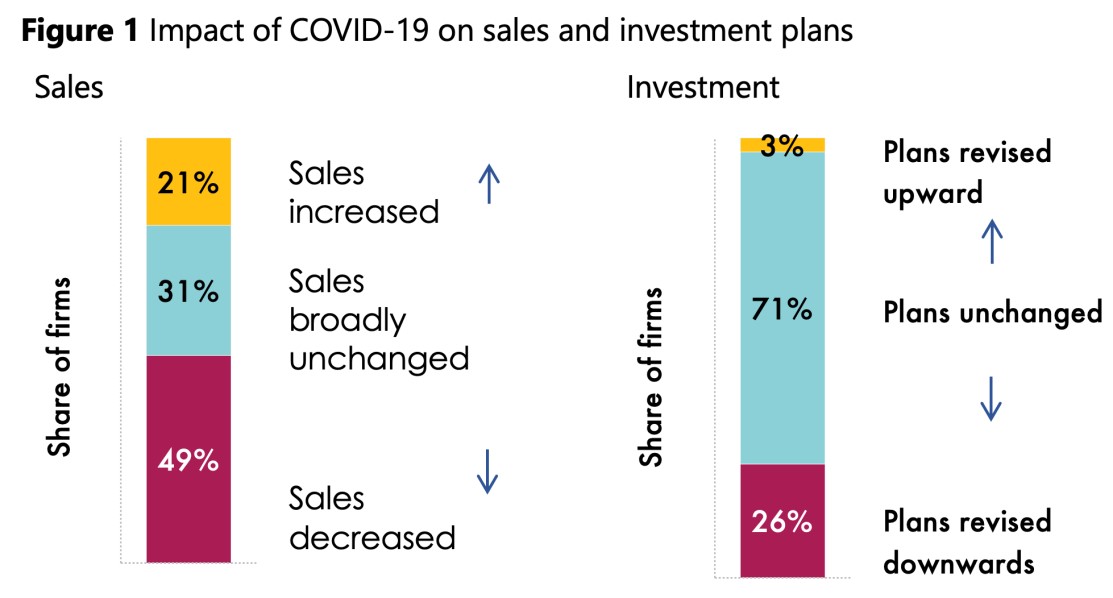
Source: EIB Investment Survey 2021.
Policy support was lifesaving and helped to shield investment
Across the EU economy, some 56% of firms received some kind of policy support in the form of guaranteed credit, support for social security contributions, or delayed payments. According to the more detailed EIBIS Add-On Module, as many as 35% of European small and medium-sized enterprises (SMEs) in manufacturing and services would have faced an existential threat without the support they received. Moreover, the support was not indiscriminate but successfully directed towards firms that were more in need, being skewed towards firms facing a greater loss of revenue.
Where firms received some kind of policy support, the link between lost revenue and downgraded investment plans was significantly weaker: firms that received support were more likely to preserve their investment programmes. Investment in training also proved relatively stable, with European policy measures focused on allowing employees to remain in their jobs, although arguably it was not enough to keep pace with growing needs.
Looking forward, however, the pandemic has heightened the need for transformation…
The majority of European firms may have survived the pandemic relatively unscathed, but now they have to come to terms with a changed landscape. Just over a quarter of EU firms believe their pandemic will have a lasting effect on their supply chains, and 23% see a future impact on the product mix they need to offer, underlining the need for innovation.
Another indicator that the cyclical rebound in activity is exacerbating supply-side constraints comes from firms’ views on obstacles to investment. Recovery has brought a marked uptick in firms seeing skills availability, energy costs, and transport infrastructure as constraints, while the impact of uncertainty has eased.
Meanwhile, the issue of digitalisation has come to the fore: 55% of firms see a greater need for digitalisation as a long-term result of the pandemic. The number of firms seeing digital infrastructure as a constraint to investment decisions has edged upwards to 45%.
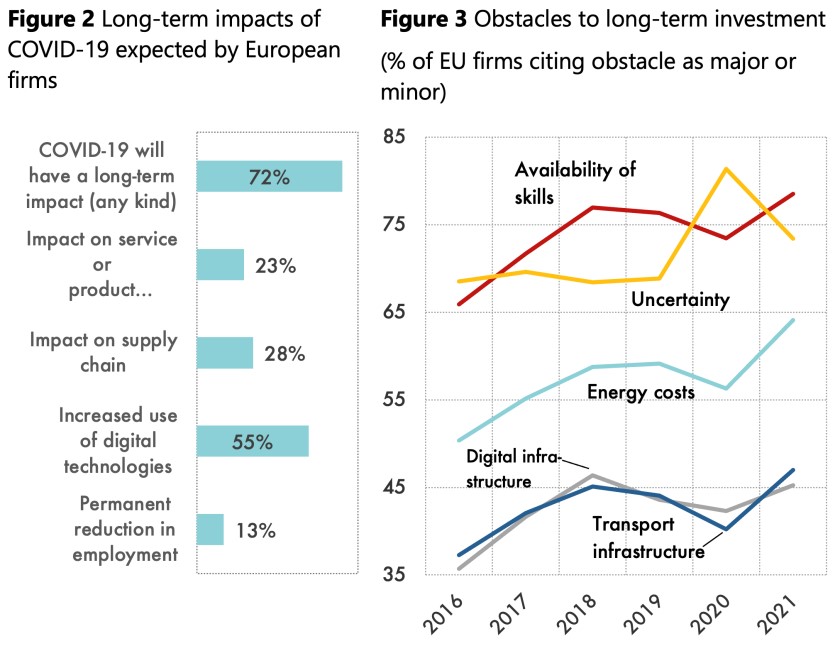
Source: EIB Investment Survey 2021.
…and firms are waking up to the urgency of the climate transition
Around 58% of EU firms see themselves as affected by physical climate-change risks. More do so in regions that have experienced weather extremes. EU firms are also starting to internalise the risks associated with the transition to net-zero. This is particularly the case in ‘brown’ sectors (where risks are mostly seen on the downside) and in ‘green’ sectors (where firms are more likely to perceive opportunities).
The internalisation of climate-related risks is likely to increase rapidly, with growing obligations for firms to report on emissions and for the financial sector to report on portfolio risk exposure.
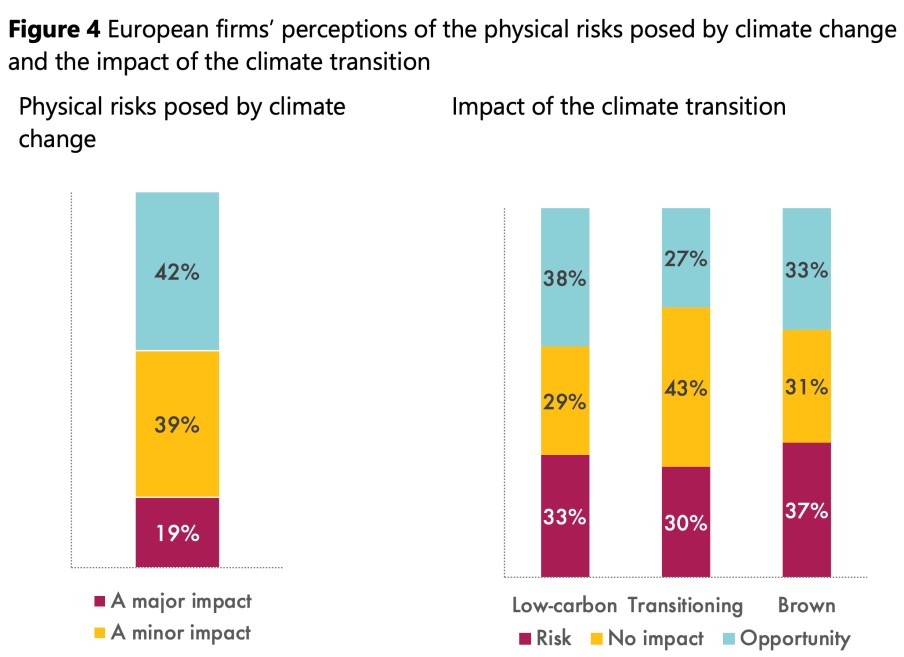
Source: EIB Investment Survey 2021.
The good news is that the pandemic has spurred many firms to start accelerating transformation efforts
According to the EIBIS Add-On Module, 30% of European manufacturing and service-sector SMEs say they have used the crisis as an opportunity to accelerate planned transformation. Some 46% of EU firms say they have become more digital, and among firms that do not yet use advanced digital technologies, 34% took the crisis as an opportunity to start their digitalisation journey.
There is also some evidence that many firms facing significant lost sales invested more in developing or introducing new products compared to firms facing no change in sales. Of course, it is hard to say whether these efforts will be enough to counter the challenges facing firms. It also raises questions about how many firms were unable, or unwilling, to accelerate changes in the face of a changing landscape, and how these are distributed across regions and sectors. Nonetheless, it is positive that a large share of EU firms were able to respond in this way.
Also with regard to the climate transition, efforts have picked up again in 2021 and EU leadership on climate show signs of paying off. The share of firms planning climate-related investment has now risen from 41% to 47%, after delays in 2020. In the US on the other hand, only 28% of firms have already invested and only 40% are planning climate-related investment.
The regulatory push for accountability on carbon emissions and exposure to climate risk appears to be having an effect, with 46% of EU firms using monitoring targets for carbon emissions and energy consumption, a factor that is associated with investment. Firms are more likely to invest when they perceive an opportunity in the climate transition; by contrast, exposure to negative risks appears not yet to be fully internalised or priced-in.
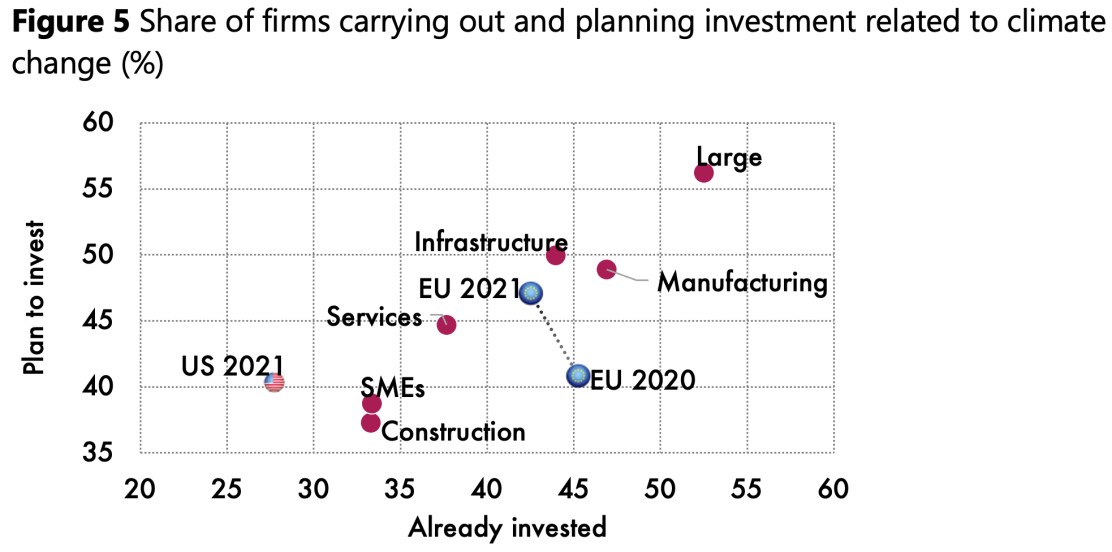
Source: EIB Investment Survey 2021.
Amid the easing of economic conditions, policy needs to focus on keeping up and accelerating the momentum for transformative investment
With the recovery beating expectations and market conditions easing, European firms expect to increase investment this year. On balance, they are also optimistic about investment conditions in the coming year, with EIBIS sentiment indicators for the economic climate and internal finance availability switching back to positive as the recovery is felt.
While there is still uncertainty about the extent of lasting damage to corporate balance sheets, policy support does appear to have averted the threat of widespread scarring. It has meant that the share of finance-constrained firms has remained limited (6% of SMEs and 3% of large firms).
Nonetheless, concerns remain about potential pockets of instability, including severely affected firms in specific sectors and regions. In Southern Europe, for example, the share of firms happy to rely on internal finance has nearly halved.
Therefore, there is likely to be an increasing need for well-targeted support. Targeted financial incentives have proved very relevant in promoting transformative investment, both with regard to climate and digitalisation. European firms that received such incentives for digitalisation in the last three years were almost twice as likely to invest more in digitalisation as a response to the pandemic.
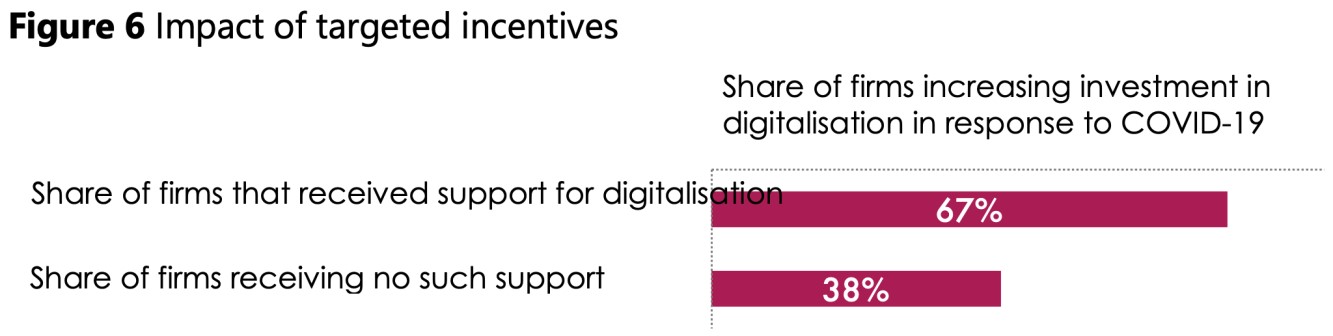
Source: EIB Investment Survey 2021, Add-On Module.
It is also critical to keep a focus on non-financial barriers to transformative investment. The scarcity of workers with the right skills persists as a top barrier to long-term investment, a factor cited by 79% of European firms. Infrastructure also matters, with access to digital and transport infrastructure, as well as energy costs, all rising as constraints on investment in Europe.
With regard to climate-related investment, uncertainty about the regulatory environment and taxation are reported to be the main barriers. Firms name the setting out of a clear decarbonisation pathway, advice on financial support, and technical support as interventions that would most help to advance such investment.
The main barriers to investment in digital technologies are the cost of investment activities and availability of staff with the right skills to identify and implement the investment. Firms name technical support, advice on funding, and regulatory consistency across Europe as interventions that would best support digitalisation.
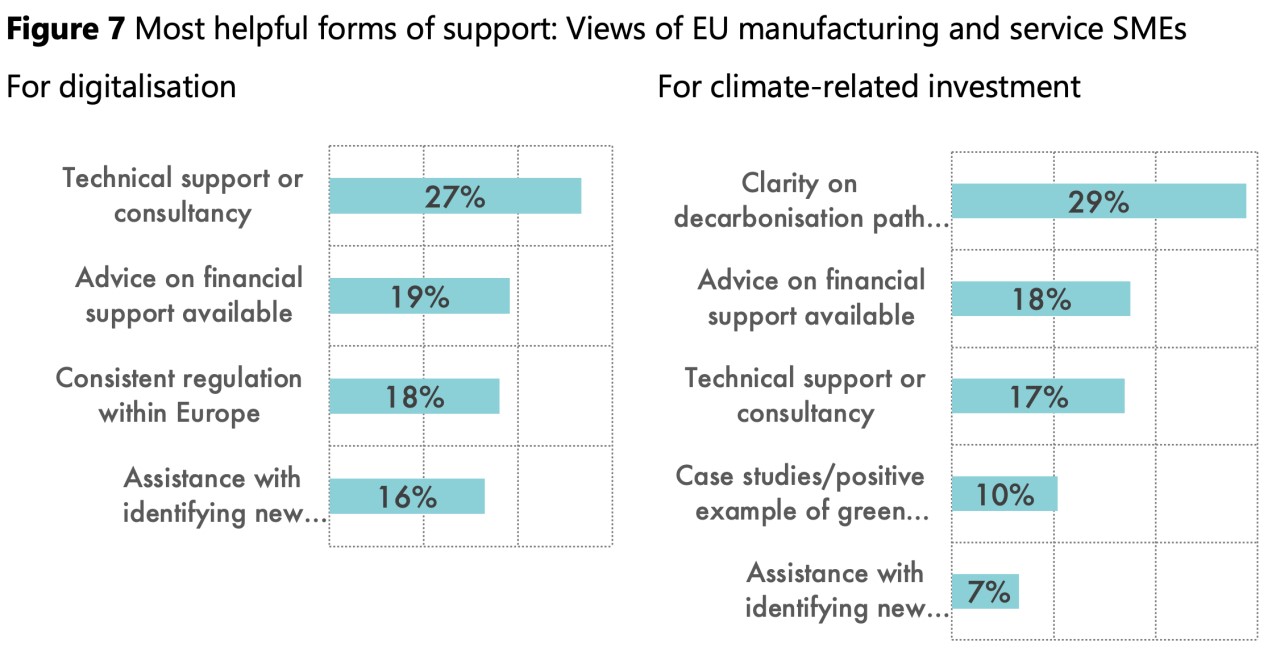
Source: EIB Investment Survey 2021, Add-On Module.
References
International Monetary Fund (2021), Regional economic outlook for Europe, October 2021.
Djankov, S, E (Y) Zhang (2021), “As COVID rages, bankruptcy cases fall”, VoxEU.org, 4 February.
Portes, J (2020), “The lasting scars of the Covid-19 crisis: Channels and impacts”, VoxEU.org, 1 June.
Endnotes
1 The European Investment Bank Investment Survey (EIBIS) is a survey of 12,000 firms in the EU, with representative comparator samples of 800 firms in the US and 600 in the UK, administered by the EIB Economics Department. The EIBIS 2021 Add-On Module covers SMEs in manufacturing and services to gain further insights on COVID-19 impacts, digitalisation and climate-related investment, barriers to investment and policy support. Unless otherwise stated data is from the EIBIS main module.
6 dicembre 2021
MAARTEN VERWEY, ALLEN MONKS
The EU economy after COVID-19: Implications for economic governance
(synthesis; full article – Vox Eu CEPR 21 October 2021 https://voxeu.org/article/eu-economy-after-covid-19-implications-economic-governance)
Abstract: On 19 October 2021, the European Commission adopted a Communication relaunching the public consultation on the EU’s economic governance framework. This consultation had been put on hold in March 2020 in order to focus on the Covid-19 pandemic. The Commission communication assesses the implications of the changed circumstances for economic governance following the COVID-19 crisis and sets out additional questions for the public debate. All stakeholders are invited to engage in the debate, which must be wide-ranging and inclusive to build a consensus on the way forward well in time for 2023.
Keywords: COVID-19 pandemic, economic contraction, global financial crisis, monetary policy measures, EU RRF.
The COVID-19 pandemic resulted in an unprecedented economic contraction in 2020, with EU real GDP falling by 6.1%, more than during the global financial crisis. The EU response to the crisis was fast, forceful, and well-coordinated at all levels. EU Member States – backed by the EU SURE instrument (Figure 1) – provided strong support to business and workers, notably through short-time work schemes, in addition to substantial liquidity support to firms.
The ECB complemented the fiscal response with a broad set of monetary policy measures. This joint and coordinated policy response was successful: the economic impact of the crisis on workers and firms has been far less severe than originally anticipated.
Decisive EU-level action also ensured the development, speedy procurement and coordinated distribution of COVID-19 vaccines. Looking forward, the newly created EU Recovery and Resilience Facility (RRF) will promote an investment-rich recovery and growth-enhancing reforms by providing €338 billion in non-repayable support and up to €386 billion in loans (in current prices) throughout the period to 2026. The impact will be seen already in 2021 (Figure 2).
Figure 1 Increase in unemployment rate in SURE beneficiary Member States, 2020 (percentage points)
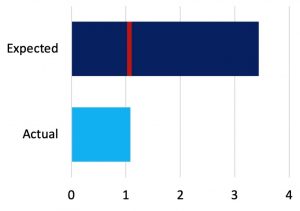
Source: European Commission calculations
Note: The expected increase in the unemployment rate reflects the historical relationship between changes in that rate and (negative) GDP growth
Figure 2 Expenditure financed by RRF grants, 2021 and 2022 (% of GDP)
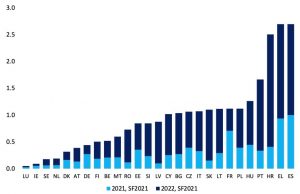
Source: European Commission 2021 spring forecast
The recovery has taken hold but significant challenges remain
Thanks to strong policy support, accelerated vaccine rollout and, where possible, the gradual easing of pandemic-related restrictions, growth resumed forcefully in the EU in spring 2021. Recent data suggest that economic activity will remain strong for the quarters to come, though uncertainty remains high.
Despite the favourable short-term outlook, long-term structural challenges remain. Some of these pre-date the pandemic: the impacts of population ageing, weak productivity growth, and accelerating climate change. Rising income and wealth inequality, territorial disparities within and among Member States, and unequal access to education and skills were holding back economic growth and creating strain on the EU’s social fabric. The pandemic has made many of these challenges more pressing and added others:
- Public finances have taken a considerable hit and fiscal divergence between Member States has increased. Deficit and debt ratios have soared in all Member States (Figure 3). High debt ratios are expected to persist, remaining above pre-pandemic levels over the next decade (Figure 4).
- Investment needs are pressing. The additional investment needed to achieve our climate and digital goals amounts to €650 billion per year over the next decade (public and private combined).
- The COVID-19 crisis has aggravated a number of pre-existing vulnerabilities. Internal imbalances related to high government and private debt have increased, driven by the recession and measures taken to address the COVID-19 crisis. Pre-pandemic dynamic house price trends persisted and mortgage debt continued to grow significantly in some countries. Current account deficits widened in countries dependent on tourism revenues and the correction of current account surpluses has stalled. Moving forward, new risks may emerge as a result of structural transformations accelerated by the COVID-19 crisis.
- The challenge of boosting socioeconomic resilience has become more apparent.Less-resilient Member States, territories and sectors found it harder to withstand and respond to the crisis. Differences in resilience across the EU have a bearing on social, economic and territorial cohesion, as well as convergence within the euro area and the effectiveness of the single monetary policy.
Addressing these challenges offers transformative opportunities but requires major investment and reforms. The €2 trillion firepower of the new Multi-annual Financial Framework and Next Generation EU, in particular the RRF, will support the recovery, while making our economies and societies more resilient. Good policies are also needed to strengthen resilience: effective and well-designed active labour market policies and social protection systems; investment in education and skills; and sound public finances.
Figure 3 Public finance impact of the global financial and COVID-19 crises in the EU, 2009 and 2020 (year-on-year change, percentage points of GDP)
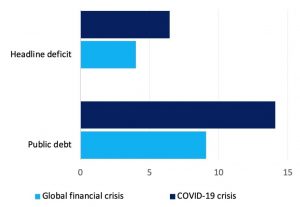
Source: European Commission 2021 spring forecast
Figure 4 Public debt in the EU, 2006-2031 (% of GDP)
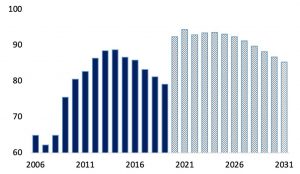
Source: European Commission 2021 spring forecast
Lessons from the crisis must be drawn for the economic governance review
The EU governance framework should be tailored to the challenges the EU is facing, as set out above. The COVID-19 crisis has underlined the challenges facing the economic governance framework, making those identified in our February 2020 Communication even more relevant. Our latest Communication1 does not seek to offer a roadmap for reform of the governance framework nor pre-empt the outcome of the public debate.
… for the EU fiscal rules …
A number of key elements can be identified regarding the EU fiscal rules:
- Reducing high and divergent public debt ratios in a sustainable, growth-friendly manner will be a key post-crisis challenge.When economic conditions allow, resuming a path of reducing public debt-to-GDP ratios will be essential for maintaining sound public finances and avoiding persistent fiscal divergences between Member States. At the same time, an overly large upfront reduction in debt ratios would entail high social and economic costs and be counterproductive.
- The stabilisation role of coordinated discretionary fiscal policy has proved to be crucial in the COVID-19 crisis.The crisis has highlighted the positive role that counter-cyclical discretionary fiscal policy and European coordination can play in responding to large economic shocks and containing their social fallout. However, the ability to provide fiscal stimulus in bad times requires building fiscal buffers in good times. Reinforcing counter-cyclicality in the EU fiscal framework could strengthen the medium-term dimension of fiscal policy and thus the ability of national fiscal policy to respond to economic fluctuations.
- A growth-friendly composition of public finances should promote investment and support sustained, sustainable and inclusive growth.Reflection is needed on the appropriate role of the economic governance framework to incentivise national investment and reforms. Promoting green, digital and resilience-enhancing public investment deserves special attention, given the long-term challenges facing our economy.
- Achieving the overarching goals of simplification, stronger national ownership and better enforcement remains highly relevant.This calls for simpler fiscal rules using observable indicators for measuring compliance. It also includes considering whether a clear focus on ‘gross policy errors’, as set out in the Treaty, could contribute to a more effective implementation. A simpler framework would contribute to increased ownership, better communication, and lower political costs for enforcement and compliance.
- Strong national fiscal frameworks can contribute to an effective economic governance framework. A possible strengthening of their roles and alignment with best practices across Member States are worth considering. This could go hand-in-hand with a refocusing on gross policy errors in the enforcement of EU fiscal rules.
…and the Macroeconomic Imbalance Procedure (MIP)
Returning to a path of convergence between Member States is essential. Preventing and correcting macroeconomic imbalances enhances Member States’ ability to respond to shocks and supports economic convergence. A well-functioning MIP can help identify the build-up of imbalances in a timely manner so that they can be addressed early on. The MIP can also support policy coordination, as experienced in the swift and aligned response of Member States to the COVID-19 crisis. Many Member States have reduced the severity of imbalances over time and significant policy action has been taken in the context of Member States’ Recovery and Resilience Plans, but the persistence of imbalances in some cases warrants further reflection on how the implementation and design of the MIP could be improved. Multiple surveillance streams partially overlap but the links have not always been fully exploited. MIP surveillance may also have insufficiently taken account of interactions between emerging economic challenges, notably related to climate change and other environmental pressures.
Lessons from the Recovery and Resilience Facility
Insights gained from the functioning of the RRF framework could also be relevant for the broader economic governance of the Union. This framework has involved constructive and intense policy dialogues between the Commission and Member States, leading to improved mutual understanding of challenges, while building trust and ownership. It is underpinned by a transparent assessment and monitoring framework. In the fiscal domain, where the objective of achieving prudent public debt levels remains fundamental, the trade-off between various objectives would need to be addressed at the planning stage, thus avoiding recurrent renegotiation of adjustment paths.
Relaunching the review
A wide-ranging and inclusive engagement with all stakeholders is necessary to build a broad-based consensus. The nine questions guiding the public debate that were included in our February 2020 Communication have been complemented by two additional questions, while one question has been slightly reformulated, as follows:
- New question: In what respects can the design, governance and operation of the RRF provide useful insights in terms of economic governance through improved ownership, mutual trust, enforcement and interplay between the economic and fiscal dimensions?
- New question: Considering how the COVID-19 crisis has reshaped our economies, are there any other challenges that the economic governance framework should factor in beyond those identified so far?
- Reformulated question: In light of the wide-ranging impact of the COVID-19 crisis and the new temporary policy tools that have been launched in response to it, how can the framework – including the Stability and Growth Pact, the Macroeconomic Imbalances Procedure and, more broadly, the European Semester – best ensure an adequate and coordinated policy response at the EU and national levels?
We are looking forward to your contributions to the debate. The online survey has been relaunched and citizens, organisations and public authorities are invited to submit their contributions by 31 December 2021.
22 novembre 2021
PHILIP BUNN, DAVID E. ALTIG, LENA ANAYI, JOSE MARIA BARRERO, NICHOLAS BLOOM, STEVEN DAVIS, BRENT MEYER, EMIL MIHAYLOV, PAUL MIZEN, GREGORY THWAITES
COVID-19 uncertainty: A tale of two tails
(synthesis; full article – Vox Eu CEPR 16 November 2021https://voxeu.org/article/covid-19-uncertainty-tale-two-tails)
Abstract: The onset of the COVID-19 pandemic triggered a massive spike in uncertainty. This column uses data from panel surveys of US and UK business executives to document how uncertainty over own-firm sales growth rates over the year ahead roughly doubled in reaction to the shock. Firm-level uncertainty receded after spring 2020 but remains much higher than pre-COVID levels. The nature of this uncertainty has shifted greatly since the pandemic struck, from an enormous widening in perceived downside risk to a sharp increase in upside risk. Economic uncertainty associated with the pandemic has morphed from a tale of the lower tail into a tale about the upper tail.
Keywords: COVID-19 Pandemic, Business Uncertainty, Firms Uncertainty, Job Reallocation, Growth Rates
The onset of the COVID-19 pandemic triggered a massive spike in uncertainty (Baker et al. 2020) and a large increase in job reallocation (Anayi et al. 2021). Uncertainty eased coming out of the crisis in spring 2020, but it remained elevated relative to pre-COVID levels as measured by surveys of business leaders in the US and UK (Altig et al. 2020a, 2020b). Moreover, the nature of firm-level uncertainty has shifted markedly since the early months of the pandemic, from an enormous widening in perceived downside risk to a sharp increase in upside risk. In short, business executives went from worrying about how bad COVID might get to wondering about how strongly they might bounce back.
We run two panel surveys that elicit firm-level growth forecasts from business executives. The Survey of Business Uncertainty, fielded by the Atlanta Federal Reserve Bank in cooperation with the University of Chicago and Stanford University, yields responses for about 500 firms per month in the US. The Decision Maker Panel – run by the Bank of England, University of Nottingham, and Stanford University – yields responses for about 3,000 firms per month in the UK. The vast majority of respondents are CEOs, CFOs, business owners or serve in other senior management roles. The brevity of our survey instrument and the involvement of central banks and leading universities help generate high response rates of about 60% for regular panel members.
Each month, the surveys ask executives about sales growth at their firms over the past year and for sales forecasts over the next year. Importantly, the forecast questions ask about the lowest, low, medium, high and highest sales growth scenarios and the probabilities of each scenario. Thus, for each firm, the surveys yield a 5-point subjective forecast distribution of sales growth rates over the next year.
Firm-level uncertainty and how it evolves after the COVID-19 shock
Using the survey responses, we measure a firm’s subjective uncertainty as the standard deviation of its forecast distribution over its own sales growth rate. We then compute the activity-weighted mean of subjective uncertainty across firms by month. Figure 1 shows the resulting (average) subjective uncertainty measure, which quantifies the perceived level of uncertainty about firm-level sales growth outlooks over the next year.
Figure 1 Subjective uncertainty about firm-level sales growth rates over the next four quarters
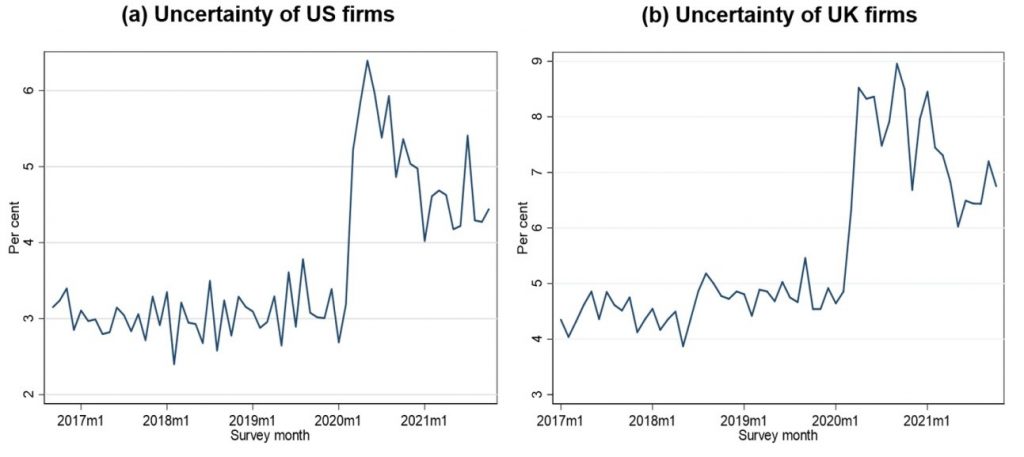
Notes: Subjective uncertainty about the growth rate of sales at a four-quarter look-ahead horizon. US and UK data through October 2021. See Altig et al (2020a) for more details. Data available at www.atlantafed.org/research/surveys/business-uncertainty and www.decisionmakerpanel.com.
In Altig et al. (2020a, 2020b), we discuss the evolution of these and other uncertainty measures in the early wake of the pandemic. Here, we consider how firm-level uncertainty has evolved as the US, UK, and global economies have recovered. Recent columns by Coibion et al. (2021) and den Haan et al. (2021) discuss the potential implications of economic uncertainty for household spending and the labour market.
The COVID-19 shock pushed average uncertainty among US firms from about 3% before the pandemic to 6.4% in May 2021. Uncertainty fell back to about 4.5% in October 2021. Data for UK firms tell a similar story: firm-level uncertainty rose from about 4.9% before the pandemic to 8.5% in April 2021 and has since declined to about 6.8%.
Pre-pandemic uncertainty is higher in the UK for two reasons. First, the Brexit process elevated UK uncertainty (Bloom et al. 2019). Second, UK firms tend to be smaller, and smaller firms are typically more uncertain about future growth (Altig et al. 2020c).
A tale of two tails
We now consider the cross-firm distribution of realised sales growth rates and the cross-firm average subjective forecast distribution. These statistics throw new light on the nature of the COVID-19 shock, COVID-19-induced economic uncertainty, and how uncertainty has changed over time.
The US distribution of realised growth rates widened greatly in the wake of the pandemic, as shown in Figure 2, panel (a). Initially, the widening occurred mostly in the lower half of the distribution. For example, the 10th percentile of realised growth rates fell from about -5% in late 2019 to a trough of -35% in May 2020. The 25th percentile shows the same pattern in somewhat muted form.
In contrast, growth rates at the 75th and 90th percentiles fell by about 3 percentage points from late 2019 to May 2020. By the summer of 2021, however, the lower tail of the realised growth rate distribution had recovered to pre-pandemic values, while growth rates at the 75th and 90th percentiles had greatly surpassed their pre-pandemic values.
Figure 2 US distributions of past and future firm-level sales growth rates
- a) Realised growth rates
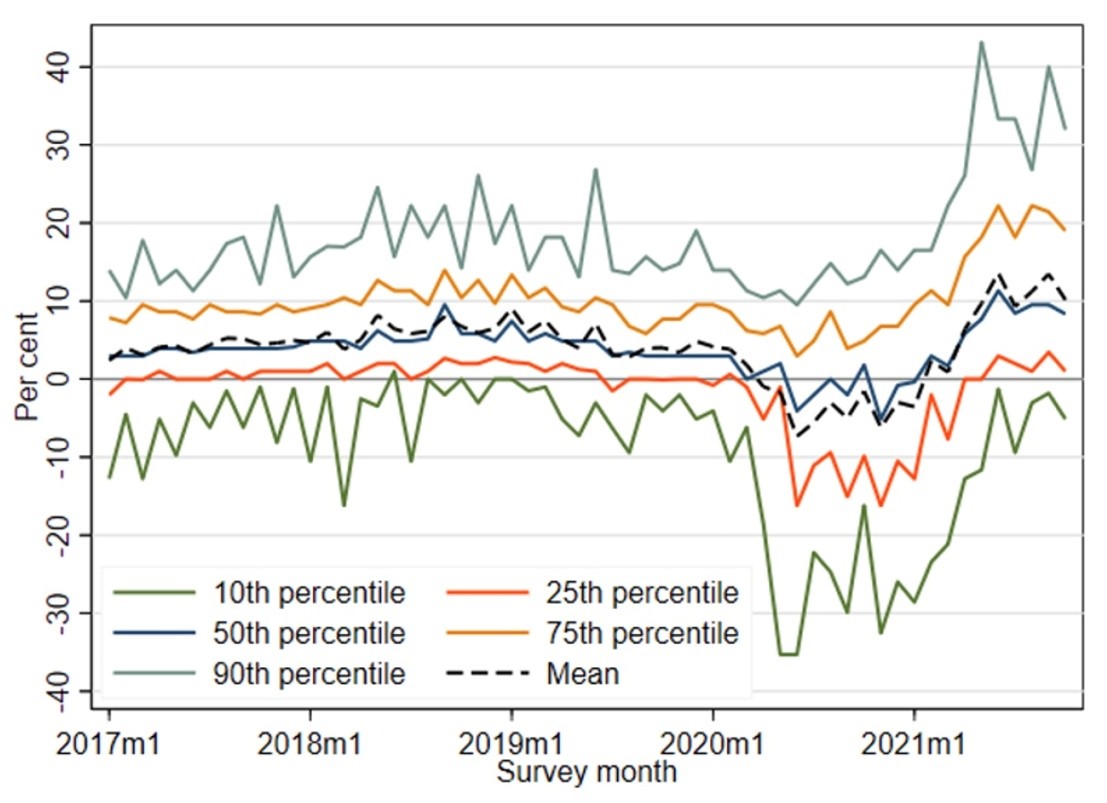
Notes: Calculated using monthly data through October 2021. This is a plot of the activity-weighted distribution of firm-level sales growth rates over the past year.
- b) Forecast distribution of growth rates
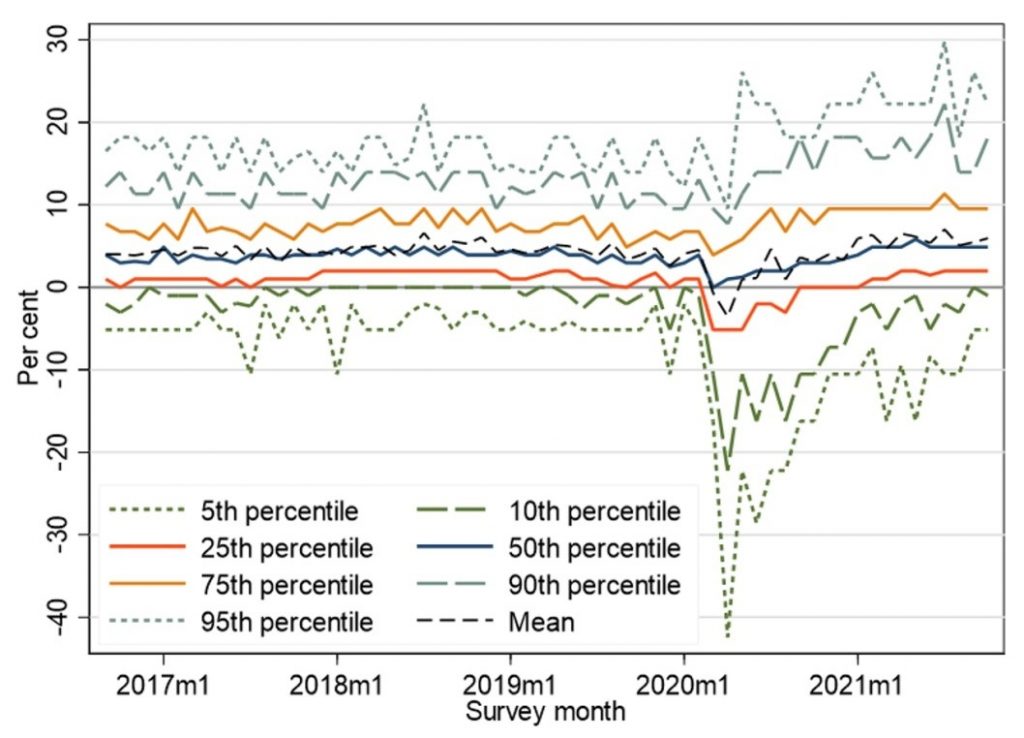
Notes: Calculated using monthly data through October 2021. This is a plot of the subjective distribution for the representative firm’s future sales growth rates over a 4-quarter look-ahead horizon. To calculate this distribution, we pool over all firm-level subjective forecast distributions in the indicated month and weight each firm by its activity level. Then we use the probabilities assigned to each possible future sales growth rate to obtain activity-weighted quantiles of the future sales growth rate distribution.
Source: Survey of Business Uncertainty at www.atlantafed.org/research/surveys/business-uncertainty
The average subjective forecast distribution over firm-level growth rates in the year ahead shows a similar pattern, as seen in panel b of Figure 2. To calculate this distribution, we pool all firm-level subjective forecast distributions in a given month and weight each firm by its activity level. The figure thus captures both average uncertainty in sales growth-rate forecasts at the firm level and whether that uncertainty is mainly to the upside, mainly to the downside, or evenly balanced between the two.
When the pandemic took hold in March 2020, firms perceived a large increase in downside uncertainty, placing much greater weight on the possibility of highly negative growth rates. While the 90th and 75th percentiles of the forecast distribution changed little, the median fell by about 5 percentage points and the 25th and 10th percentiles fell by 20 and 40 percentage points, respectively. In short, the average firm saw dramatically more downside risk in year-ahead sales growth rates during the early months of the pandemic.
As the pandemic continued, downside risks abated greatly. By early 2021, the forecast distribution remained highly dispersed (i.e. subjective uncertainty remained high), but it increasingly reflected upside rather than downside risk. In recent months, firm-level subjective uncertainty is mainly about prospects for rapid sales growth over the coming year and only secondarily about the possibility of sharp contractions.
Data for UK firms tell a similar story, as shown in Figure 3. The lower tail in the distribution of realised sales growth rates fell tremendously by the second quarter of 2020 in reaction to the pandemic and national lockdown (panel a). It fell again after the second national lockdown in early 2021. UK firms also perceived huge downside risk at the outset of the pandemic, as evidenced by the large downward shift in the lower tail of the forecast distribution (panel b).
As the economy began to recover, perceived uncertainty shifted from the lower tail to the upper tail. That is, firms placed less weight on the possibility of dramatic declines and more weight on the possibility of rapid growth. By summer 2021, downside uncertainty among UK firms had returned to pre-pandemic levels. Upside uncertainty remains highly elevated.
Figure 3 UK distributions of past and future firm-level sales growth rates
- a) Realised growth rates
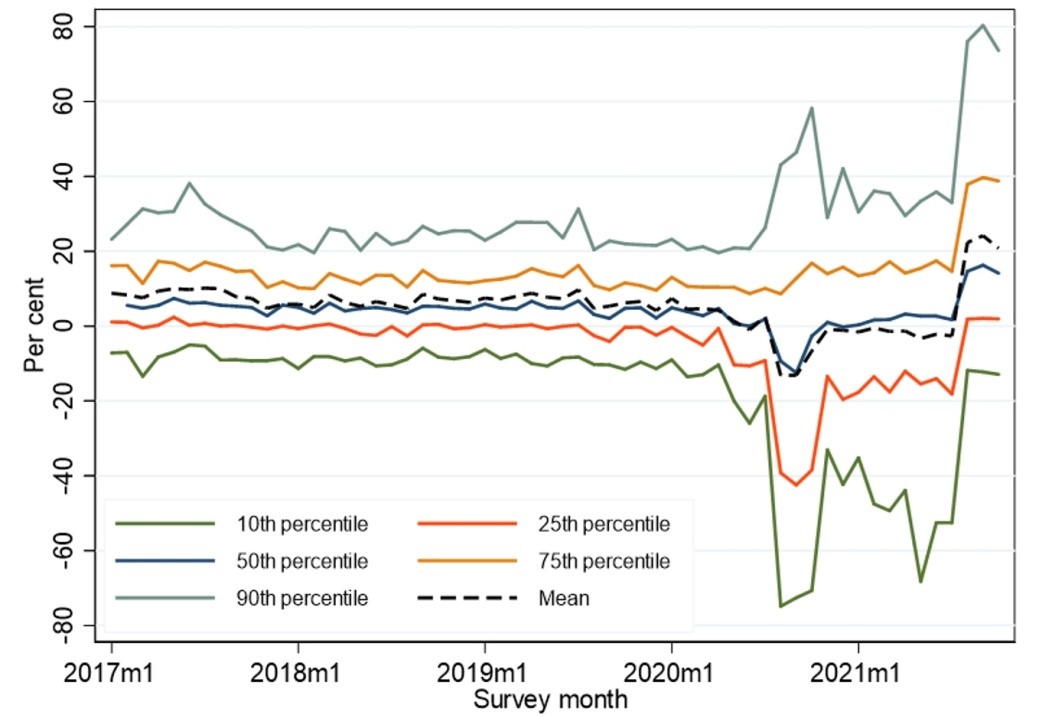
Notes: Calculated using monthly data through October 2021. The results are based on the question: ‘Looking back over the year from first/second/third/fourth quarter of this year, by what % amount has your sales revenue changed since the same quarter a year ago?’ Monthly data collected between May and July refer to Q1 of that year, data collected between August and October refer to Q2, data collected between November and the following January refer to Q3 and data collected between February and April refer to Q4 of the previous year.
- b) Forecast distribution of growth rates
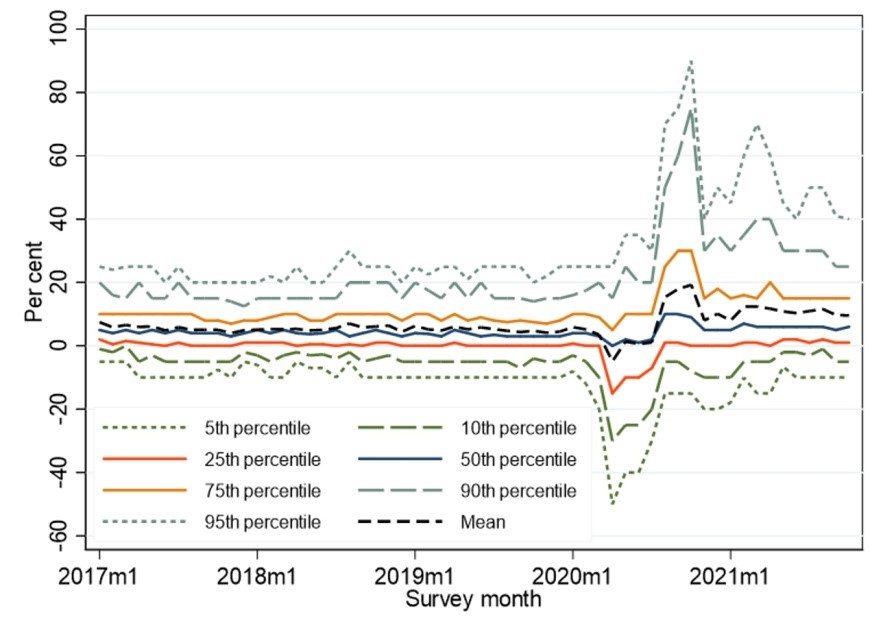
Notes: Calculated using monthly data through October 2021. The results are based on the question: ‘Looking a year ahead from the first/second/third/fourth quarter of this year to the first/second/third/fourth quarter of next year, by what percentage do you expect your sales revenue to have changed in each of the following scenarios: lowest, low, middle, high and highest?’ Respondents were then asked to assign a probability to each scenario. The five scenarios for each firm in the survey are pooled together and weighted by the probability attached to them and firm size to generate the overall distribution. Monthly data collected between May and July refer to Q1 of that year, data collected between August and October refer to Q2, data collected between November and the following January refer to Q3 and data collected between February and April refer to Q4 of the previous year.
Source: Decision Maker Panel at decisionmakerpanel.co.uk
Statistically, we can characterise the story for the US and the UK as follows: the early months of the pandemic involved a negative first-moment shock, a positive second-moment shock, and a negative third-moment or skewness shock. That is, the pandemic drove a large drop in the first moment of the economic outlook and much higher uncertainty in the form of highly elevated downside risks. While the pandemic recession unfolded with unusual speed and severity, this cross-moment pattern is consistent with previous recessions, which often combine a negative mean, positive uncertainty, and negative skewness shock to sales growth rates (Salgado et al. 2020).
The rapid rebound from the pandemic recession and strong reversal in the skewness effect is less typical. It is absent, for example, in cyclical episodes that feature protracted downturns and slow recoveries, as in the Great Recession and its aftermath.
In independent work, Fiori and Scoccianti (2021) tap the Bank of Italy’s Survey of Industry and Service Firms to measure subjective uncertainty about own-firm sales growth. The survey of Italian firms takes place annually, which makes it harder to assess the precise timing of developments. Like us, however, Fiori and Scoccianti find that subjective uncertainty rose dramatically in 2020 in reaction to the COVID-19 shock and fell back somewhat from 2020 to 2021. They also find that the nature of uncertainty shifted from downside risk initially in reaction to the pandemic to upside risk by 2021. Thus, at least three of the world’s major economies underwent a dramatic shift in the nature of firm-level uncertainty as the pandemic unfolded.
The shifting nature of firm-level uncertainty may bode well for economic recovery, given that several theoretical analyses highlight the potential for downside uncertainty to have more powerful negative effects on economic activity than upside uncertainty. See, for example, Bernanke (1983), Hansen et al. (1999), Ilut and Schneider (2014), and Alfaro et al. (2018).
Looking ahead, uncertainty may revert to pre-pandemic levels in the US and UK, as COVID-19 case numbers and deaths fall in both countries, social distancing subsides, and policy stimulus fades out on both sides of the Atlantic. Many firms see tantalising possibilities to the upside, according to our data. Nevertheless, there are significant risks to recovery from ongoing supply-chain disruptions, inflationary pressures, low vaccination rates in many countries, and the potential for new SARS-CoV-2 variants (Brilliant et al. 2021).
2 novembre 2021
LENA ANAYI, NICHOLAS BLOOM, PHILIP BUNN, PAUL MIZEN, GREGORY THWAITES, CHRIS YOUNG
Covid-19 and structural change
Poverty and exposure to Covid-19: The role of income support
(synthesis; full article – Vox Eu CEPR 28 October 2021 https://voxeu.org/article/covid-19-and-structural-change)
Abstract: Covid-19 has had a sizeable impact on where people work and how they shop. This column uses data from the Decision Maker Panel business survey of 3,000 UK firms to assess the longer-run impact. The pandemic is expected to increase hours worked from home and sales made online. Firms will invest less in land and buildings but more in IT and software. The pandemic is also expected to reduce medium-term employment and sales, with some shift away from large urban areas towards more rural areas.
Keywords: Covid-19 pandemic, anti-contagion policies, low income countries, middle income countries, poverty, human mobility
Covid-19 has had an asymmetric effect on companies, with those sectors involving the most social contact the hardest hit. It has also had a sizeable impact on where people work and how they shop. Working from home and the proportion of sales made online both increased sharply during the pandemic. This column uses data from the Decision Maker Panel to assess firms’ expectations as they look at the medium term beyond Covid-19.
Established in 2016, the Decision Maker Panel is a large and representative online panel of around 3,000 UK firms. In previous posts we have used the Decision Maker Panel to look at a number of aspects of the pandemic such as the initial impact on firms (Bloom et al. 2020), the effects on uncertainty (Altig et al. 2020), the implications for productivity (Bloom et al. 2021) and labour market reallocation (Anayi et al. 2021).
In this column on structural change, we draw on Decision Maker Panel questions on the expected medium-term impact of Covid-19 on sales, plans for working from home, and online sales beyond 2022, and new questions on investment types and use of different types of space. By looking across these dimensions jointly, we can get insights into the extent to which these changes may persist in the medium term, and also on the interactions between them.
We draw out four key results on the medium-term effects of the pandemic.
Covid-19 is expected to have only a small medium-term impact on sales, on average, but firms in industries where it is easier to work from home and those based outside large cities are expected to do better.
On average, UK firms expect Covid-19 to have a relatively small effect on sales, of around -1% over the medium term (defined as 2022+). But there are expected to be winners and losers among them. In particular, sales are expected to be higher post-2022 in industries where it is easier for people to work from home (Figure 1). These are typically industries that involve less face-to-face contact and which have been less affected by the pandemic. By contrast, regression analysis (not shown here) indicates that pre-COVID-19 dependence on online sales appears less important in explaining these medium-term effects.
Firms based outside large cities also expect to do better (Figure 2), which may be an indirect effect of increased working from home, as demand (for retail or recreational services, for instance) shifts away from city centres towards more suburban locations (as estimated by De Fraja et al. 2021).
Figure 1 Medium-term impact of Covid-19 on sales and percentage of jobs that can be done from home, by industry
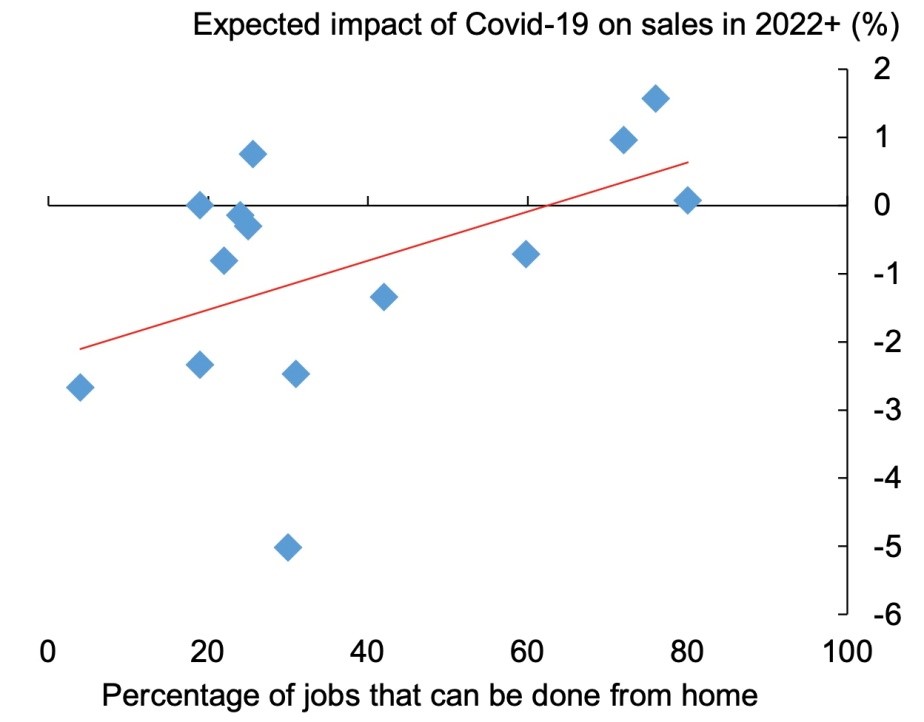
Notes: 1 digit industry data. Data on percentage of jobs that can be done from home are from Dingel and Neiman (2020).
Figure 2 Medium-term impact of Covid-19 on sales and employment, by HQ location
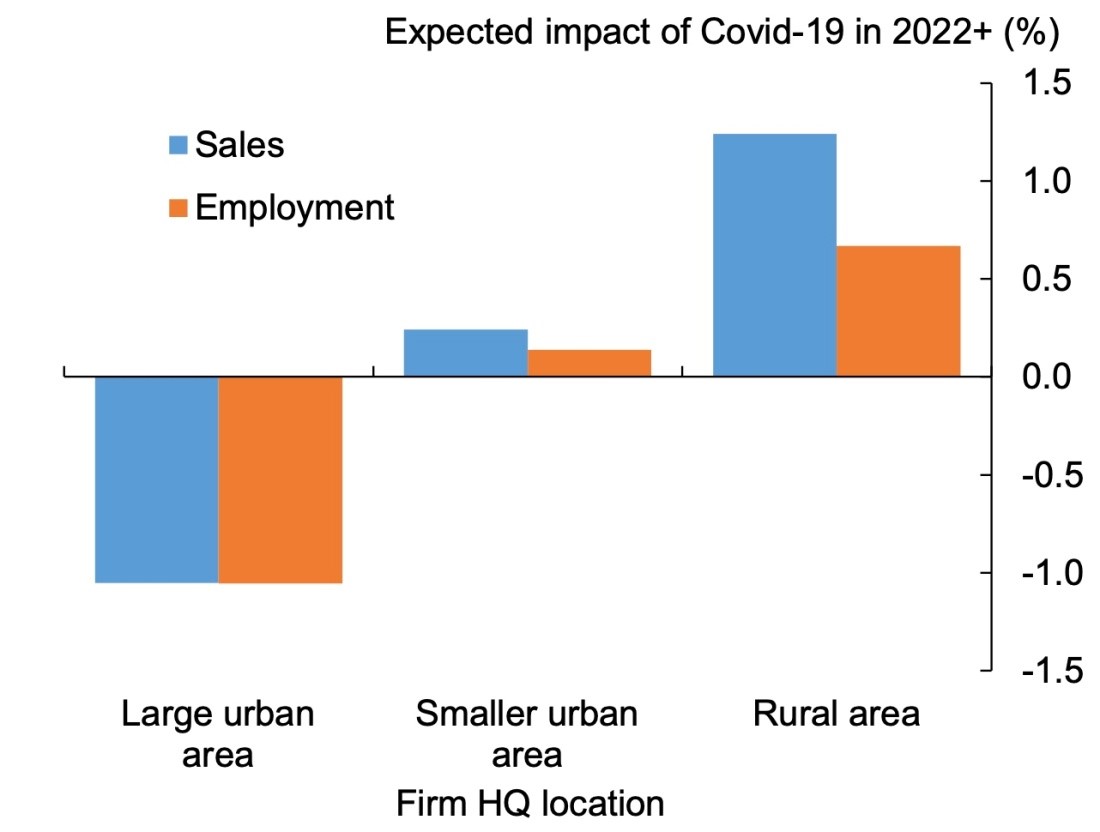
Notes: Using data on the locations of firms’ headquarters is an imperfect proxy for where firms’ sales occur. To mitigate that, we exclude firms with over 250 employees from this chart because these larger firms are more likely to operate across wider areas.
Firms expect more working from home and greater online sales to persist in the medium term…
In 2019, Decision Maker Panel respondents estimated that around 7% of the hours that their employees worked were from home. At the height of the pandemic, this share was as high as 60% when large parts of the economy were closed and the government advised people to work from home unless absolutely necessary (Figure 3).
The proportion of hours worked from home has been gradually falling as the economy reopened and government guidance changed. In September, 27% of hours were estimated to be worked from home. Over the medium term (2022+), around 20% of hours are expected to be done from home, still a three-fold increase relative to before the pandemic.
Consistent with this, around 70% of firms expect more remote working over the medium term relative to in 2019. The extent of the expected increase in remote working varies across firms, although most expect to adopt a hybrid model, with some hours done at home and some on business premises.
Trends in online sales follow a similar (but more modest) pattern, with some increase in the share of sales being made online during the pandemic, some of which is expected to persist over the medium term (Figure 3). Just over a third of firms expect to sell more online than they did pre-pandemic. This is a significant share but affects only around half as many firms as the increase in working from home.
Figure 3 Full-time days worked from home and sales made online
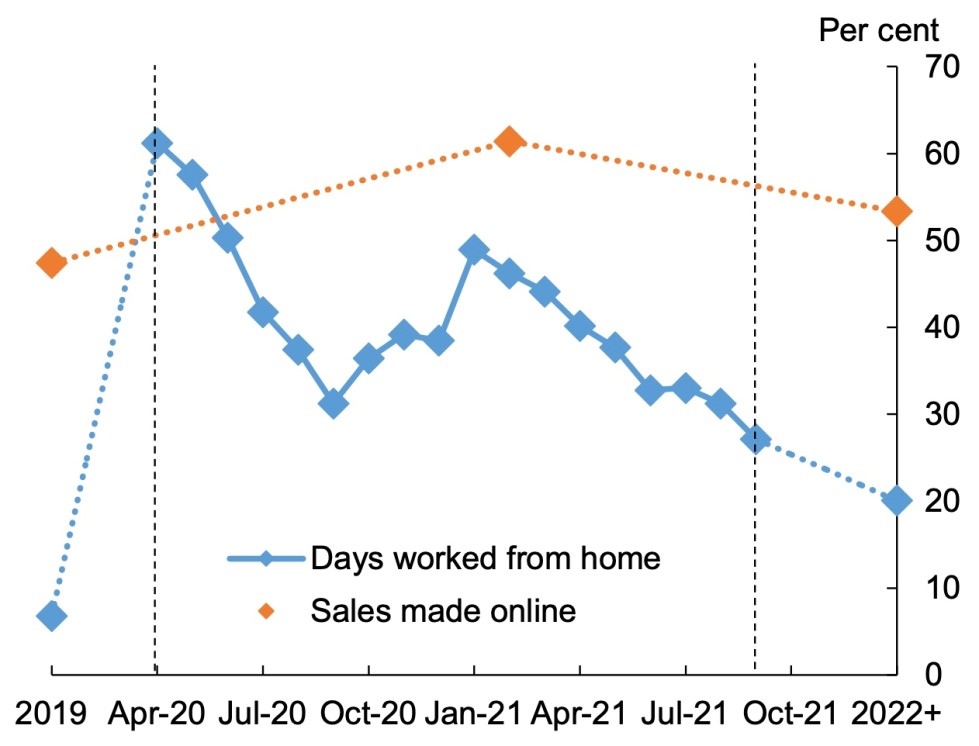
Notes: Solid lines and markers represent data points. Dotted lines are interpolations between data points.
Figure 4 Medium-term impact of Covid-19 on use of space

Notes: In 2019, respondents estimated that office space accounted for 39% of the total space they used (in terms of square footage), retail space 15%, factory space 16%, storage space 16% and other space 15%.
…driving changes in their need for space, in particular reduced office space and some increase in storage space…
Related to these changes, firms expect to change their use of space beyond 2022. Most notably, the expected use of office space is expected to fall (in terms of square footage) by 9% (Figure 4). Use of retail space is expected to be around 1% lower, with storage space increasing by around 2%. Regression analysis suggests this is likely to be driven by the shift towards more online sales in the medium term, following firms’ improvements in their e-commerce capability during Covid-19, and as more people continue to shop online even as the economy recovers.
Ad-hoc comments in the survey by panel members suggest that some firms would like to make larger changes to how they use space by the 2022+ horizon but are constrained by existing lease arrangements. So these changes could be even larger over the longer term, once those leases expire.
…and also driving changes in what they invest in, with increased working from home and online sales leading to more investment in IT and training, and less investment in land and buildings.
These changes in where people work and how they shop will change what companies invest in. In particular, companies expect to increase spending on employee training and IT by around 6%. Investment in land and buildings is expected to fall by around 4% (Figure 5). Taken with a small increase in machinery and equipment and a modest rise in R&D, total investment is expected to increase by around 1.5%.
Looking across firms, those that expect larger increases in remote working and online sales also expect to invest more in IT and software. More remote working is also associated with less use of office space and lower investment in land and buildings (Figure 6).
Bringing this together using firm-level regressions, we find that for every 10% of extra hours worked from home, 3.1% less office space is expected to be used and land and building investment will be 2.1% lower. That accounts for most of the expected fall in land and buildings investment.
Every 10% of extra hours worked from home is also associated with 0.5% more IT investment. For every 10% of extra sales that are expected to be made online, IT investment will be 1.9% higher and storage space use will increase by 0.7%.
Figure 5 Medium-term impact of Covid-19 on different types of investment
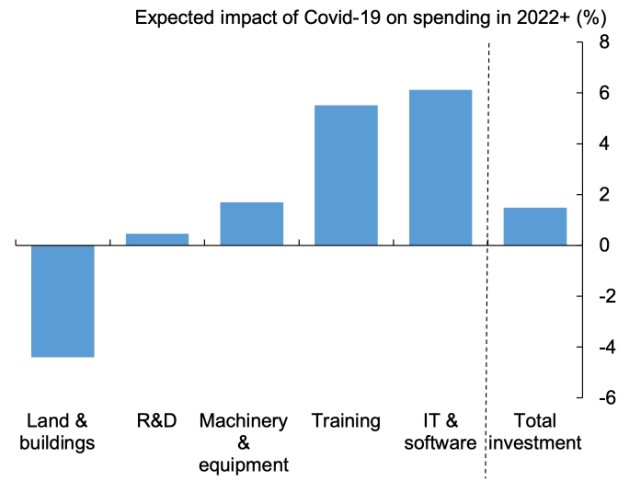
Note: In 2019, respondents estimated that land and buildings accounted for 18% of total spending on these items, research and development 11%, machinery and equipment 29%, employee training 10% and IT and software 33%.
Figure 6 Medium-term impact of Covid-19 on use of office space and different types of investment by expected change in working from home
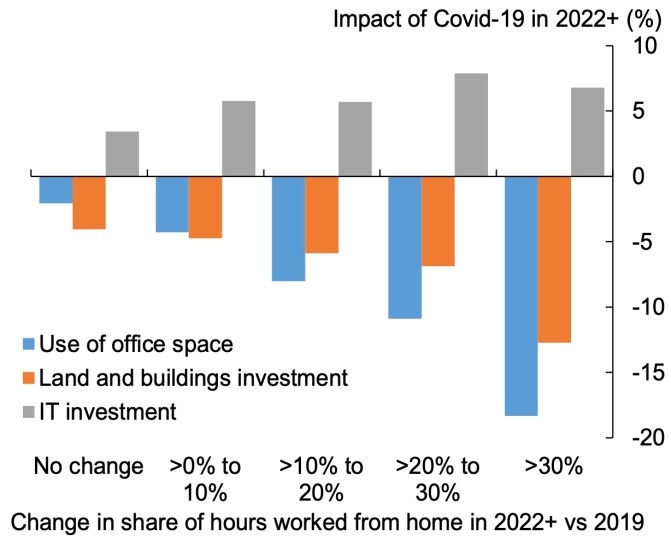
Conclusion
Covid-19 has led to unprecedented changes in where people work and how they shop. Some of these changes may be structural and persist in the medium term. We use data from the Decision Maker Panel survey of UK firms to assess what the effects of some of these changes might be.
In the medium term, Covid-19 is expected to lead to more hours being worked from home and more sales made online relative to pre-pandemic times. That will change how firms use space. In particular, firms are planning to use less office space and invest less in buildings. More remote working and online sales will boost investment in IT and software.
This change in the mix of investment could provide a small boost to productivity, although the effect will take time to build.
18 ottobre 2021
ULUGBEK AMINJONOV, OLIVIER BARGAIN, TANGUY BERNARD
Poverty and exposure to Covid-19: The role of income support
(synthesis; full article – Vox Eu CEPR 09 October 2021 https://voxeu.org/article/poverty-and-exposure-covid-19-role-income-support)
Abstract: In many countries, poorer people have been more exposed to Covid-19 as they cannot afford to stay at home instead of going to work. This column shows that in low- and middle-income countries, emergency income support schemes have significantly reduced differences in rates of contagion due to wealth or poverty status by allowing poorer people to also stay at home. As well as preserving livelihoods and alleviating poverty, income support has also been successful in curbing the spread of Covid-19.
Keywords: Covid-19 pandemic, anti-contagion policies, low income countries, middle income countries, poverty, human mobility
The Covid-19 pandemic has triggered an unprecedented deployment of anti-contagion policies throughout the world, among which mobility restrictions feature prominently. Recent studies suggest that adherence to stay-at-home orders is limited among poor households, who typically face acute food shortage and must seek out income generating activities. These studies tend to focus on low- and middle-income countries (Bargain and Aminjonov 2021, Benett 2021, Carlitz and Makhura 2021, Durizzo et al. 2021), but evidence also exists for rich countries.1 While strict containment is difficult to achieve when people must continue to work, a new role is emerging for income support: by enabling people to effectively stay home, it can produce substantial health externalities.
In our new research (Aminjonov et al. 2021), we first confirm that in low- and middle-income countries, regions with a higher incidence of poverty are characterised by a significantly lower reduction in work-related mobility when shelter-in-place policies are enacted – i.e. lower compliance with these containment measures. We then demonstrate that income support schemes have enabled the poor to isolate themselves almost as much as those from lower-poverty incidence regions. Ultimately, these programmes reduce by half the additional contagion caused – via the mobility channel – by regional differences in poverty incidence.
How containment measures and poverty affect human mobility
To assess the effect of poverty on human mobility, we rely on pre-pandemic estimates of poverty incidence for 729 subnational regions across 43 countries in Africa, Latin America, the Middle East, and Asia, as collected from official statistics or estimated using household surveys. These data are merged with daily regional mobility estimates from Google Covid-19 Mobility Reports over 202 days (from 15 February 2020 to 3 September 2020). Daily variation in containment measures is obtained from the Oxford Covid-19 Government Response Tracker (OxCGRT) (Hale et al. 2020). High mobility to workplaces in time of lockdown is interpreted as a low degree of self-protection or a limited compliance with these containment policies.
Figure 1 Mobility to workplace by level of regional poverty
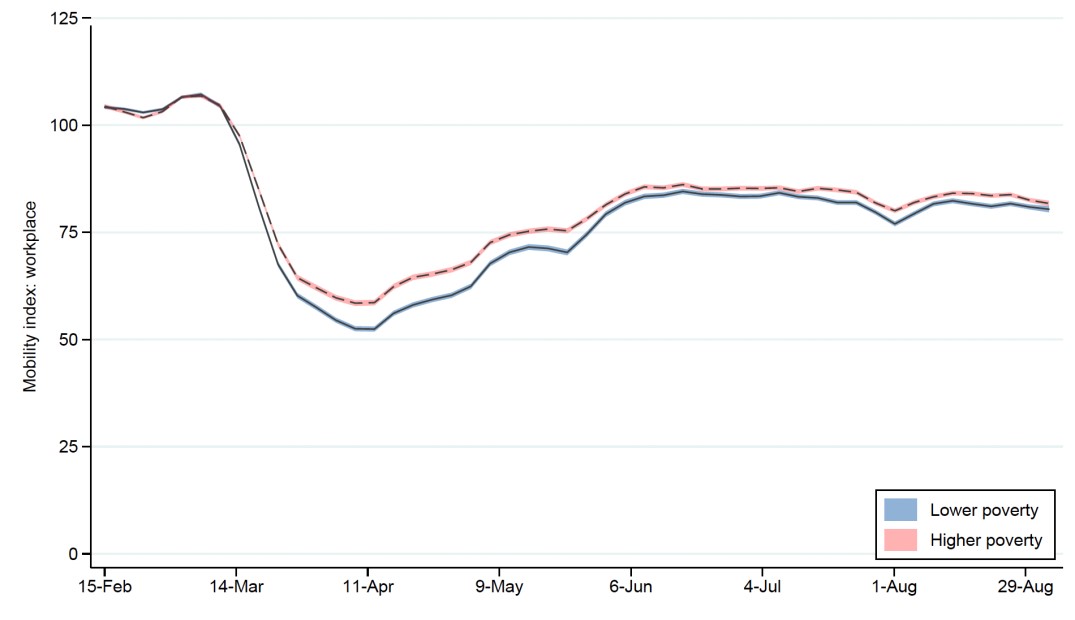
Source: author’s calculations based on Google mobility data (mobility for workplace), poverty data from national statistics offices and authors’ estimations using household surveys, and OxCGRT data on COVID-19 income support.
Notes: Local polynomial fit with 95% CI of daily mobility across regions, weighted by (1/# of regions in the corresponding country). Poverty is measured as the share of people living below national or international poverty lines in a subnational region. Poverty is defined as lower (higher) if region’s poverty rate is below (above) global median poverty rate based on the sample of 729 regions across 43 countries.
Figure 1 illustrates the trends in average regional mobility to workplaces for the period under study, differentiating between lower-poverty (below median) and higher-poverty (above median) regions. Mobility fluctuates around 100 in late-February and early-March – i.e. around the same level as in the baseline period of the Google Mobility Reports. Before mid-March, both groups of regions exhibit similar trends and almost no difference in levels. In the following weeks, many governments started to call for physical distancing, which shows up as a sharp drop in work-related mobility. This drop is significantly more pronounced for lower-poverty regions than higher-poverty ones.
The graphical evidence above is confirmed formally using a difference-in-difference estimation of mobility on poverty interacted with daily variation in lockdown status (with no containment in the early period) and controlling for region fixed effects. This simple approach compares the effect of shelter-in-place measures on work-mobility between lower- and higher-poverty regions. With lockdowns, work-related mobility drops everywhere (as shown on the previous figure). However, estimates show that this reduction is around 50% smaller in regions of higher poverty incidence. This difference is interpreted as a higher propensity to continue labour activities in these regions. This is consistent with the fact that such a mobility gap is not found for other types of activity (and, in particular, for necessities such as going to the supermarket or pharmacy).
The effect of emergency income support on mobility
Along with mobility restrictions, governments in low-income countries have engaged in outstanding income support policies. About one-third of all emergency social protection measures took the form of cash transfers, which reached over 1.1 billion people (14% of the world’s population). Usually motivated as a means of preserving livelihoods and avoiding sharp increases in extreme poverty, income support has another function: to help poor populations comply with public health rules, and thus contain Covid-19. We elicit this role using the OxCGRT data tracking national-level daily changes in income support provided to those who cannot work or lost their job due to the pandemic. Figure 2 depicts trends of regional mobility to workplace. The earliest Covid-19 income support programme began on 16 March 2020 and in a few weeks, 75% of the countries under study had implemented some support. Consistently, the figure shows that the drop in mobility is very similar between lower-poverty regions and higher-poverty regions that benefit from income support. The reduction in mobility is much less for poor regions without income assistance.
Figure 2 Mobility to workplace by regional poverty, with or without COVID-19 income support
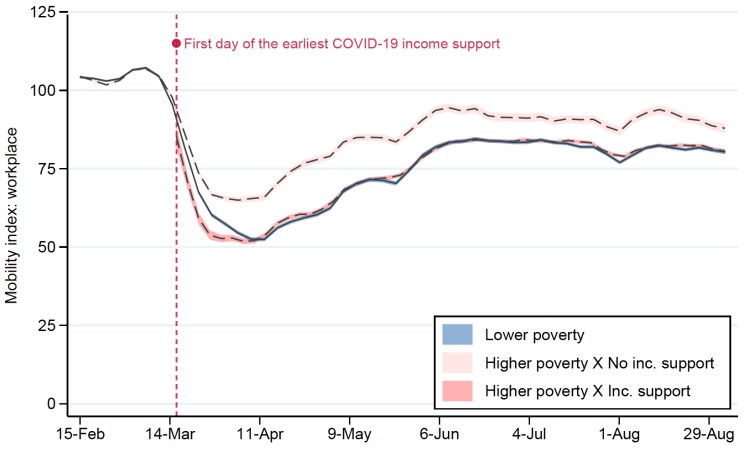
Source: author’s calculations based on Google mobility data (mobility for workplace), poverty data from national statistics offices and authors’ estimations using household surveys, and OxCGRT data on COVID-19 income support.
Notes: Local polynomial fit with 95% CI of daily mobility across regions, weighted by (1/# of regions in the corresponding country). Poverty is measured as the share of people living below national or international poverty lines in a subnational region. Poverty is defined as lower (higher) if region’s poverty rate is below (above) global median poverty rate based on the sample of 729 regions across 43 countries. COVID-19 income support shows the daily status of whether government provides any income support to those who cannot work or lost their job due to the COVID-19 pandemic (country-day variation in income support).
This result suggests that outstanding social protection schemes have helped to improve compliance with containment rules by reducing human mobility. It is confirmed by difference-in-difference estimations with region fixed effects, along with interactions of poverty, lockdown, and income support dummies. Figure 3(a) reports estimates: lockdowns alone reduce mobility by 14.2 points in lower-poverty regions (light blue) and by 8.2 in higher-poverty regions (pink) on average over the period. The complete policy mix (i.e. containment with income support) yields a mobility decline of 18.6 points in lower-poverty regions (dark blue) and 14.3 in higher-poverty regions (red). The main message is that providing income support to people living in the poorest regions helps them to achieve the same mobility reduction as other regions when there is no support. When both types of regions receive transfers, only a small compliance gap persists (4.3 points or 23% of the total mobility decline among the less poor). These findings emphasise the health externalities of social protection for poor people who must leave their home to maintain livelihoods during the pandemic despite containment rules and higher risks of contagion.
Figure 3 Mobility reduction due to stay-at-home orders combined with COVID-19 income support, by poverty level
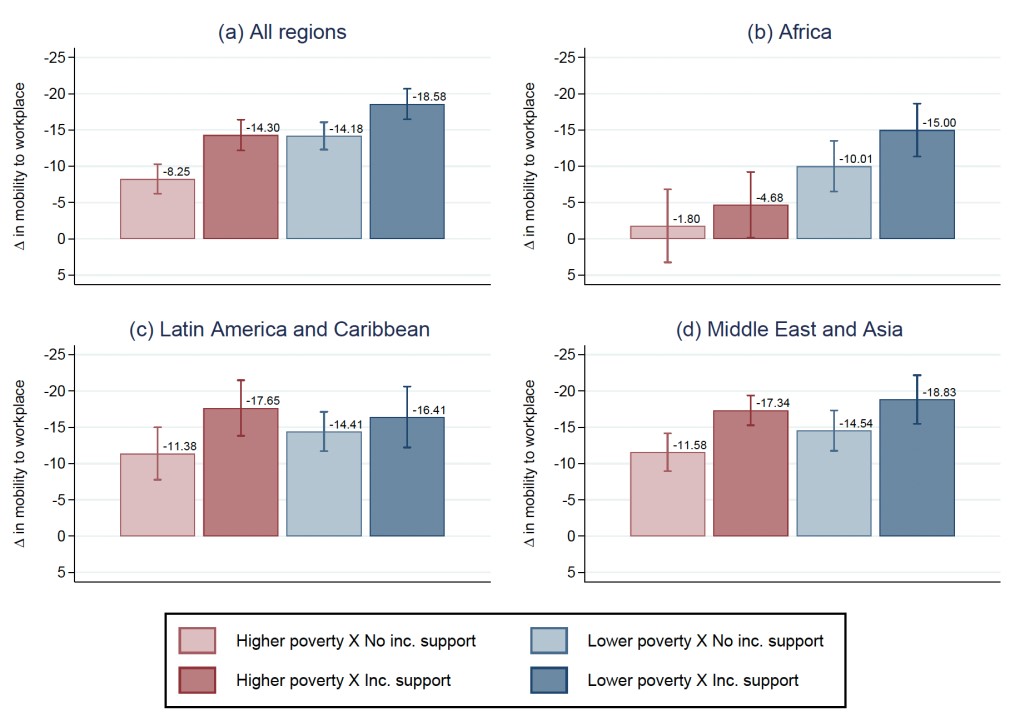
Source: authors’ estimation using Google reports for workplace mobility, regional poverty rates (from national statistics or authors’ estimations as described in Table A1) and the information on COVID-19 policy response from OxCGRT for the period February 15 – September 3, 2020.
Notes: Graphs show the mobility effects of stay-at-home orders with and without income support, as compared to the level of mobility during the period without stay-at-home orders and income support policy. Stay-at-Home is a dummy indicating the period in which national stay-at-home orders (recommendations or requirements) are in force. Income support is a dummy indicating period in which any income support is provided to those who cannot work or lost their jobs due to the COVID-19 pandemic. Poverty is defined as lower (higher) if region’s poverty rate is below (above) median poverty rate based on the sample of regions within a continent/group of countries. Regressions control for region and day fixed effects, lagged cumulative number of COVID-19 cases (the data from the European Centre for Disease Prevention and Control) and reweight observations by 1 over the # of regions in the corresponding country. Capped spikes illustrate 95% confidence interval based on standard errors that are clustered at region level.
The rest of Figure 3 shows some differences across geographical areas. Mobility reduction is low in Africa, possibly given lower living standards than in other continents and the nature of labour markets. Income support in African many countries does not manage to fill the mobility gap across regions and hardly affects the mobility reduction of the very poor. Indeed, the coverage is weak (i.e. new transfers reach less than 10% of the population in a majority of countries) and the overall expenses on emergency social protection are small – $8.3 billion (0.4% of the African GDP) over the year 2020 (Gentilini et al. 2020). For Latin America, we see that mobility gaps due to poverty are much more attenuated (light blue versus pink), with large mobility reduction due to containment measures in all type of regions.2 Nonetheless, for the higher-poverty regions in Latin American countries, the mobility difference due to emergency income support programmes is significant and consistent with the redistributive effort – $52 billion (1.2% of the continent’s GDP, and an average transfer of $154 per capita over 2020).
Implications for the spread of Covid-19
We complete previous results with an estimation of the contagion spread on human mobility. Combined with the estimate relating mobility to poverty and income support, we obtain an assessment of how the virus diffusion rate varies with poverty and income support via increased workplace mobility. A one standard deviation difference in poverty rates between regions results in 25% more Covid-19 cases after five months. This difference is limited to 11% when income support is provided.
The spread of Covid-19 and consequent restrictions on economic activity, notably through containment policies, pose a serious threat to the livelihoods of many of the most vulnerable families on the planet. Governments have responded to this with an unprecedented expansion of their social protection programmes and new transfers. Admittedly, government assistance was insufficient to sustain pre-crisis living standards and to prevent a sharp increase in food insecurity (Egger et al. 2021). Yet, we show that emergency support provided in response to the pandemic has substantially helped to reduce the exposure of the poor to the virus itself. A lot remains to be done in places where the intensity of support is low, notably in Africa where the average expenditure per capita was only $10 in 2020 (Gentilini et al. 2020). Further research will also have to provide more fine-grained information on policy options and their relative effectiveness in terms of health externalities.
12 ottobre 2021
Armand Fouejieu, Alvar Kangur, Samuel Romero Martinez, Mauricio Soto
RETHINKING PENSION SYSTEMS IN EUROPE FOR A POST-COVID-19 WORLD
(synthesis; full article – Vox Eu CEPR 02 October 2021 https://voxeu.org/article/rethinking-pension-systems-europe-post-covid-19-world-)
Abstract: The past three decades have witnessed reform efforts to contain pension expenditures, the cost of which is born mostly by younger generations. This column assesses the sustainability, fairness, and intergenerational equity of pension systems in Europe by comparing the pension contributions and benefits over the lifetime of different cohorts. Reforms legislated in the decade from the onset of the Global Crisis reduced the lifetime benefit-contribution ratio by nearly 25% for younger generations. However, subsequent policy reversals have partly eroded these gains, suggesting additional reforms are needed.
Keywords: COVID-19, Global Crises, European debt crisis, pension system, pension reform
In Europe, population ageing has been putting pressure on pension spending, threatening the sustainability of pension systems. Countries have responded, and responded with vigour. Over the past three decades, systemic pension reforms have been gradually introduced in many countries, including Italy (1995), Sweden (1998), Austria (2005), and Finland (2005). Still, it was the Global Crisis that triggered an avalanche of reforms. While at the onset of the Global Crisis pension spending in Europe was already projected to increase by about 4% of GDP over the long term, the Global Crisis and the European debt crisis made the imbalances in pension systems more evident and pressing (Börsch-Supan 2013), leading to tripling in the number of measures taken compared to the previous two decades (Carone et al. 2016). Sustainability concerns were at the fore of reforms that also improved the structure of pension systems and eliminated distortions, aiming towards greater actuarial fairness, counterbalanced by enhanced protection of low-income retirees. Importantly, the reforms did not treat generations equitably, often reducing pension entitlements for younger generations while sparing those in or close to retirement.
When the effects of the Global Crisis and the European debt crisis dissipated, reforms lost steam. Political pressures built up not to ‘walk the previous talk’, leading to policy reversals in many countries, partly undoing earlier gains (OECD 2019). Such reversals can be facilitated by long transition periods characteristic of most reforms that can stifle implementation (Kohli and Arza 2011). Reversal of reform momentum comes across also from projections in the the 2021 Ageing Report (European Commission 2021), where in several countries’ policy-related changes contribute towards an increase in spending profiles.
The COVID-19 pandemic has increased sustainability risks of pension systems and further widened generational imbalances by disproportionately affecting the youth and working-age populations compared to retirees – a pattern that repeats the experience of earlier crisis periods (Chen et al. 2018). Such changing socioeconomic environment requires clear diagnosis of the sustainability and equity of pensions under current policies and places higher demands on rethinking the design and mix of pension and welfare systems.
In a recent study (Fouejieu et al. 2021), we propose a framework that allows the assessment of pension reforms with a focus on sustainability, fairness, and intergenerational equity. The centre piece is the proportionality measure (PM), motivated by Knell (2005), that allows to compare the ratio of the present value of pension benefits to the present value of pension contributions over time for each cohort. By setting the discount rate equal to GDP growth, the PM can be expressed as the (undiscounted) ratio of the sum of benefits to the sum of contributions, both as a percentage of GDP.
Defined in this way, the PM is a gauge of actuarial fairness, comparing contributions made during working life and payments received at retirement. For a cohort, an actuarially fair pension system would yield a PM equal to one , i.e. benefits are fully compensated by contributions, while a PM above one would reflect a system that provides more in benefits than what it receives in contributions. A system would be sustainable if the present discounted value of contributions at least equals the present discounted value of benefits across all cohorts, which holds when the PM is below or equal to one. The PM also links the sustainability of the pension system to equity across generations. A constant PM across cohorts signals a pension system in which all cohorts are treated equally, thus ensuring intergenerational equity.
We apply this framework to three vintages of the Aging Report projections: the 2009 vintage, which excludes extensive reforms implemented after the Global Crisis; the 2018 vintage, which largely captures the impact of these reforms; and the 2021 vintage, which allows us to discuss reform reversals in the most recent years. Before the Global Crisis (based on the 2009 Ageing Report), pension systems in Europe were neither actuarially fair nor sustainable: an average PM in the order of two for both current and future retirees signals that pensioners received benefits equivalent to about twice their contributions in present value terms. The average PM estimated using the 2018 Ageing Report projections falls to nearly 1.5 in the long term while remaining largely unaffected for the current retirees, a testament to the impact of reforms adopted after the Global Crisis, which brought pensions about halfway toward achieving the long-term sustainability (Figure 1). Last, the average long-term PM based on projections from the 2021 Ageing Report is 1.7, pointing to the impact of reversals along with other factors that deteriorated sustainability compared to 2018, including rollbacks of earlier increases in retirement ages, suspensions of sustainability factors, and the increasing role of public pension systems in emerging Europe.
Figure 1 Proportionality measure for cohort born in 1990
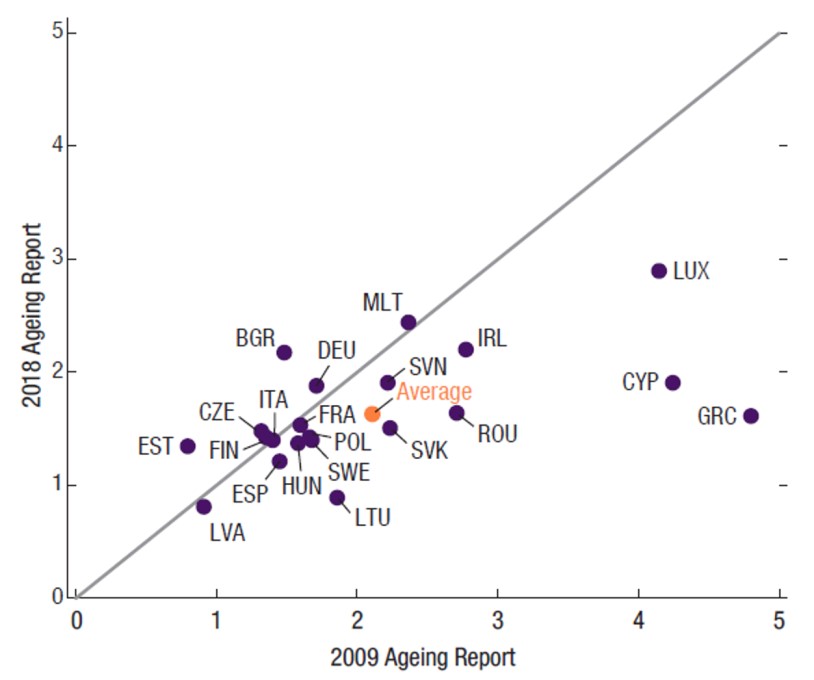
Sources: 2009 and 2019 Ageing Reports; Eurostat; IMF staff calculations.
While before the Global Crisis the PM is broadly similar across cohorts on average, subsequent reforms did not treat generations equitably. The pattern of PMs over cohorts for countries that have introduced deeper systemic reforms – declining from high initial levels for older cohorts – illustrates that in most cases younger generations bear the cost of pension reforms (Figure 2). In other countries, current policies and population ageing favour younger cohorts.
Figure 2 Proportionality measure by cohorts for 2021 Ageing Report
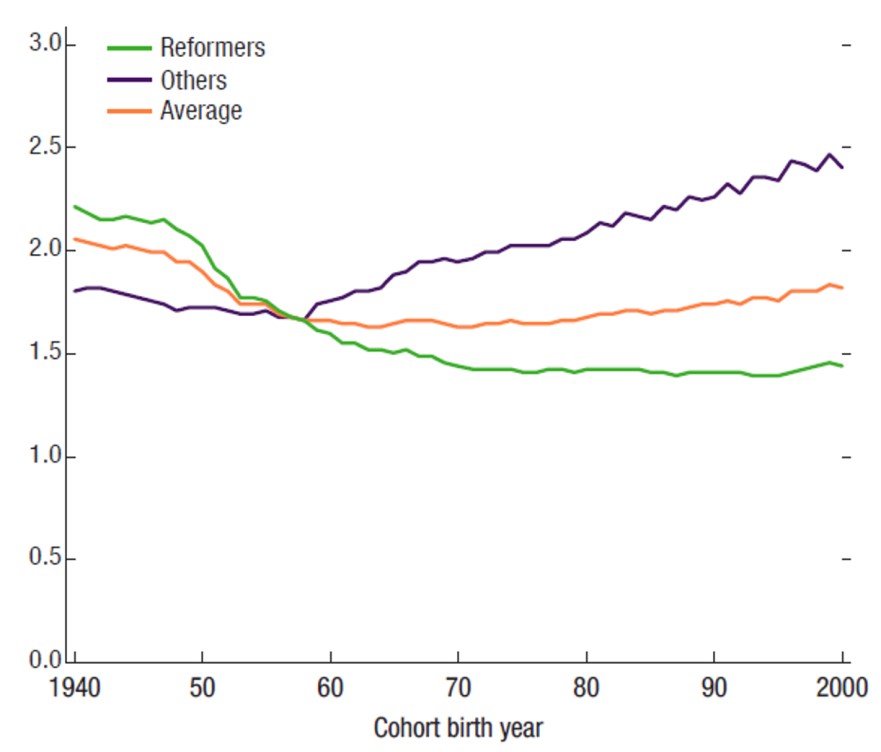
Note: Calculations are based on a smaller sample of countries for which lifetime benefits and contributions can be constructed for all cohorts.
Sources: 2021 Ageing Report; Eurostat; IMF staff calculations.
The way forward
These results suggest that pension systems, as they currently stand in Europe, are neither sustainable nor equitable. As such, many systems require substantial state transfers. The average pension system deficit in Europe stands around 2.5% of GDP today and is projected to increase to 4% of GDP in the next three decades. Financing sustained high levels of pension spending in some countries might be difficult without triggering some stress in light of already high public debt levels or eroding potential growth. While population aging has been associated with lower productivity growth (Batog et al. 2019), higher pension spending may also require higher contribution rates, or crowd out other productive spending, which can weigh on employment and GDP (Barr and Diamond 2008, Börsch-Supan 2013).
Going forward, reforms should aim for more progress towards sustainability and do so not only at the expense of younger generations. Appealing to shared principles of fairness and equity across generations, spreading the adjustment more equally across all generations is critical to foster greater political acceptability (Kohli and Arza 2011). Reforms should watch for long phase-in periods which, while giving individuals and households time to adapt, deepen intergenerational divides, posing risks to their future implementation. Strengthening the links between contributions and benefits, for example by setting benefit or contribution adjustments at actuarially neutral levels, would also minimise work distortions as labour markets continue to recover. Where social, basic, minimum or other targeted pensions are in place to provide poverty alleviation, care should be taken in how these interlink with earnings-related pensions or other support to elderly.
4 ottobre 2021
Luke Bartholomew, Paul Diggle
THE LASTING IMPACT OF THE COVID CRISIS ON ECONOMIC POTENTIAL
(synthesis; full article – Vox Eu CEPR 21 September 2021 – https://voxeu.org/article/lasting-impact-covid-crisis-economic-potential)
Abstract: As the global economy recovers from the immediate economic impact of the Covid crisis, attention is increasingly turning to the long-run impact of the shock on productivity. This column identifies several channels – including labour market hysteresis, impaired skill acquisition, belief scarring, an increase in zombie companies, and policy errors – through which the lasting harm will outweigh any positive supply shocks caused by the pandemic. The authors estimate long-term output losses in the order of 3% of global GDP. Scarring will be greater in some economies than others, pointing to the importance of policy in mediating and offsetting these channels.
Keywords: COVID-19 economic impact, global economy, fiscal plans, vaccines, labour market
As the global economy recovers from the immediate economic impact of the Covid crisis, attention is increasingly turning to the long-run impact of the shock on the productive potential of the economy. Such assessments are crucial in various looming policy choices. The UK government’s fiscal plans, for example, rest on the Office for Budget Responsibility’s assessment that the UK’s economic outlook will remain 3% below its pre-crisis trend into the long run (OBR 2021). And as the US Federal Reserve and other central banks begin to remove policy support, estimates of potential output and the output gap will be central to the assessment of inflation pressures.
While there is a growing literature studying the lasting impact that cyclical shocks can have on the supply side of the economy (Cerra et al. 2020), empirical work has tended to pick out financial crises as a source of shock with particularly lasting effects (Fuentes and Moder 2021). The Covid crisis is not a financial crisis, and past pandemics may not provide an especially helpful guide to the impact of Covid due to profound changes in the structure of the economy over time, and differences in the size and scope of pandemics (Bonam and Smădu 2021). There are therefore no ready analogues to consult when attempting to estimate the long run impact of this crisis.
In our recent work (Bartholomew and Diggle 2021), we approach the question by identifying the various channels through which this shock may cause lasting changes to the supply side of the economy, and assess how policy responses in various countries may have mitigated or exacerbated these channels.
A positive supply shock?
Recent data are consistent with an increase in aggregate productivity since the onset of the crisis, but it is hard to believe this reflects a persistent improvement in the supply side of the economy rather than a compositional effect that will reverse in time as economies continue to reopen.
There are, however, a number of channels through which Covid could have caused persistent improvements in productivity. Behavioural studies suggest that path dependencies can lock agents into sup-optimal behaviour, which large shocks can correct by forcing re-optimisation (Larcom et al. 2017). Covid may have caused such a re-optimisation – around working from home, for example – and may have accelerated the adoption, commercialisation, and diffusion of existing technologies to allow for shifting patterns of production and consumption.
It is also possible that the development of mRNA vaccines will kick-start a wave of other innovations in life science and medicine that boost total factor productivity.
However, we think these effects are unlikely to outweigh the various channels through which we expect Covid to have permanently depressed the supply side of the economy.
Labour market hysteresis and impaired skill acquisition
Economists have long understood that recessions can leave lasting scars on the labour market (Blanchard and Summers 1989). In particular, periods of unemployment are associated with skills erosion, loss of contact with the labour market, stigmatism, and a willingness to take unsuitable employment opportunities. All of these tend to weigh on labour supply and efficiency.
The impact of the initial Covid shock on labour markets around the world was mediated by differing labour market institutions in different economies. In the US, enhanced unemployment benefits allowed a surge in unemployment while supporting household incomes, whereas European furlough and short-time work schemes allowed a collapse in hours worked even as labour matches were largely maintained. These are in turn likely to mean quite different long run experiences: countries that experienced higher unemployment are more likely suffer from a lasting decline in labour force participation but may also enjoy a more efficient redeployment of labour.
The crisis is also likely to weigh more heavily on skill formation than standard recessions. The enormous number of education hours lost through school and university closures will have damaged human-capital accumulation (Burgess and Sievertsen 2020). While there is scope for catch-up learning among younger children, older children and adults on the cusp of entering the workplace may have permanently missed out on learning.
Indeed, it is well documented that downturns see a destruction of valuable firm-specific human capital (Fujita et al. 2020), and cohorts entering the labour market during a downturn tend to suffer lasting effects on their wages. The current cohort is particularly likely to struggle with building firm-specific human capital due to the weakness of the labour market combined with remote work making certain forms of firm-specific knowledge acquisition more difficult.
Belief scarring
The experience of a large negative shock can have a persistent impact on the beliefs of firms and businesses. Such ‘belief scarring’ can cause individuals to take systematically less risk in their household finance and portfolio allocation decisions (Malmendier and Nagel 2009) and may be associated with persistently higher desired saving and lower desired investment, resulting in permanent economic damage (Kozlowski et al. 2020).
Household saving rates have increased significantly since the start of the crisis, although it is not yet clear how persistent this increase will prove in light of changes to government balance sheets (Bilbiie et al. 2021). It is also plausible that in those countries with more extensive policy support, belief updating will see households and firms take a more expansive view of how much state-provided income support will be available in future downturns, and reduce their saving accordingly.
Zombification
The crisis may also see an increase in ‘zombie firms’ – unprofitable firms with low stock market valuation and difficulty servicing debts. There seems to be a ratchet effect on the quantity of such firms, with their number increasing during downturns, but little evidence that this process goes into reverse during recoveries (Banerjee and Hoffman 2018). The rise in such firms may weigh on productivity through congestion effects, impairing the reallocation of capital towards more productive uses.
Given the various emergency support schemes provided by governments during the Covid shock – including cutting interest rates and easing financial conditions more generally, emergency liquidity facilities, and regulatory forbearance – this crisis may have created many more zombie firms. For example, the German Economic Institute in Cologne estimated that an extra 4,300 zombie firms existed because of the German government’s relaxation of bankruptcy laws (Röhl 2020).
On the whole, government support probably stopped many more otherwise viable firms from going bust during the initial collapse in demand following the outbreak of the pandemic than it kept zombie firms going. However, as the economy recovers and re-orients to shifts in production and consumption habits, it is important that resources are allowed to re-allocate and that policies encourage rather than impede this process.
Policy error
The best way of ensuring this efficient reallocation of resources may be though expansive policy which tolerates periods of above-target inflation (Guerrieri et al. 2021). Indeed, we argue that insufficiently supportive demand-side policy is the biggest risk to the recovery from Covid and the mostly likely source of sustained damage to the supply side of the economy. Policy error of this kind was responsible for the sluggishness of economic growth following the financial crisis and it is easy to see similar mistakes being made again. There is also the risk that crisis fighting and economic weakness more generally leads to a reduction in impetus behind structural reform agendas, with trade liberalisation particularly vulnerable in this regard.
Quantifying the damage
Bringing this together, our central estimate is that Covid will impart a permanent levels shock to post-pandemic global economic output of 3% of GDP. This is a third the size of the levels damage after the global financial crisis. There are sizeable cross-country differences in the degree of long-term damage, depending on the severity of the viral experience, the size and design of policy responses, and the structure of labour markets. This means more long-term damage to the path of GDP in the euro area, India, and Brazil, and less in China and the US.
Figure 1 Path of global GDP
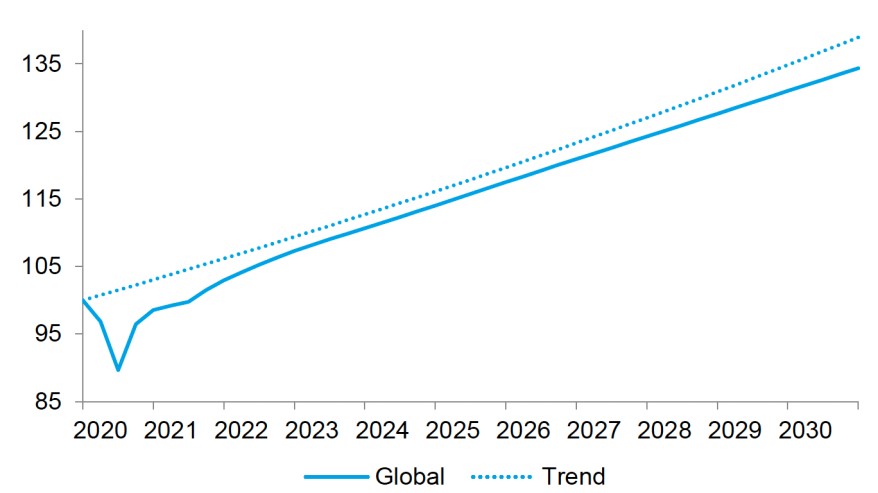
Figure 2 Long-term damage to level of GDP in 2025, relative to pre-pandemic trend path
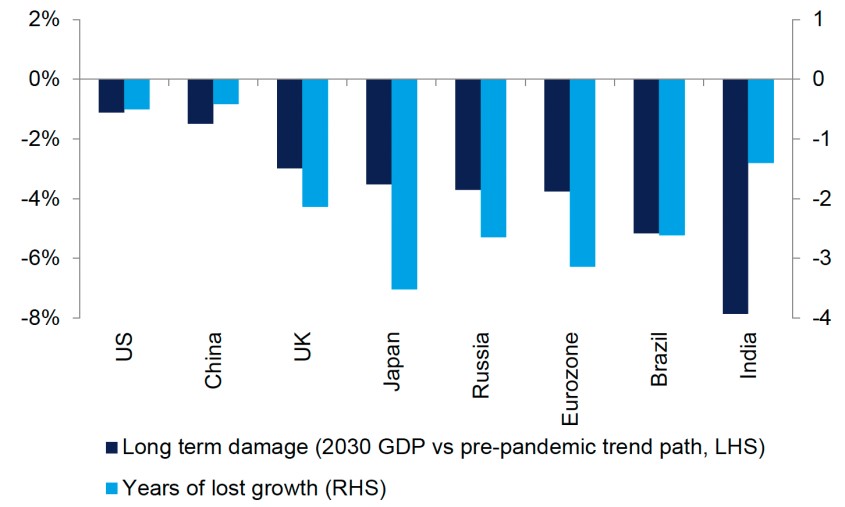
30 agosto 2021
NIKOLAY ANGELOV, DANIEL WALDENSTRÖM
Income inequality during the Covid-19 pandemic
(synthesis; full article 13 August 2021 – https://voxeu.org/article/income-inequality-during-covid-19-pandemic)
Abstract: The negative economic impact of the Covid-19 pandemic has received much attention, but less is known about its distributional consequences. This column presents new evidence on the pandemic’s inequality effects in Sweden using data on earnings and individual take-up of government Covid-19 support. The results show that income inequality increased during the pandemic, mostly due to layoffs and fewer working hours among low-income, part-time employees. The government’s support policies significantly dampened the increase in inequality increase but did not reverse it.
Keywords: COVID-19 pandemic, inequality impact, job losses, dispersion of incomes, market incomes.
The question of inequality effects of the Covid-19 pandemic has not been widely addressed due to a general lack of information about recent individual or household incomes. Some early studies have examined simulated datasets or collected new household surveys (O’Donoghue et al. 2020, Almeida et al. 2021, Clark et al. 2021). Results from these studies suggest that inequality decreased after the pandemic’s outbreak, primarily due to massive government transfers without which inequality would probably have increased following job losses among low-paid workers. However, studies of history find that inequality tends to increase during pandemics (Furceri et al. 2020, Galletta and Giommoni 2020)
In a new study (Angelov and Waldenström 2021), we estimate the inequality impact of the Covid-19 pandemic using population-wide administrative earnings registers in Sweden collected at a monthly level both before and during the pandemic for all working individuals. By comparing the dispersion of income during the same months in 2019, 2020, and early 2021, we attain measures of the impact of the pandemic on the average and inequality of earnings. We also access register data on individual-level take-up of government Covid-19 support, which allows us to analyse their distributional impact. Finally, we analyse annual pre- and post-tax market incomes for 2018, 2019 and 2020. The annual incomes are less precise with respect to the impact of the pandemic, which broke out a few months into 2020, but offer a broader view of income inequality by including incomes from all sources, some transfers, and all taxes paid.
The distribution of monthly earnings increased during the pandemic
Figure 1 shows the evolution of average pre-tax earnings in 2019-2021 among working individuals 18-64 years old. The wage earners are divided into six quantile groups based on the size of earnings, separated by percentile thresholds (P): the three lowest income quartiles P0-25 (consisting mainly of younger, part-time workers), P25-50 and P50-75, and the top earnings quartile divided into three subgroups, P75-90, the lowest nine tenths P90-99 and the top hundredth P99-100.
Several interesting patterns emerge. First, comparing the earnings levels suggest that the pandemic depressed average earnings by around 5%. The fall was the largest in April-May and in the lowest earnings quartile. Second, the within-year variation of earnings differs quite much across the distribution. Low-income earners experienced higher overall variance and their earnings peak in the summer’s holiday season. Middle-income earners enjoyed more stable incomes, and received pay rises in June (holiday pay) and December (extra-wage payments). High-income earners experienced spikes in earnings in December (mainly small business owners’ wages, which affect the amount of next year’s low-tax dividends) and March (chief executives’ variable remuneration).
Figure 1 Wage income in different parts of the income distribution, 2019-2021
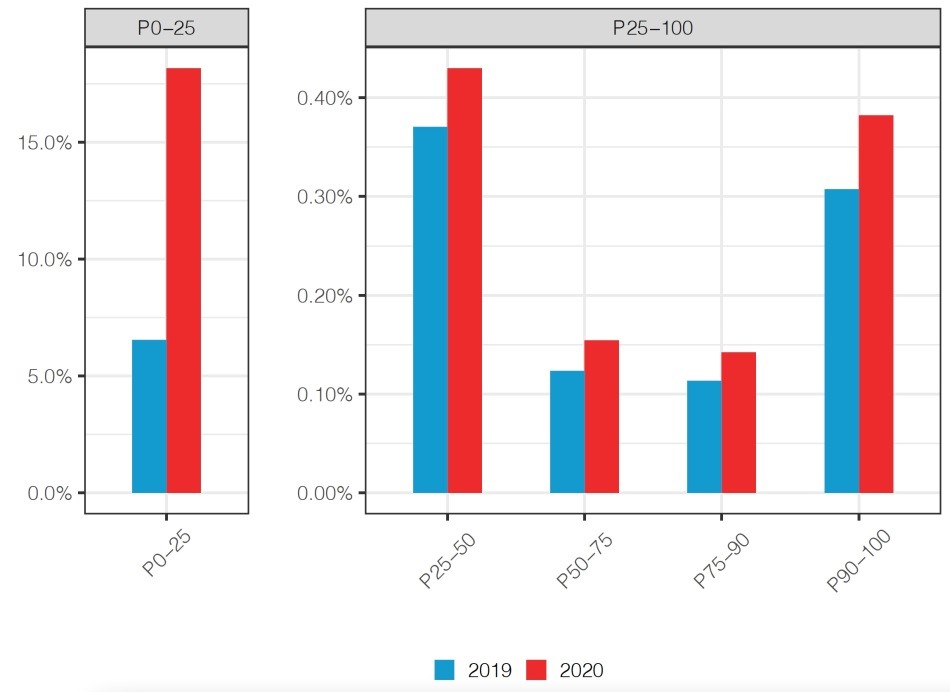
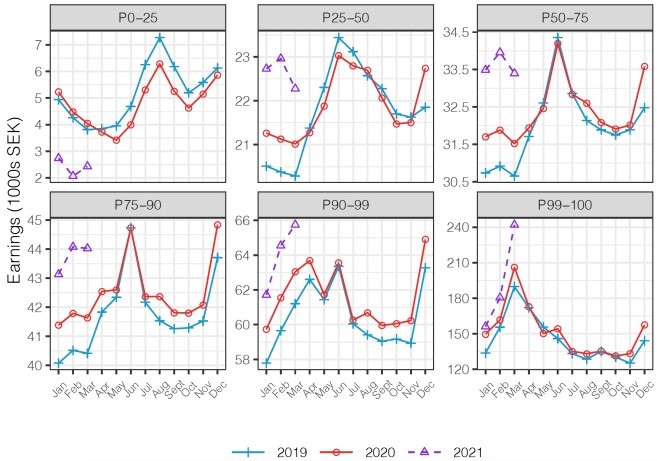
Figure 2 presents the earnings inequality development during the period, measured as the commonly used Gini coefficient (which spans between 0, no inequality, and 1, maximum inequality). The Gini increased roughly one point, about 2.5%, after the outbreak of the pandemic. This increase is not particularly large; during the 1990s recession in Sweden, the labour earnings Gini increased by 15% between 1990 and 1994.
Figure 2 Earnings inequality before taxes, individuals 18-64 years, 2019-2021
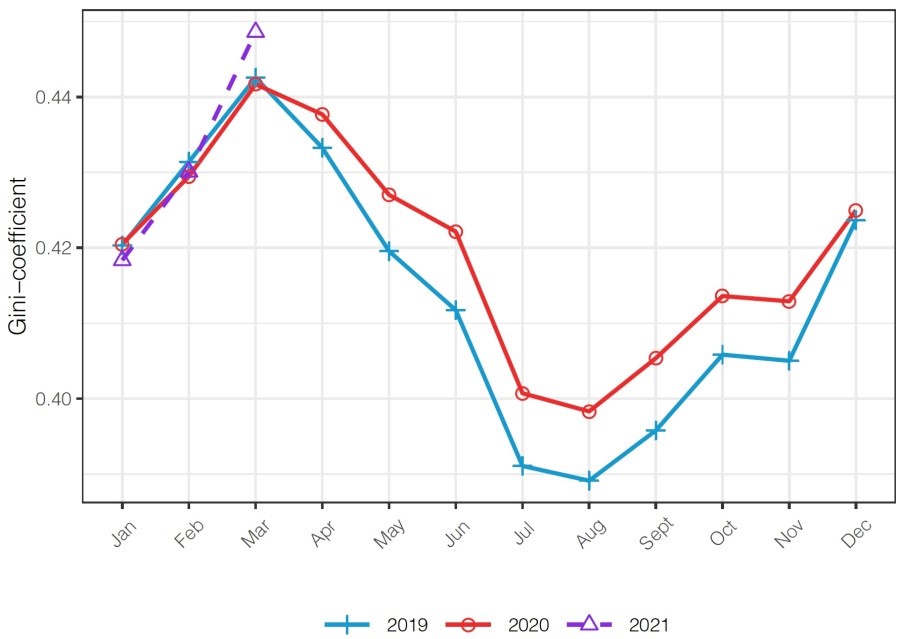
A more precise picture of how the pandemic affected earnings across the distribution is offered in Figure 3. This figure shows the marginal effects of the pandemic on earnings conditional on being employed during the whole observation window, estimated separately for different earnings quantile thresholds using so-called RIF regressions. To identify the effect, we exploit the variation from both yearly trends and within-year changes. The results suggest that the earnings impact was most negative for low-income earners. At the absolute bottom of the distribution, average earnings decreased by 6%. In the middle, they fell by 2.4% and in the top hundredth they decreased by 1% (with a confidence interval between 0% and 2%). These estimates confirm the regressive nature of the pandemic’s economic impact on the Swedish labour market.
Figure 3 Earnings impact of the Covid-19 pandemic across the earnings distribution (RIF regressions)
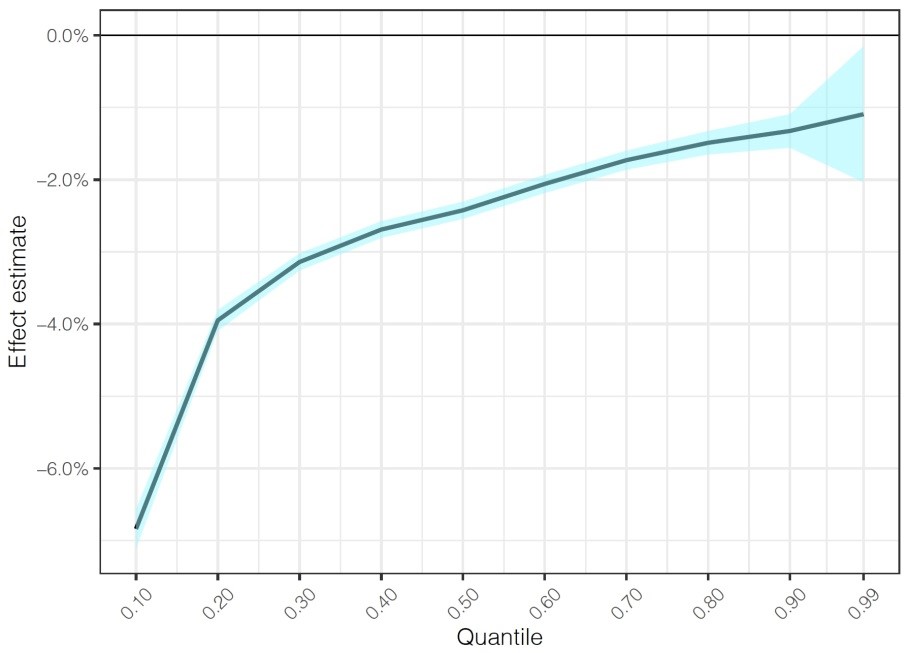
Besides affecting the earnings among the employed, the pandemic also had an impact on unemployment. This is illustrated in Figure 4 showing the share of employees who had a salary during January-February but no salary, that is, unemployment, during March-December in 2019 and 2020. The figure shows that in the bottom quartile, the share of workers that became unemployed increased threefold, from 6% in 2019, which is assumed to be a normal within-year transition rate, to 18% in 2020. Employees in other quantile groups did not experience such a drastic rise in unemployment spells, indicating that labour supply effects could account for a large part of the observed overall inequality increase during the Covid-19 pandemic.
Figure 4 Unemployment share in March-December among workers with a salary in January-February, 2019-2020
The distributional impact of the government’s Covid-19 support
We have access new registers that record all individual payments of the government’s Covid-19 support directed to firms and individuals. By linking these payments to the earnings registers, we can calculate counterfactual earnings distributions by subtracting the support money from the individual earnings.
Two main counterfactual scenarios are implemented. In the first policy simulation (‘PS1’), we reduce the earnings of employees by the exact amount of the support received. This corresponds to a situation in which employees work fewer hours, and receive less income, but retain their jobs in line with an anti-unemployment model like Germany’s Hartz-IV programme. In ‘PS2’, we instead let employees keep their full-time employment, and full-time salary, but shrink the number of employees until the total wage bill matches the employers’ supportless payments. This procedure is close to the traditional Swedish labour market model, which nurses full-time employment and the sacking of young, low-wage workers according to a ‘last in, first out’ scheme.
Figure 5 presents the results of these simulations. Both scenarios generate a markedly higher inequality level than what was actually observed. The Gini coefficient would have increased two to three times more than it did during the pandemic’s initial months and slightly less thereafter had the government not extended any income support.
Figure 5 Covid-19 support and earnings inequality: Simulated counterfactual outcomes
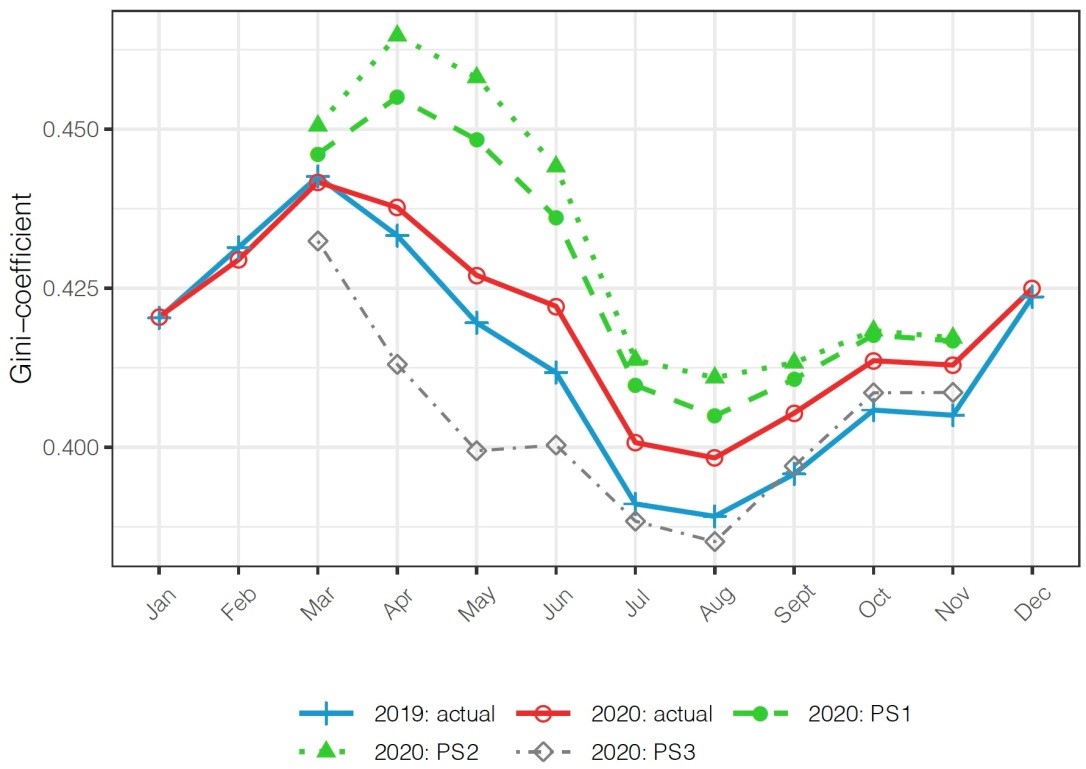
Note: Gini-coefficient of monthly earnings among working adults aged 18-64. ”Actual” signifies observed outcomes. The simulations reflect outcomes without government Covid-19 support money in two scenarios: sustained employment but fewer hours worked (PS1) or sustained full-time jobs but higher unemployment (PS2). PS3 denotes the PS1 simulation plus a redistribution of all support to individuals in the bottom earnings quartile.
The finding that inequality increased during the pandemic in Sweden goes counter to what has been found in other countries (Stantcheva 2021). One possible explanation is that the direct government Covid-19 support has been relatively small in Sweden (IMF 2021). To examine this, we make a third simulation, ‘PS3’, in which we investigate whether the actual amounts of support in Sweden could have, hypothetically, decreased inequality, should the money have been distributed among those with the lowest earnings. We first remove all the support (as in PS1) and then add this support by distributing it to individuals in the lowest earnings quartile. The results show that inequality decreases when doing this, thus emphasising the role of government support for inequality during the pandemic.
Annual total income inequality
In a supplementary analysis, we examine yearly income tax returns during 2018-2020 of all adults (including old-age pensioners). Annual incomes cannot be used to draw firm conclusions about the pandemic, but these data contain incomes from all sources, including capital, self-employment and taxable transfers as well as all taxes paid.
Figure 6 shows that average incomes fell in the bottom of the distribution, partly due to lower earnings (as in the monthly analysis) and to losses among the self-employed (the grey negative fields). Incomes the upper half of the distribution increased somewhat.
Figure 6 Average incomes and their composition, adult population, 2018-2020
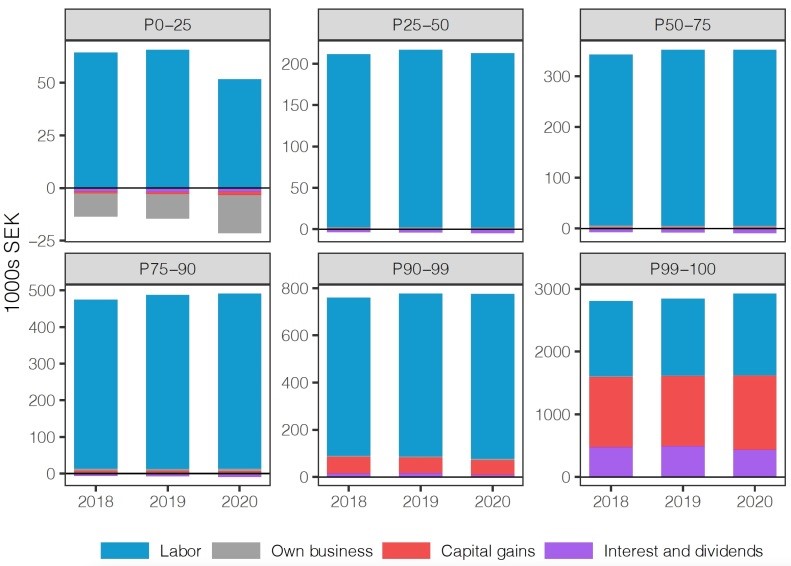
Figure 7, finally, presents Gini coefficients for annual total incomes of adult individuals. Inequality increased significantly in 2020 by about 5%, both before and after taxes. This is a larger increase than was observed for monthly earnings, and the main explanation is the addition of self-employment deficits and lower earnings among pensioners.
Figure 7 Inequality in the total annual income among adult individuals, 2018-2020
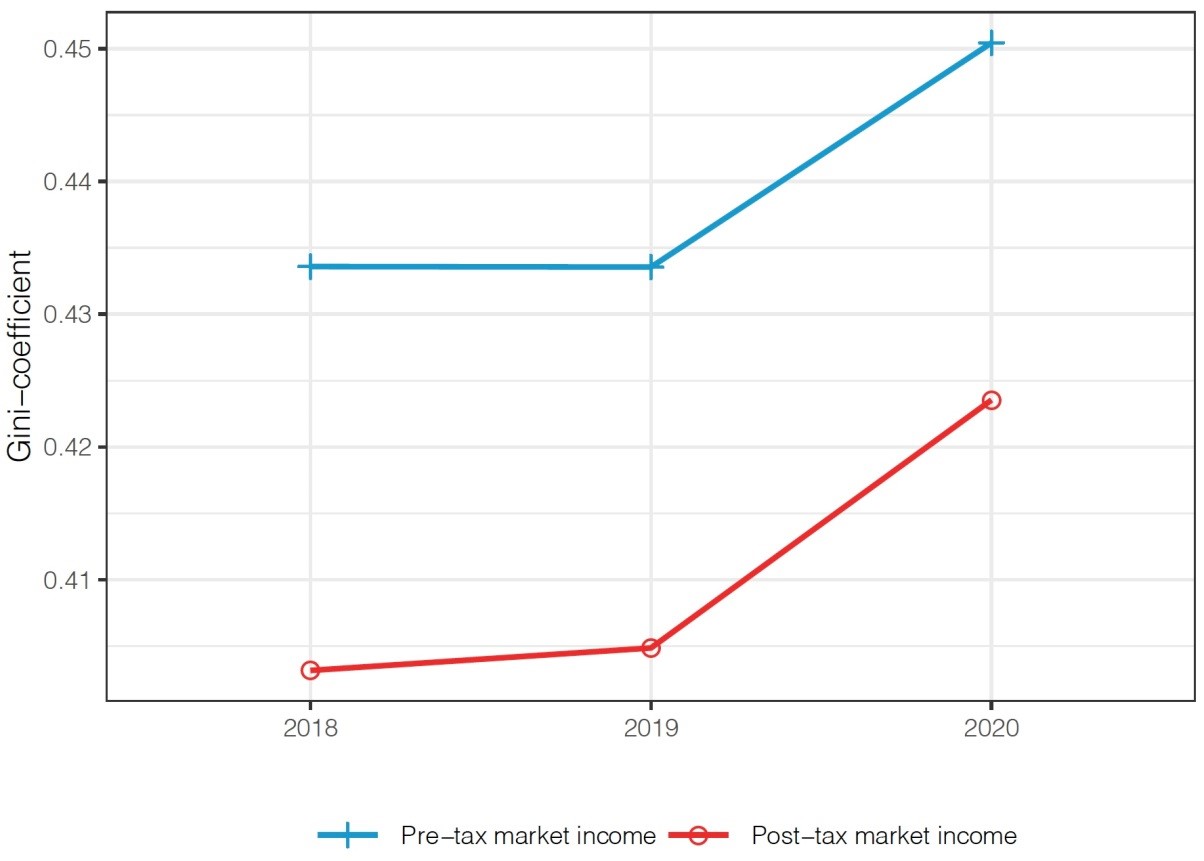
Concluding remarks
Our analysis of administrative tax registers show that the Covid-19 pandemic has increased income inequality in Sweden. Government support policies mitigated the increase, and simulations show that without them, inequality would have increased two-three times more. We also find suggestive evidence that if the Swedish government would have distributed the amount of support differently, inequality might even have decreased during the pandemic, as seen in some other Western economies.
2 agosto 2021
DENNIS BONAM, ANDRA ISABELA SMĂDU
The long-run effects of pandemics on inflation: Why this time may be different
(synthesis; full article 18 July 2021 – https://voxeu.org/article/long-run-effects-pandemics-inflation)
Abstract: How did past major pandemics affect inflation dynamics? This column estimates the long-run effects of pandemics on trend inflation in Europe using historical data since the 14th century. We find that, following a pandemic event, trend inflation falls steadily below its initial level for nearly a decade. This long-run depressing effect is also observed in major individual European countries – France, Germany, Italy, the Netherlands, and the UK. The authors conclude by discussing why the effects of the COVID-19 pandemic on inflation could play out differently this time around.
Keywords: COVID-19 pandemic, inflaction dynamics, economic contractions,
How will inflation dynamics unfold following the COVID-19 pandemic? This question has recently attracted a lot of attention in both policy and academic circles, yet it is difficult to answer because pandemics are a mix of demand and supply shocks that drive inflation in opposite directions (Baqaee and Farhi 2020). Moreover, the extent to which the pandemic affects inflation further depends on hysteresis effects, which leave permanent scars on the economy, and countries’ ability to adjust to the post-pandemic economy. Although inflation has recently picked up in some countries, this may likely be driven by transitory factors. The literature also provides little guidance, as it has focused mostly on the short-run economic impact of pandemics (e.g. Eichenbaum et al., 2020a, 2020b, 2020c, Brinca et al. 2020). Less is known about its potential long-run effects.
In our recent work (Bonam and Smădu 2021), we provide evidence about the long-run effects of pandemics on trend inflation in Europe. We use historical data since the 14th century (from Schmelzing 2020), which covers 19 major pandemic events and inflation series for six European countries: France (1387-2018), Germany (1326-2018), Italy (1314-2018), the Netherlands (1400-2018), Spain (1400-1729, 1800-2018), and the UK (1314-2018).
Given that aggregate European inflation (Figure 1) fluctuated strongly over the recent centuries, we focus on the Kalman-filtered trend of inflation. Using this series also helps isolate the impact of pandemics from the many short-run disturbances that affect inflation dynamics. The vertical lines in Figure 1 mark the end of major pandemic events. These dates are taken from Jordà et al. (2020) (hereafter ‘JST’), who classify major pandemics as pandemics resulting in at least 100,000 estimated deaths.
Figure 1 Aggregate (GDP-weighted) European inflation and pandemics, 1314-2018

Long-run effects of pandemics on trend inflation
Our empirical approach closely follows JST, who use a local projection model to study the effects of pandemics on the natural rate of interest. Our main contribution is that we focus instead on the impact of pandemics on trend inflation. As in JST, we include a dummy variable that equals 1 in years when a major pandemic ends.To control for other factors that might influence the behaviour of trend inflation, we include global GDP growth and a dummy accounting for wars resulting in more than 20,000 deaths (these data are all taken from Schmelzing 2020). Moreover, we add ten lags of these two control variables and of trend inflation.
We find that trend inflation falls significantly below its initial level for nearly a decade (Figure 2). This decline meets its trough after 13 years since the pandemic event has ended, at which point trend inflation is 0.6 percentage points lower than if the pandemic had not occurred. It takes about two decades before trend inflation reverts back to its pre-pandemic level. This striking result suggests that, historically, pandemics have had a significant and long-lasting effect on economic activity.
Figure 2 Response of trend inflation in Europe following a pandemic event
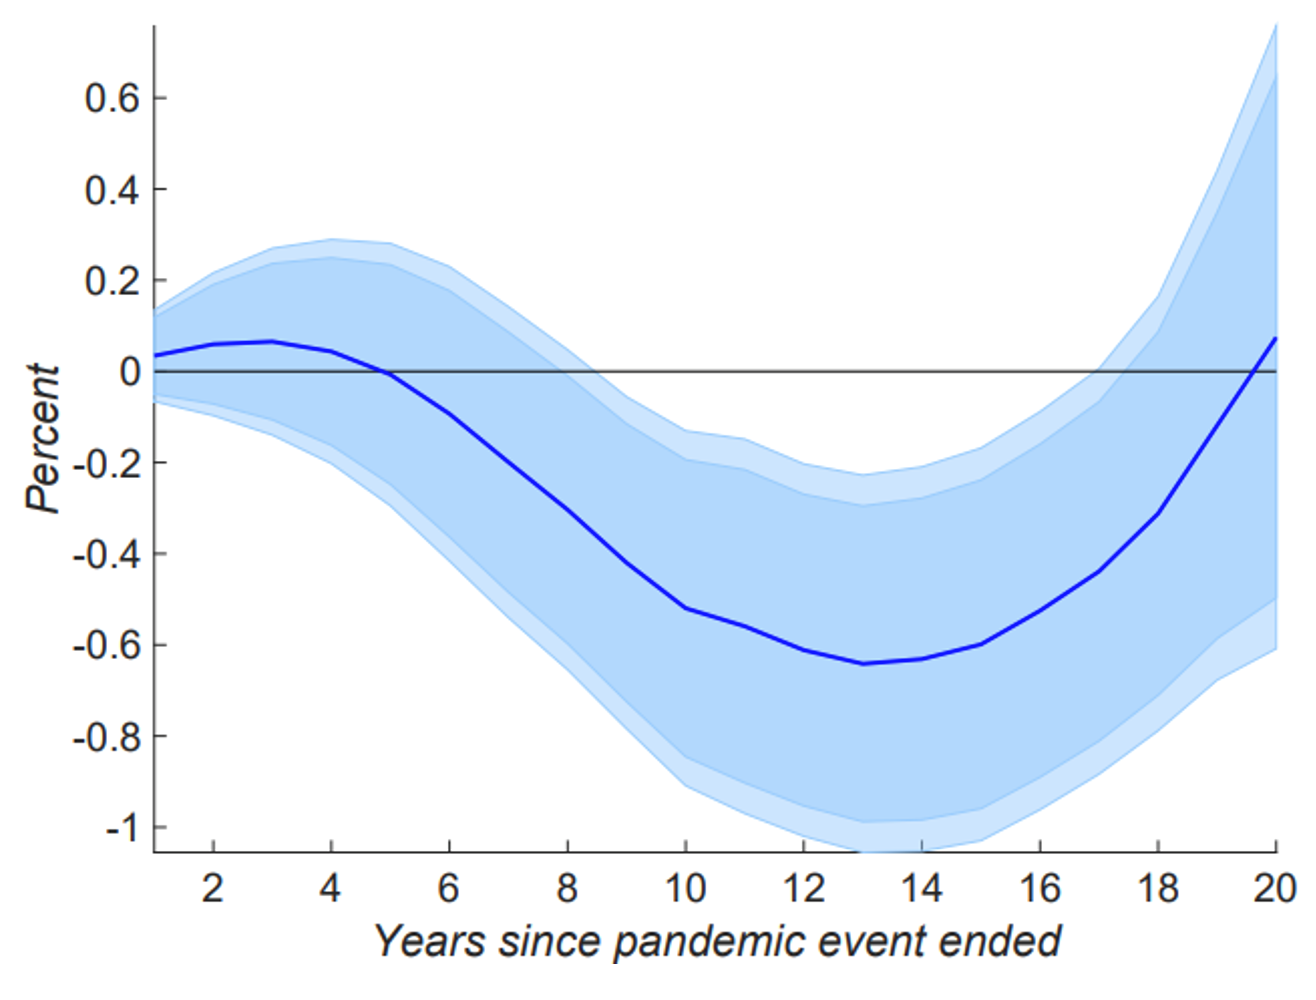
Note: Shaded areas represent the 90% and 95% confidence intervals.
This depressing effect of pandemics on aggregate demand may occur via heightened uncertainty that increases precautionary savings and lowers investment demand (Stiglitz 2020). This channel is consistent with Kozlowski et al. (2020) who show that the COVID-19 pandemic may entail long-run economic costs due to the ‘scarring of beliefs’, i.e. a persistent change in the perceived probability of extreme negative shocks in the future. Moreover, JST report a significant and persistent decline in the natural rate of interest following major pandemics, likely reflecting a rise in (precautionary) savings and decline in investment demand. Finally, if nominal and real frictions hinder an efficient reallocation of resources needed to adjust to the post-pandemic economy, productivity might drop (Bilbiie and Melitz 2020), exerting downward pressure on potential output and, ultimately, trend inflation.
While our model assumes time-invariant coefficients, structural changes (including in the monetary and fiscal regimes) are likely over the span of 700 years, which may bias our results. Nevertheless, our findings survive several robustness checks. First, the long-run decline in trend inflation following a pandemic is observed not only at the aggregate level, but also in several major European countries (Figure 3), except for Spain. Second, by splitting the data based on the duration and severity of the pandemics in our sample, we show that the more prolonged and severe are pandemics, the more pronounced and persistent are the associated negative effects on trend inflation (Figure 4).
Figure 3 Response of trend inflation following a pandemic event: country-specific results

Note: Shaded areas represent the 90% and 95% confidence intervals
Figure 4 Response of trend inflation following a pandemic event: conditioning on duration and severity of the pandemic
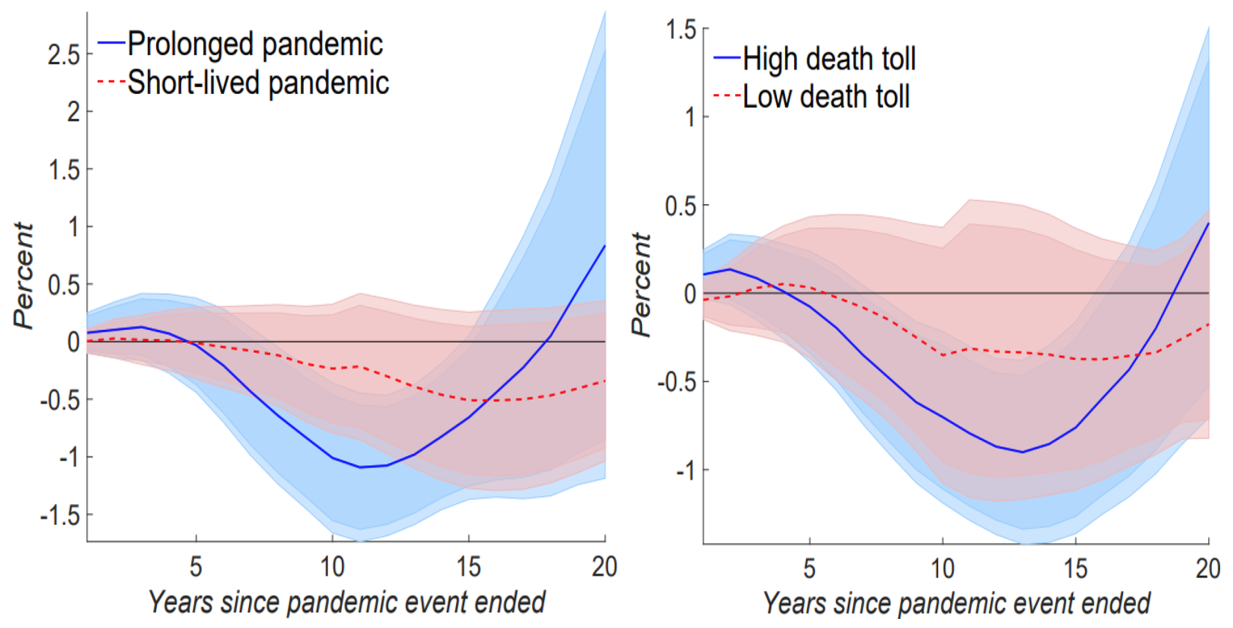
Note: Shaded areas represent the 90% and 95% confidence intervals
Finally, as in JST, we compare the impact on trend inflation of both pandemics and wars. As shown by Figure 5, while pandemics tend to exert a negative impact on trend inflation, wars have historically been followed by a persistent rise in underlying inflation. This qualitative difference between the impact of wars and pandemics on inflation substantiates that our results are driven by pandemics and not wars. As argued by Daly and Chankova (2021), wars typically spurred aggregate demand through debt-financed war- and reconstruction-related expenditures, yet impaired aggregate supply through the destruction of physical capital, thereby fuelling investment demand during the post-war years. Also, governments often relied on money printing and inflation to cover war-related costs, avoid debt issuance and potential surges in interest rates (Rockoff, 2015).
Figure 5 Response of trend inflation following a pandemic and war event
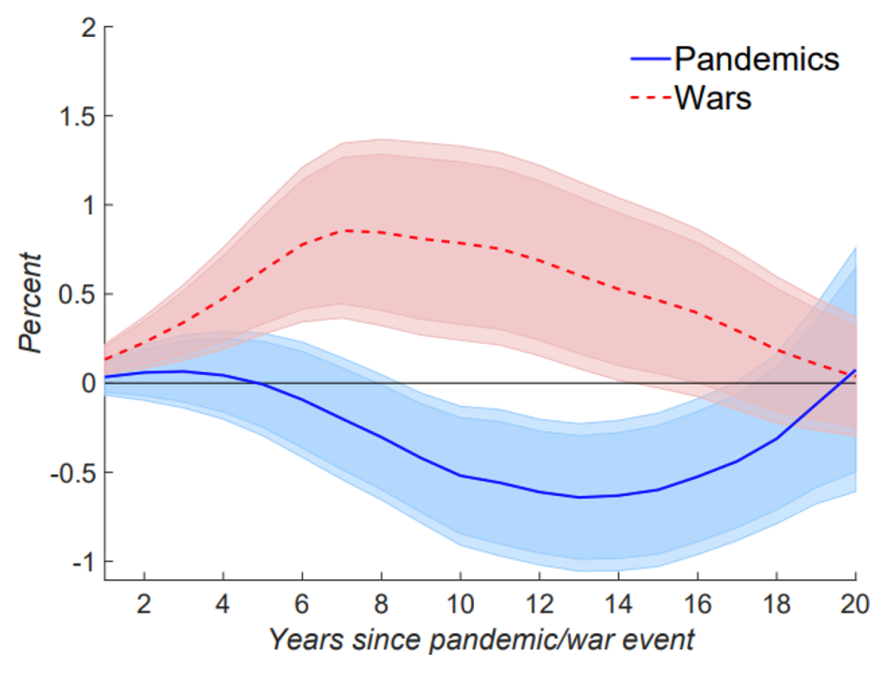
Note: Shaded areas represent the 90% and 95% confidence intervals
Discussion
While our results do not bode well for the foreseeable future, the response of trend inflation to the COVID-19 pandemic might be different this time around. First, both fiscal and monetary authorities have responded to the pandemic with unprecedented heft. Governments worldwide engaged in large-scale stimulus measures to prevent mass layoffs and bankruptcies, and avoid costly worker-firm separations, while monetary policy has been exceptionally accommodative to prevent a sharp tightening of credit conditions and liquidity shortages. These policies have likely alleviated the adverse economic effects of the pandemic, and can even lead to a rise in (headline) inflation if maintained beyond the health crisis. Second, the swift arrival of several vaccines for the SARS-CoV-2 virus already allowed for lockdown measures to be gradually wound down in many countries, which supports the rebound in economic activity as households unlock their savings and release pent-up demand. Third, although retail store and workplace closures have had a detrimental effect on sales in some sectors, other sectors were less affected, for example given the ability to work from home or because firms found alternative ways to conduct their businesses (Brinca et al. 2020). The resilience of the business sector and the asymmetric impact of the pandemic on economic activity vary across countries, yet they might help smooth out the overall impact on inflation. Finally, pressures stemming from pandemic-related disruptions, and rising transport and packaging costs (reflecting surging commodity prices) could eventually be passed onto consumers, especially if firms cannot afford to further squeeze mark-ups. As the COVID-19 pandemic continues to unfold, it is too early to tell which factors will ultimately dominate inflation dynamics
26 luglio 2021
LIN MA, GIL SHAPIRA, DAMIEN DE WALQUE, QUY-TOAN DO, JED FRIEDMAN, ANDREI LEVCHENKO
The intergenerational mortality trade-off of COVID-19 lockdown policies in low- and middle-income countries
(synthesis; full article 19 July 2021 -https://voxeu.org/article/covid-19-lockdown-trade-low-and-middle-income-countries)
Abstract: There has been ongoing debate over what type of lockdowns are warranted to counter Covid-19 and whether the benefits justify the accompanying economic contractions. This column uses a macro-susceptible-infected-recovered model to show that the impact of economic contractions on child mortality in poorer countries combined with their younger demographic composition, as well as the greater community-related transmission and lower healthcare capacity in these countries, mean that under certain circumstances, lockdowns could actually increase overall (COVID-19 plus non-COVID-19) mortality for the lowest-income countries.
Keywords: COVID-19 pandemic, economic contractions, lowest-income countries, mortality.
At the start of the COVID-19 pandemic, governments across the world introduced unprecedented lockdown policies to contain disease transmission. Lockdown severity was remarkably similar across countries at different levels of development. On a scale of 0 to 100, the mean Oxford–Blavatnik lockdown stringency index in April 2020 was 79 in low-income countries, and 78 in high-income countries (Hale et al. 2021).
A debate soon erupted on what type of lockdowns were warranted and whether the benefits of such policies justified the accompanying dramatic economic contractions (Mobarak 2020). In a recent paper, we cast new light on this debate by focusing on an intergenerational mortality trade-off we argue is inherent in pandemic mitigation as the disease and the lockdown policies affect the mortality of younger and older people differently (Ma et al. 2021).
In the early days of the pandemic, evidence emerged that COVID-19 mortality risk increases substantially with age (Verity et al. 2020). On the other hand, previous research has shown that infant and child mortality in low- and middle-income countries is higher during economic contractions (Baird et al. 2007). Thus, in developing countries a lockdown would be expected to save the lives primarily of older adults, perhaps at the cost of higher child mortality due to severe reductions in aggregate economic activity (if shocks to household income were not compensated by other assistance).
To formalise and quantify this trade-off, our analysis relies on a macro-susceptible-infected-recovered disease transmission model that features agents whose behaviours vary by age group and a country-group-specific relationship between economic downturns and child mortality.
Low-income, middle-income, and high-income countries differ along several relevant dimensions:
- First, economic contractions raise child mortality in poorer countries, but not in rich ones. We estimate that a percent decrease in per capita GDP can increase under-five mortality by up to 0.15 deaths per 1,000 children in low-income countries.
- Second, the demographic composition of poorer countries features a larger ratio of young children to old people. Since survival rates of the former may be diminished by an economic downturn while the latter are most vulnerable to dying from COVID-19, a lockdown in lower-income countries could lead to more recession-induced deaths per COVID-19 fatality averted, other things equal.
- Third, the preponderance of community-related transmission in low-income countries, as opposed to work or market-place transmission, might render government-mandated lockdowns comparatively less effective at reducing the spread of infections.
- Finally, low healthcare capacity in poorer countries lowers the benefits from ‘flattening the curve’ with lockdowns as hospitals are quickly overwhelmed since the average number of hospital beds per capita in high-income countries is seven times higher than in low-income countries.
Our model is calibrated to data for 85 countries across all income levels. We then simulate economic and disease-related outcomes in two scenarios: one with no government intervention and one in which a uniform seven-week lockdown is implemented in all countries. The simulations suggest that, relative to the no-intervention scenario, the uniform lockdown could, under certain circumstances, lead to 1.76 children’s lives lost due to the economic contraction per COVID-19 fatality averted in low-income countries. That is, lockdowns could, under certain circumstances, actually increase the overall (COVID-19 plus non-COVID-19) mortality for the lowest-income countries.
The ratio stands at 0.59 and 0.06 in lower-middle-income and upper-middle-income countries, respectively. The specific lockdown used in the simulations was chosen to mimic policies adopted during the early months of the pandemic but is not designed to capture all the complexities of mobility and social gathering restrictions imposed by countries.
Rather, the simulations aim at highlighting the large heterogeneity in outcomes following a uniform policy. The fundamental mortality trade-off across the different ages would apply also to different types of lockdowns.
Our analysis relies on the epidemiological information that was available in March-April 2020 when the first lockdown decisions were taken. As such, it ignores the introduction of vaccines – unfortunately still not yet sufficiently available in low-income countries – as well as the emergence of newer likely more infectious variants (Davies et al. 2021), which confers a global public good quality to domestic mitigation policies.
Our paper highlights and quantifies a trade-off between human lives, namely children vs. adults. The results are consistent with work documenting falling living standards (Egger et al. 2021) and food insecurity (Drèze and Somanchi 2021) in developing countries in the past year as a partial consequence of lockdown policies.
It is important to stress that our analysis does not imply that lockdown policies should not be implemented in low-income countries. Rather, it highlights how the trade-offs differ for countries of different income levels. We find that lockdowns would still be needed, but those that would take the aforementioned trade-offs into account naturally tend to be shorter and milder in low-income countries.
Finally, to mitigate some of the worst potential outcomes, the negative impacts on child mortality and household poverty of lockdown policies necessary to protect older individuals could be attenuated or mitigated using targeted social assistance, such as cash transfers, towards poor households and families with young children and pregnant women.
19 luglio 2021
JONGRIM HA, M. AYHAN KOSE, FRANZISKA OHNSORGE
Inflationary pressures: Likely temporary but challenging for policy design
(synthesis; full article – Vox Eu CEPR 14 July 2021 – https://voxeu.org/article/inflationary-pressures-likely-temporary-challenging-policy-design)
Abstract: Global inflation has rebounded from last year’s lows faster and sooner than after any previous global recession in the past five decades. This column presents model- and survey-based estimates which suggest that global inflation will rise by about 1-1.4 percentage points this year, pushing it above target in about half of inflation-targeting emerging market and developing economies. This may not be reason for concern provided the increase is temporary and inflation expectations remain well-anchored. However, even if temporary, higher global inflation may complicate the near-term policy choices of economies that still rely on expansionary support measures to ensure a durable recovery.
Keywords: COVID-19 pandemic, global inflaction, global recession, monetary policies, price pressures.
Global inflation has been on a roller-coaster ride since the beginning of the global recession triggered by the COVID-19 pandemic. The decline in inflation during the 2020 global recession was the most muted and shortest-lived of any of the five global recessions over the past 50 years. The increase in inflation since May 2020 has been faster and sooner than after previous global recessions, including after the 2009 global recession (Figure 1).
Looking ahead, as the global economy gradually reopens, monetary and fiscal policies continue to be accommodative to support the global recovery, and pent-up demand may be about to be unleashed in advanced economies. For major advanced economies, concerns have been raised that the confluence of these factors may generate significant inflationary pressures (Summers 2021, Blanchard 2021). Others, in contrast, see little reason for concern, at least for many advanced economies, because of the temporary nature of price pressures, well-anchored inflation expectations, and structural factors still depressing inflation (Ball et al. 2021, Gopinath 2021, Krugman 2021).
Against this backdrop, in this column we briefly address the following questions:
What have been the main drivers of recent developments in global inflation?
What are the prospects for global inflation?
What are the near-term policy priorities?
Figure 1 Global inflationary pressures
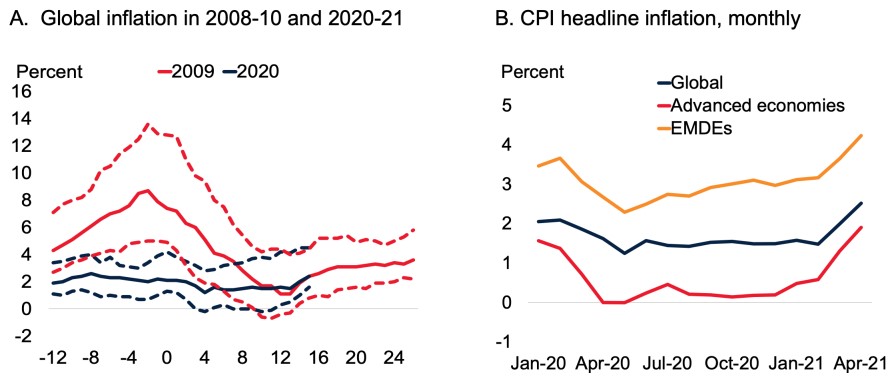
Sources: Haver Analytics, IMF International Financial Statistics, Ha, Kose, and Ohnsorge (2019, 2021a, 2021b).
Note: A. Blue and red lines are medians, dotted lines are interquartile ranges. t=0 is September 2008 for 2009 and January 2020 for 2020; B. Median of year-on-year headline consumer price index (CPI) inflation in a sample of 81 countries, of which 31 are advanced economies and 50 are EMDEs.
Drivers of recent developments in global inflation
The COVID-19 pandemic plunged the global economy into its deepest recession since WWII (World Bank 2021a, 2021b). At the height of the global recession, between January and April 2020, global inflation – defined as median consumer price inflation among 81 countries – declined by 0.9 percentage points amid a collapse in demand and plunging oil prices. Since May 2020, however, global inflation has picked up as oil prices rebounded and demand recovered. By April 2021, global inflation had risen above pre-pandemic levels globally, in advanced economies and in emerging market and developing economies (EMDEs) (Figure 1). This inflation pickup was broad-based, present in four-fifths of countries.
Plunges in aggregate demand, oil price declines, and supply disruptions contributed to global inflation developments during the pandemic. For EMDEs, global shocks were in part channelled into domestic inflation rates through exchange rate movements, compounding the impact of domestic supply shocks as lockdowns disrupted services activity and food supply chains. Larger depreciations, especially during the period of financial market stress in March and April 2020, were a key source of inflationary pressures in EMDEs.
- Plunge in aggregate demand. Lockdowns and weaker consumer confidence triggered a collapse in aggregate demand along with global trade. Global activity reached its trough in mid-2020 and subsequently recovered, supported by unprecedented policy measures (World Bank 2021a, 2021b).
- Oil price collapse. Between late-January and mid-April 2020, amid the pandemic-induced global recession, oil prices plunged by more than 60% as lockdowns disrupted transport and travel, which account for two-thirds of global energy consumption (Wheeler et al. 2020). Oil prices recovered from May onwards and are now near their pre-pandemic level.
- Supply disruptions. Especially early in the pandemic, lockdowns disrupted economic activity, particularly in services sectors. In some countries, especially low-income one, supply disruptions such as market and trade restrictions or curfews appear to have affected domestic food supply chains, increasing wholesale and retail markups and contributing to rising food price inflation (Swinnen and McDermott 2020). We estimate the role of each of these factors in a factor-augmented vector autoregression (FAVAR) model that consists of global inflation, global output growth, and oil prices (Ha et al. 2021a). The results suggest that the decline in global inflation from January-May 2020 was four-fifths driven by the collapse in global demand and one-fifth by plunging oil prices, with some offsetting inflationary pressures from supply disruptions. This contrasts with the 2009 global recession, in which a 13-month decline in global inflation was three-fifths driven by plunging oil prices and only one-third driven by falling global demand. In their rebounds, however, inflation developments after the end of two global recessions resembled each other – both were virtually entirely driven by sharp rebounds in global demand.
Figure 2 Drivers of global inflation
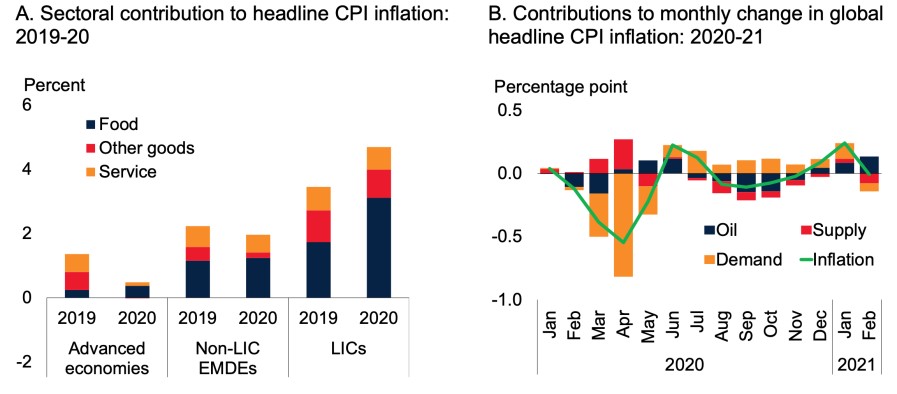
Source: Ha, Kose, and Ohnsorge (2019, 2021a, 2021b), International Monetary Fund, World Bank.
Note: A. CPI = consumer price index; EMDEs = emerging market and developing economies; LICs=low income countries. Cross-country medians unless otherwise specified. Median headline CPI inflation (annual averages) in 12 sectors across 147 countries. Sectors are categorized following the IMF;B. Contributions to changes in year-on-year headline consumer price inflation from the previous month for 81 countries, of which 31 are advanced economies and 50 are EMDEs, based on factor-augmented vector autoregression (FAVAR) estimation. Monthly data. Residual is omitted from the graph.
Prospects for global inflation
Model-based conditional forecasts based on the FAVAR estimation point to a 1.4 percentage point increase in global inflation between 2020 and 2021. For these exercises, global output growth is assumed to be 5.6% and oil prices average $62/bbl in 2021 (World Bank 2021b). Survey-based inflation expectations point to a 1 percentage point increase in 2021 (Figure 3). For virtually all advanced economies and half of inflation-targeting EMDEs, an increase of this magnitude would leave inflation within target ranges. Even for the half of inflation-targeting EMDEs where it would raise inflation above target ranges, this increase may be temporary and would not warrant a monetary policy response as long as inflation expectations remain well-anchored.
Inflation is expected to moderate beyond 2021 as global growth settles at a lower level, commodity prices stabilise, and supply bottlenecks are eased. Long-term expectations also point to continued low and stable inflation. However, several structural forces – such as demographic changes and expanding global supply chains – that have depressed inflation over the past five decades are beginning to fade (Ha et al. 2021b). As they recede, increases in short-term inflation may become more persistent, and thus threaten the anchoring of long-term inflation expectations.
Figure 3 Inflation prospects
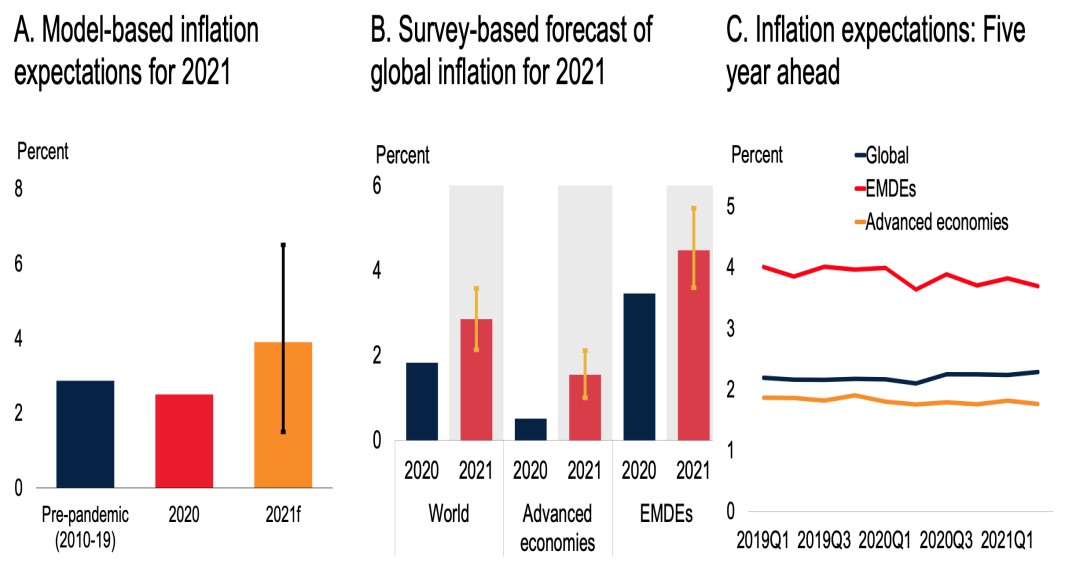
Sources: Consensus Economics; IMF World Economic Outlook; Ha, Kose, and Ohnsorge (2019, 2021a , 2021b).
Note: A. Conditional forecast of global inflation based on quarterly factor-augmented VAR model of global inflation, global GDP growth, and oil price growth. Vertical line indicates 16-84 confidence bands; B. Average headline CPI inflation expectations for 2021 based on surveys of May 2021 in 57 countries (31 advanced economies and 26 EMDEs). 2020 indicates actual inflation rates. Yellow whiskers indicate maximum and minimal responses; C. Median five-year-ahead consensus inflation expectations among 24 advanced economies and 23 EMDEs.
Policy priorities
Facing growing inflationary pressures, financial market participants may become concerned about persistently higher inflation in advanced economies and may reassess prospects for continued accommodative monetary policies by major central banks. This could trigger a significant rise in risk premia and borrowing costs. EMDEs are particularly vulnerable to such financial market disruptions because of their record high debt and a lagging economic recovery from the pandemic. In the event of financial market stress, sharp exchange rate depreciations and capital outflows may force them to abruptly tighten policies in a manner that could throttle their recoveries. Anchoring inflation expectations will be critical in preserving central banks’ room to manoeuvre even during periods of financial stress.
Even if temporary, higher global inflation may complicate the policy choices of EMDEs in the near term as some of them still rely on highly accommodative policies to ensure a durable recovery. Depending on where they are in the recovery, they need to carefully calibrate their monetary and fiscal policies. For example, in inflation-targeting EMDEs with large economic slack and below-target inflation, monetary easing and fiscal support can help the recovery gain traction and raise inflation towards the target. In EMDEs where the economic recovery from the pandemic is further advanced, a more nuanced design of monetary policy will likely be necessary. While it may be premature to withdraw monetary and fiscal support, it would be prudent to prepare now for the possibility of future inflation risks materialising, especially those related to sharp movements in foreign currency markets. These economies can embark on an opportunistic build-up of foreign exchange reserves, heighten foreign currency risk monitoring, and strengthen macroprudential policies in anticipation of possible capital outflows once advanced economies begin to withdraw accommodative policies. Central banks’ responses have been instrumental in dampening the COVID-19 shock (English et al. 2021). Going forward, their communication will be even more closely scrutinised amid concerns over inflationary pressures. To avoid mishaps that could trigger financial stress, central banks will need to clearly communicate their policy objectives and improve transparency (Baldwin and di Mauro 2020). In countries that employ unconventional policies, forward guidance, transparent objectives, and operational details can help maintain investor confidence.
1 luglio 2021
CLARA VON BISMARCK-OSTEN, KIRILL BORUSYAK, UTA SCHӧNBERG
School closures did not contain the spread of the coronavirus in Germany
(synthesis; full article – Vox Eu CEPR 08 May 2021 -https://voxeu.org/article/school-closures-did-not-contribute-spread-coronavirus-germany)
Abstract: Deciding whether to close schools to contain the spread of Covid-19 requires balancing the harm such closures inflict on families against their effectiveness in stopping the spread of disease. This column provides evidence from Germany that school closures did not contain infections among young people or adults in the summer of 2020 – when infection rates were low – or during the pandemic’s autumn resurgence. Thus, the benefits of school closures may not outweigh their costs to children and parents, particularly mothers.
Keywords: COVID-19 pandemic, spread of pandemic, pandemic’s resurgence, infection rates, school closures.
School closures are among the most controversial policies used to fight the pandemic, as their costs loom large. Prolonged teaching disruptions affect not only children’s learning outcomes but also their psychological and emotional development, with children from low socio-economic backgrounds particularly hurt (Engzell et al. 2020, Grenewig et al. 2020). School closures are also detrimental for the careers of parents who take on more educational responsibilities and have to reduce the number of hours worked (Fuchs-Schündeln et al. 2020). Since women typically shoulder most of the childcare responsibilities, school closures may also widen the gender wage gap (Alon et al. 2020).
These costs of school closures should be weighed against the potential benefits of reduced transmission of the virus. In Germany, as in other European countries, the share of children among COVID-19 cases increased around the time the new school year started, and those events have often been linked to each other in the press. The fear that schools constitute ‘hotspots’ of transmission has been fueled by reports of outbreaks in schools. But to guide policy, it is important to zoom out from the anecdotal or small-sample evidence and identify the causal effect of school closures and reopenings on aggregate infections.
Causal inference is challenging here because the decision to close schools is typically made in response to rising infections in the local area or country. Moreover, in many cases, school closures were enforced at the same time as other containment measures (e.g. Dehning et al. 2020), making it difficult to isolate the impact of schools.
Quasi-experimental studies address both drawbacks by leveraging a source of variation unrelated to the course of the pandemic. In von Bismarck-Osten et al. (2021), we compare the evolution of infection rates from 415 districts across Germany that entered school holidays at different times in the summer and fall of 2020, in what is called an ‘event study’. This strategy makes a causal interpretation of the estimates possible, as the timing of holidays was set years in advance, unaltered by the pandemic, and did not coincide with other containment measures.
More specifically, we implement the event study on the country-wide data by applying the novel ‘imputation’ estimator by Borusyak et al. (2021). Recent literature has shown that conventional event study estimation – i.e. by Ordinary Least Squares (OLS) with unit and period fixed effects and some lags and leads of treatment – produces estimates that are not reliable in the presence of effect heterogeneity, and potentially even have the wrong sign (e.g. Goodman-Bacon 2020). The imputation estimator produces a desired average of treatment effects and has attractive efficiency properties relative to other robust estimators (e.g. de Chaisemartin and D’Haultfoeuille 2020, Sun and Abraham forthcoming).
We consider three events separately: the summer and fall closures and the summer re-openings. Comparing the dynamics of infection rates around each event yields a consistent picture, suggesting there was little impact made by schools.
The summer school closures do not appear to have had a containing effect on infections in either the school population or older generations in a period of low infection rates. A similar finding for the fall holiday closures suggests that school closures are no more effective at more advanced periods of the pandemic (with the raw data and our estimates shown in Figure 1).
Figure 1 The impact of the fall school closures on children aged 5–14
A) Raw data
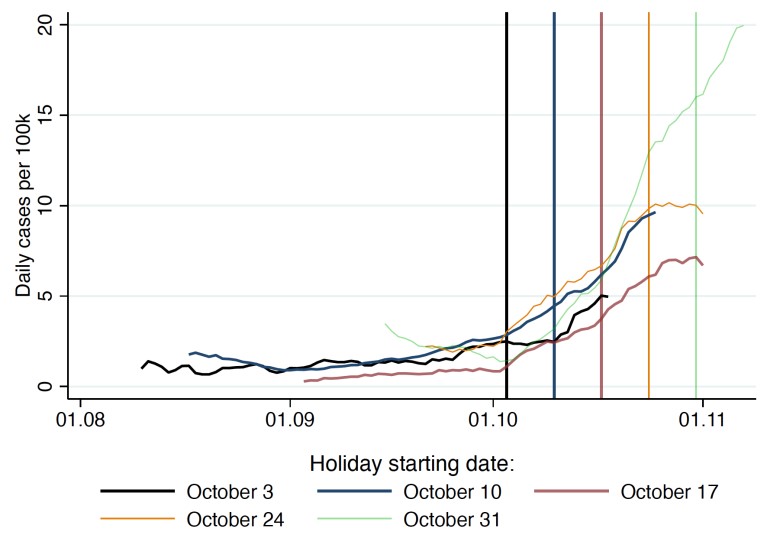
B) Estimates
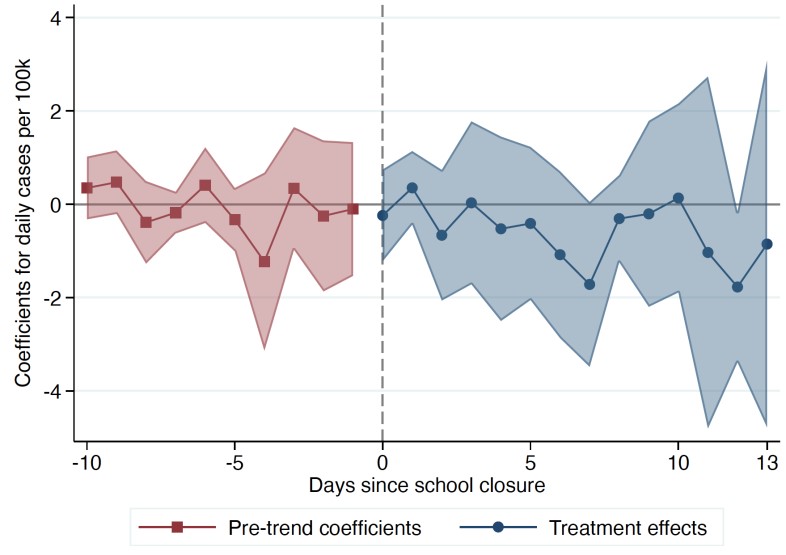
Notes: Panel A displays smoothed daily cases per 100,000 in the age bracket 5–14 years. Districts are grouped by the fall-holiday starting date. Panel B displays the corresponding estimates of the effects of school closures on the same outcome (blue dots), together with a test for parallel trends between districts where schools closed at different times (red squares). Districts in Bavaria are excluded in Panel B.
In line with our results on school closures, we find concerns about the return to full-schooling capacity after the summer holidays to be unsubstantiated. Infections among children and adults did not rise with the start of the new academic year (a result also shown in a complementary paper by Isphording et al. 2021). Instead, infections appear to have increased in the last weeks of the summer holidays and declined in the days after reopening (see Figure 2). We consider this to be best explained by the higher risk of infection among families returning home from their travels shortly before the summer holidays ended, and the increased testing of those families.
Figure 2 The impact of the summer school reopenings on children aged 5–14
A) Raw data
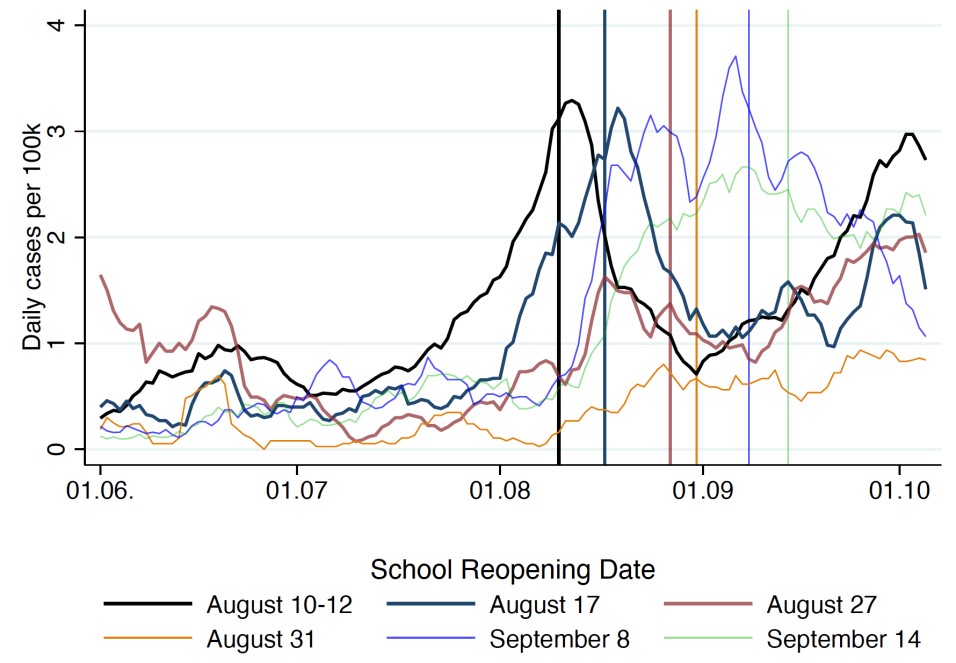
B) Estimates
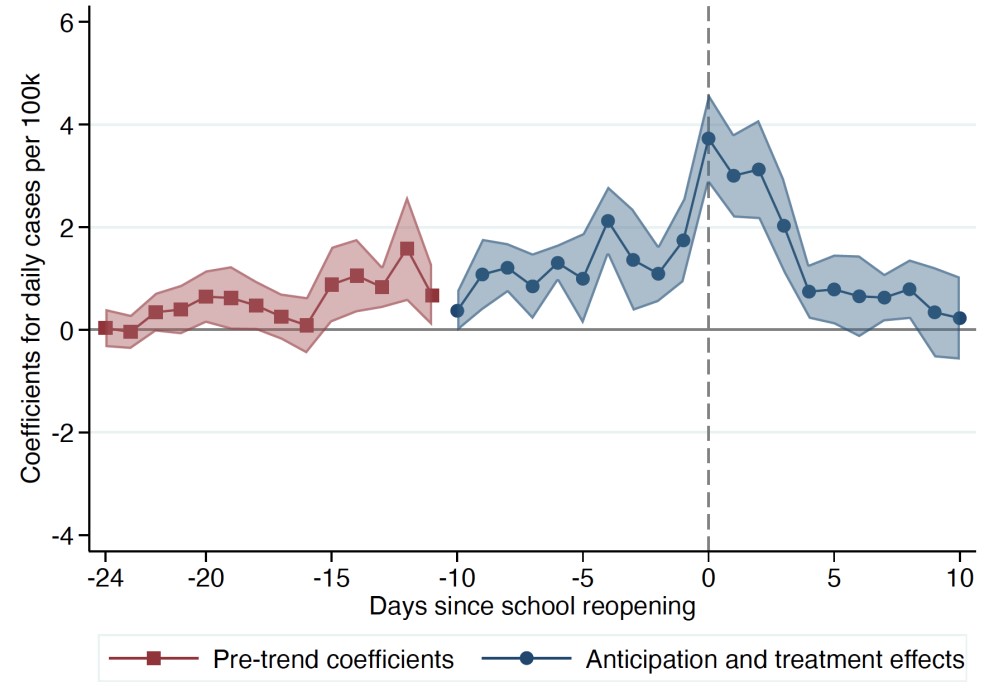
Notes: Panel A displays the smoothed daily cases per 100,000 in the age bracket 5–14 years, grouping districts by the school reopening date after the summer holiday. Panel B displays the corresponding estimates of the effects of school reopening on the same outcome, including anticipation effects (blue dots), together with a test for parallel trends between districts where schools reopened at different times (red squares). Districts in Bavaria and Baden Wuerttemberg are excluded in Panel B.
We acknowledge that our study period precedes the emergence of allegedly more transmissible variants of the virus (such as the British B.1.1.7 strain) and precedes vaccination efforts, both of which are likely to affect the transmission risk in schools, though in opposite directions.
While it is not our domain of expertise to explain why schools appear to play a subordinate role in the spread of SARS-CoV-2, epidemiological studies hint at several potential explanations. One possibility is that the measures introduced in German schools to avoid contagion have been effective. Alternatively, children could be less susceptible to infection (Davies et al. 2020), or less contagious than adults (Jones et al. 2020). Further epidemiological evidence on the relative role of such mechanisms would complement the policy implications of our paper.
21Giugno 2021
CHRISTIAN BOGMANS, ANDREA PESCATORI, ERVIN PRIFTI
Food (in)security: A potentially underrated collateral damage of the pandemic
(synthesis; full article -05 June 2021 – : https://voxeu.org/article/food-insecurity-potentially-underrated-collateral-damage-pandemic)
Abstract: Global food security is being threatened the COVID-19 pandemic and the restrictive measures to control it. Jammed food supply chains, falling incomes for some population segments, and rising food prices are placing food out of reach for millions of individuals. This column discusses the short-run relationship between food (in)security and income and food prices, and the implications of the current economic crisis for global hunger.The pandemic’s economic fallout risks setting us back a full decade on eliminating undernourishment, especially in low-income countries. Governments should strengthen social safety nets for the most vulnerable to keep inequality in check.
Keywords: COVID-19 pandemic, International food prices, Undernutrition, Food supply chains
Global food prices have surged during the pandemic, rising by 25% between May 2020 and April 2021, the longest rally in more than a decade (FAO, Figure 1). Additionally, food supply chains jammed domestically from logistical hiccups and labour shortages have put a wedge between producers and consumer food prices, raising the latter (Figure 1, bottom chart).
At the same time, lockdowns and other measures to contain the pandemic have led to a dramatic fall in incomes and a revision of medium-term growth forecasts, especially for low-income countries (Figure 2).
Figure 1 The impact of the pandemic on income and food prices
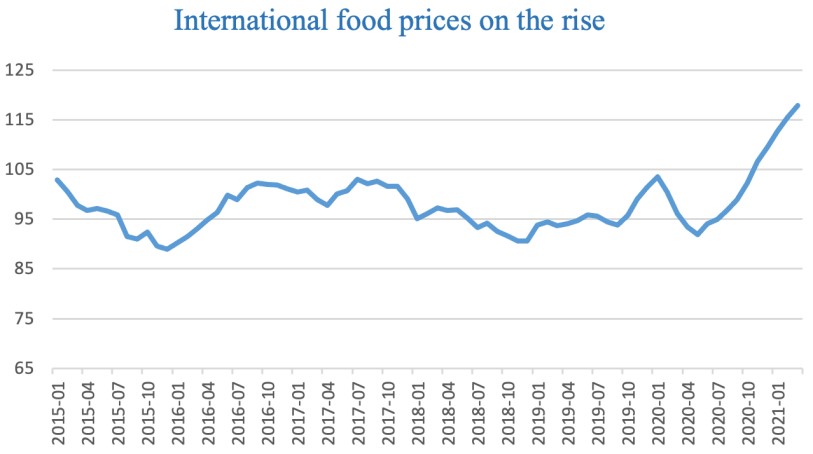
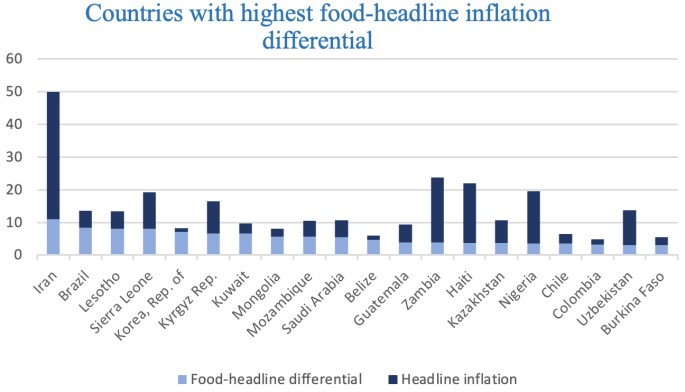
Figure 2 Output changes by group
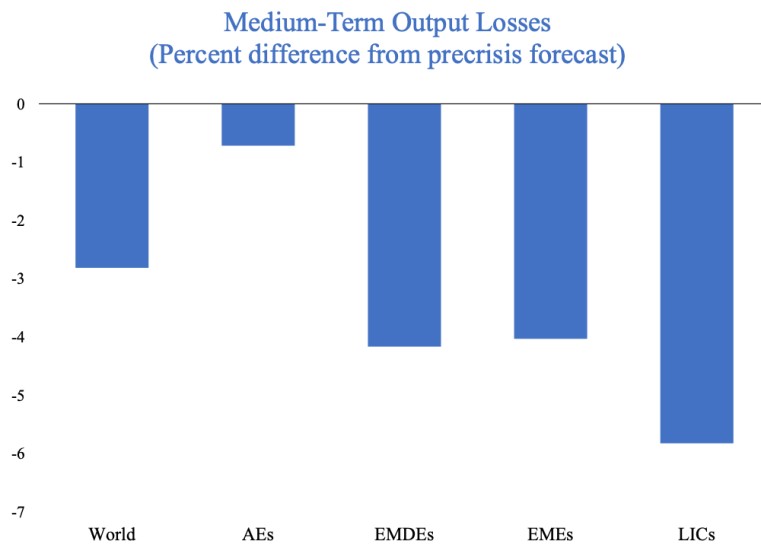
Source: IMF staff calculations.
This cocktail of factors risks erasing several years of progress in reducing undernourishment globally. To help shed light on this issue, we study the links between food security, income growth, and food prices over the economic cycle. We find that GDP growth, and to a lesser extent food inflation, are prominent macroeconomic determinants of food security in emerging market and developing economies. Hence, in absence of policy actions, the number of undernourished might increase by around 60 million globally, leading to one of the most dramatic collateral damages of the current pandemic (IMF 2021).
What is food (in)security?
Food security is a multifaced concept. It is commonly defined as people having continuous physical, social, and economic access to sufficient, safe, and nutritious food that meets their food preferences and dietary needs for an active and healthy life (Committee for World Food Security 2012).In absence of that, food insecurity arises. In practice, there are different ways of measuring food insecurity depending also on its degrees of severity, from worries about inadequate food quality to insufficient quantity.
Our study focuses on the prevalence of undernourishment, which measures the share of the population whose habitual food consumption lies below the minimum dietary energy requirement. From 2000 to 2019 the share of the global population that was undernourished declined substantially from 13.2% to 8.9%, respectively.The fast decline observed in the first decade of the century, however, started faltering in 2015. Before the pandemic struck, it is estimated that there were still more than 680 million people suffering from undernourishment (i.e. more than the entire population of North America).
Even though our study is focused on undernutrition, we try to capture other measurable aspects of food adequacy by looking at two diet composition variables: the share of dietary energy from cereals, roots, and tubers, and the average protein supply.As income per capita rises, diets shift from cereals to proteins (especially animal proteins). A change in diet forced by economic factors is often perceived as a descent into poverty as it is the first line of defence against rising food insecurity – a major factor behind social unrest.
Is food (in)security macro relevant?
Food (in)security may have significant repercussions on economic development. Undernourishment, especially if experienced in childhood, can have negative effects on physical and cognitive development. By limiting educational attainment and lifelong earning potential, it perpetuates inequality by keeping people in a poverty trap (Atinmo et al. 2009). At the aggregate level, if the phenomenon is widespread across the population, it can reduce a country’s human capital accumulation and, thus, its economic growth potential (Fogel 2004).
Indeed, the importance of food security has been formally recognised by the international community, which captured it in the United Nations Sustainable Development Goal 2 (aka Zero Hunger). SDG2 sets 2030 as the target for eliminating undernourishment – i.e. reducing the number of undernourished by more than 60 million per year, arguably a daunting task even without factoring in the pandemic.
Finally, history has shown repeatedly that rising food prices – and the resulting increased perception of food insecurity – can help trigger social unrest and toppled incumbent governments. When social unrest escalates into an armed conflict, like a civil war, poverty and hunger are further exacerbated.
What are the macro determinants of food (in)security?
Food security has two macroeconomic determinants related to the supply of food (i.e. availability) and households’ demand for food (i.e. access). The former depends on the abundance of per capita food supplies from domestic production, stocks, and imports of food. A true lack of food that would force a benevolent ‘social planner’ to ration is rarely a concern. History has shown that food is almost always available to those with buying power (Wiggins et al. 2009) – Amartya Sen observed that even in the severe Bengal famine of 1943, food was available (Tweeten 1999). We thus focus on changes in domestic food-price inflation to capture food supply shocks. Food access, on the other hand, relates to affordability that, for given food prices, depends on the interplay between per-capita real income and the shape of the national income distribution (i.e. inequality).
Four main candidate factors have, thus, been selected to explain changes in the prevalence of undernourishment and diet composition (Timmer 2000):
1) real GDP per capita growth (to capture household income);
2) food price inflation (to capture food supply shocks and external factors);
3) social transfers (government policies aimed at protecting the vulnerable segments of the population that act as countercyclical stabilisers); and
4) initial conditions.
We also investigate how the effect of real income growth varies along structural characteristics of the economy, such as the stage of economic development, and measures of inclusiveness, given by the income share of the bottom 20%.
Our annual data cover 143 countries from 2001 to 2018. Higher income tends to induce both a stark reduction in undernourishment and substitution away from cereals while increasing protein consumption (Figure 3). These insights from the descriptive evidence are confirmed in the econometric analysis. Our results suggest that economic growth is by far the largest driver of global undernourishment (Figure 4, top panel). A one-percentage-point increase in economic growth leads to an approximately 1% reduction in the share of undernourished in both the random and fixed-effects instrumental variables regressions.5
Figure 3 Undernourishment, income, and diets
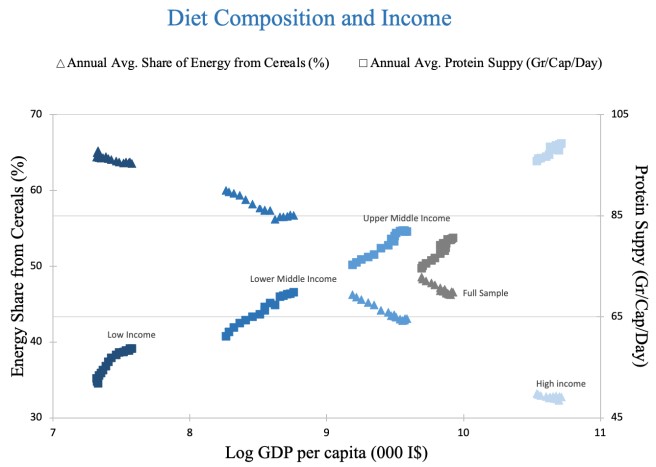
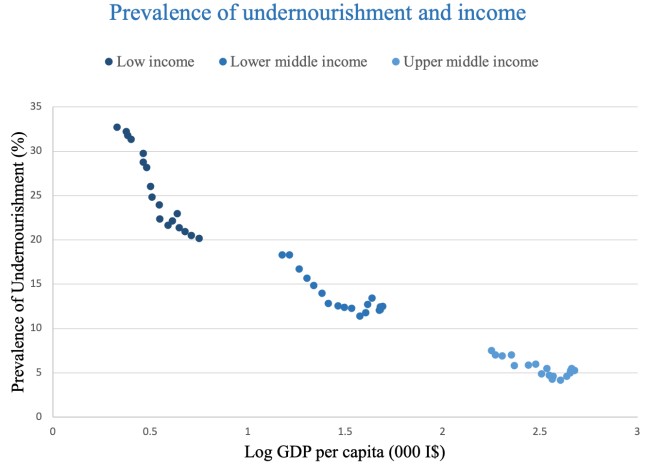
Figure 4 Macro determinants of undernourishment
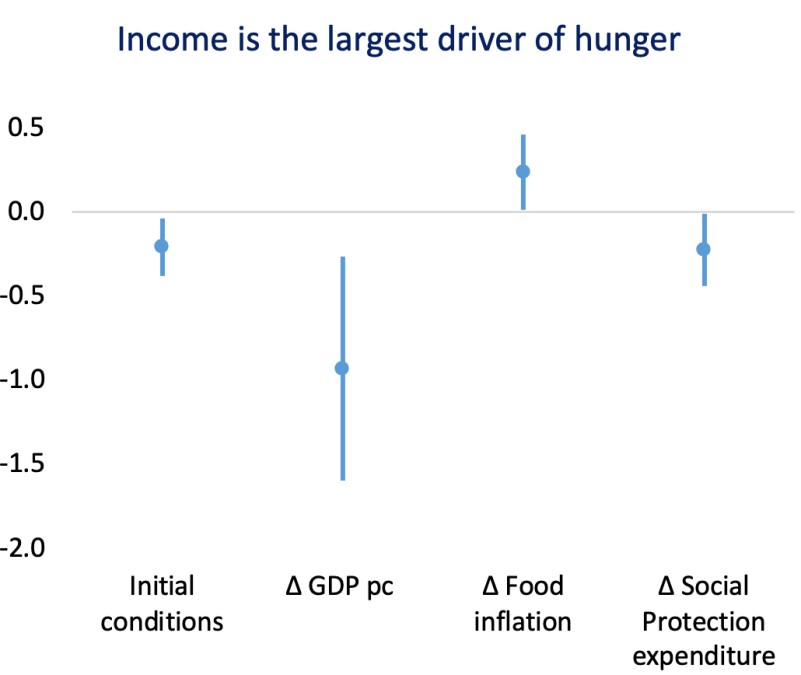
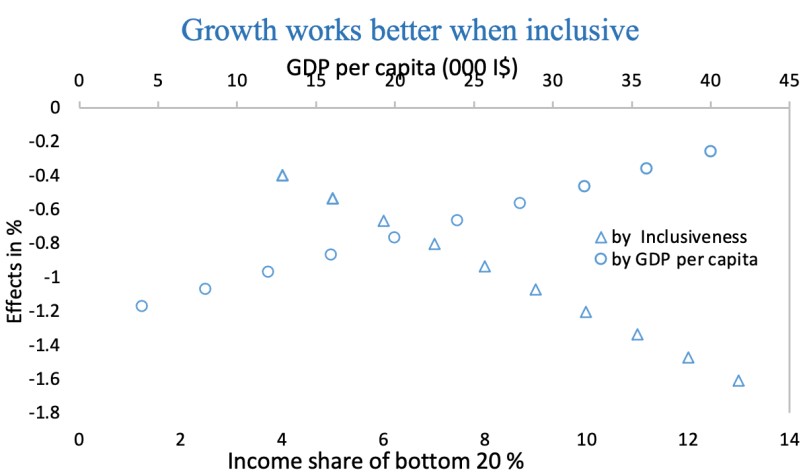
Note: In the top graph, vertical lines show 95% confidence intervals. In the bottom graph, the lower x-axis represents inclusiveness (income share of the bottom 20%). The upper x-axis shows GDP per capita (thousands of international dollars).
In our study, the elasticity of undernourishment to inflation is smaller than to GDP growth since, for a typical change in food inflation, the share of undernourished increases by about 0.24%. Social transfers, being in part directly targeted to the share of the population most vulnerable to food insecurity, have a significant direct impact in curbing undernourishment. A typical change in social protection expenditure has the same strength as food inflation, leading to a 0.22% reduction in undernourishment. Finally, we find that countries that start with higher levels of undernourishment at the beginning of our observation period exhibit a higher reduction rate, but the catching-up is slow in absence of other improvements. Thus, overall, there is little evidence of cross-country convergence.
Results of the heterogeneity analysis show that economic growth plays an important role in reducing hunger at the early stages of development and becomes less effective as countries grow richer (Figure 4, right panel). The higher income elasticity of hunger in middle- and low-income countries relates to the bigger share of the population that is closer to the undernourishment threshold and that shifts above or below that threshold as incomes fluctuate. Growth is more effective in reducing hunger in countries with more inclusive economic systems (proxied by the size of the bottom 20% share of national income). In other words, higher inequality reduces the elasticity of undernourishment to GDP growth.
Diet composition also matters for food security. Before descending into undernourishment when incomes decline, households change their diet by moving to cheaper staple foods and cutting (animal) protein consumption. This margin of adjustment is quantitatively relevant. A negative 1 percent GDP shock tends to increase cereal consumption (by 0.06%) and decrease protein consumption (by 0.55%), tilting the diet towards cereals.
Conclusions
The COVID-19 pandemic and its scars risk jeopardising the process of bringing the number of undernourished people to zero by 2030. In fact, econometric analysis suggests that real income changes are by far the largest driver of hunger, followed by food prices and social protection schemes. Absent policy interventions, the 2020 decline in income and increase in food prices would lead, respectively, to 57 million and 3 million increases in the number of hungry people, hitting especially low-income countries. The economic fallout from the pandemic risks setting us back a full decade on eliminating undernourishment.
Social protection, by complementing the income of the most vulnerable households, helps keep inequality under check. It is a valuable shield against income and food price shocks, as it reduces the elasticity of undernourishment to income shocks for a given level of economic development. Governments should thus strengthen safety nets for the most vulnerable and mitigate the risk of food-price spikes by guaranteeing the smooth functioning of food supply chains.
14 giugno 2021
CHRISTIAN BOGMANS, ANDREA PESCATORI, ERVIN PRIFTI
Food (in)security: A potentially underrated collateral damage of the pandemic
(synthesis; full article – Vox Eu CEPR 05 June 2021 – https://voxeu.org/article/food-insecurity-potentially-underrated-collateral-damage-pandemic )
Abstract: Global food security is being threatened by the COVID-19 pandemic and the restrictive measures to control it. Jammed food supply chains, falling incomes for some population segments, and rising food prices are placing food out of reach for millions of individuals. This column discusses the short-run relationship between food (in)security and income and food prices, and the implications of the current economic crisis for global hunger. The pandemic’s economic fallout risks setting us back a full decade on eliminating undernourishment, especially in low-income countries. Governments should strengthen social safety nets for the most vulnerable to keep inequality in check.
Keywords: COVID-19 pandemic, food chains, global food prices, social safety, inequality.
Global food prices have surged during the pandemic, rising by 25% between May 2020 and April 2021, the longest rally in more than a decade (FAO, Figure 1). Additionally, food supply chains jammed domestically from logistical hiccups and labour shortages have put a wedge between producers and consumer food prices, raising the latter (Figure 1, bottom chart).
At the same time, lockdowns and other measures to contain the pandemic have led to a dramatic fall in incomes and a revision of medium-term growth forecasts, especially for low-income countries (Figure 2).
Figure 1The impact of the pandemic on income and food prices
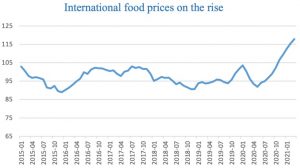
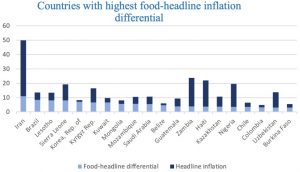
Figure 2 Output changes by group

Source: IMF staff calculations.
This cocktail of factors risks erasing several years of progress in reducing undernourishment globally. To help shed light on this issue, we study the links between food security, income growth, and food prices over the economic cycle. We find that GDP growth, and to a lesser extent food inflation, are prominent macroeconomic determinants of food security in emerging market and developing economies. Hence, in absence of policy actions, the number of undernourished might increase by around 60 million globally, leading to one of the most dramatic collateral damages of the current pandemic (IMF 2021).
What is food (in)security?
Food security is a multifaced concept. It is commonly defined as people having continuous physical, social, and economic access to sufficient, safe, and nutritious food that meets their food preferences and dietary needs for an active and healthy life (Committee for World Food Security 2012). In absence of that, food insecurity arises. In practice, there are different ways of measuring food insecurity depending also on its degrees of severity, from worries about inadequate food quality to insufficient quantity.
Our study focuses on the prevalence of undernourishment, which measures the share of the population whose habitual food consumption lies below the minimum dietary energy requirement. From 2000 to 2019 the share of the global population that was undernourished declined substantially from 13.2% to 8.9%, respectively. The fast decline observed in the first decade of the century, however, started faltering in 2015. Before the pandemic struck, it is estimated that there were still more than 680 million people suffering from undernourishment (i.e. more than the entire population of North America).
Even though our study is focused on undernutrition, we try to capture other measurable aspects of food adequacy by looking at two diet composition variables: the share of dietary energy from cereals, roots, and tubers, and the average protein supply. As income per capita rises, diets shift from cereals to proteins (especially animal proteins). A change in diet forced by economic factors is often perceived as a descent into poverty as it is the first line of defence against rising food insecurity – a major factor behind social unrest.
Is food (in)security macro relevant?
Food (in)security may have significant repercussions on economic development. Undernourishment, especially if experienced in childhood, can have negative effects on physical and cognitive development. By limiting educational attainment and lifelong earning potential, it perpetuates inequality by keeping people in a poverty trap (Atinmo et al. 2009). At the aggregate level, if the phenomenon is widespread across the population, it can reduce a country’s human capital accumulation and, thus, its economic growth potential (Fogel 2004).
Indeed, the importance of food security has been formally recognised by the international community, which captured it in the United Nations Sustainable Development Goal 2 (aka Zero Hunger). SDG2 sets 2030 as the target for eliminating undernourishment – i.e. reducing the number of undernourished by more than 60 million per year, arguably a daunting task even without factoring in the pandemic.
Finally, history has shown repeatedly that rising food prices – and the resulting increased perception of food insecurity – can help trigger social unrest and toppled incumbent governments. When social unrest escalates into an armed conflict, like a civil war, poverty and hunger are further exacerbated.
What are the macro determinants of food (in)security?
Food security has two macroeconomic determinants related to the supply of food (i.e. availability) and households’ demand for food (i.e. access). The former depends on the abundance of per capita food supplies from domestic production, stocks, and imports of food. A true lack of food that would force a benevolent ‘social planner’ to ration is rarely a concern. History has shown that food is almost always available to those with buying power (Wiggins et al. 2009) – Amartya Sen observed that even in the severe Bengal famine of 1943, food was available (Tweeten 1999). We thus focus on changes in domestic food-price inflation to capture food supply shocks. Food access, on the other hand, relates to affordability that, for given food prices, depends on the interplay between per-capita real income and the shape of the national income distribution (i.e. inequality).
Four main candidate factors have, thus, been selected to explain changes in the prevalence of undernourishment and diet composition (Timmer 2000):
1) real GDP per capita growth (to capture household income);
2) food price inflation (to capture food supply shocks and external factors);
3) social transfers (government policies aimed at protecting the vulnerable segments of the population that act as countercyclical stabilisers); and
4) initial conditions.
We also investigate how the effect of real income growth varies along structural characteristics of the economy, such as the stage of economic development, and measures of inclusiveness, given by the income share of the bottom 20%.
Our annual data cover 143 countries from 2001 to 2018. Higher income tends to induce both a stark reduction in undernourishment and substitution away from cereals while increasing protein consumption (Figure 3). These insights from the descriptive evidence are confirmed in the econometric analysis. Our results suggest that economic growth is by far the largest driver of global undernourishment (Figure 4, top panel). A one-percentage-point increase in economic growth leads to an approximately 1% reduction in the share of undernourished in both the random and fixed-effects instrumental variables regressions.5
Figure 3 Undernourishment, income, and diets
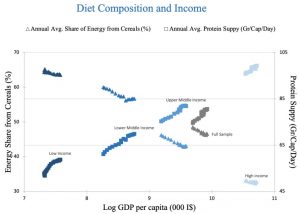
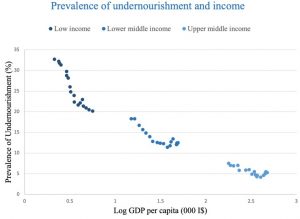
Figure 4 Macro determinants of undernourishment
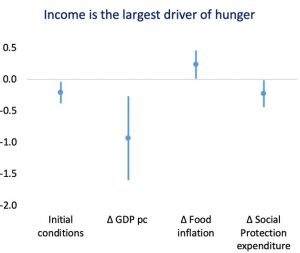
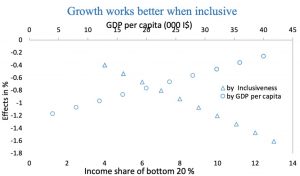
Note: In the top graph, vertical lines show 95% confidence intervals. In the bottom graph, the lower x-axis represents inclusiveness (income share of the bottom 20%). The upper x-axis shows GDP per capita (thousands of international dollars).
In our study, the elasticity of undernourishment to inflation is smaller than to GDP growth since, for a typical change in food inflation, the share of undernourished increases by about 0.24%. Social transfers, being in part directly targeted to the share of the population most vulnerable to food insecurity, have a significant direct impact in curbing undernourishment. A typical change in social protection expenditure has the same strength as food inflation, leading to a 0.22% reduction in undernourishment. Finally, we find that countries that start with higher levels of undernourishment at the beginning of our observation period exhibit a higher reduction rate, but the catching-up is slow in absence of other improvements. Thus, overall, there is little evidence of cross-country convergence.
Results of the heterogeneity analysis show that economic growth plays an important role in reducing hunger at the early stages of development and becomes less effective as countries grow richer (Figure 4, right panel). The higher income elasticity of hunger in middle- and low-income countries relates to the bigger share of the population that is closer to the undernourishment threshold and that shifts above or below that threshold as incomes fluctuate. Growth is more effective in reducing hunger in countries with more inclusive economic systems (proxied by the size of the bottom 20% share of national income). In other words, higher inequality reduces the elasticity of undernourishment to GDP growth.
Diet composition also matters for food security. Before descending into undernourishment when incomes decline, households change their diet by moving to cheaper staple foods and cutting (animal) protein consumption. This margin of adjustment is quantitatively relevant. A negative 1 percent GDP shock tends to increase cereal consumption (by 0.06%) and decrease protein consumption (by 0.55%), tilting the diet towards cereals.
Conclusions
The COVID-19 pandemic and its scars risk jeopardising the process of bringing the number of undernourished people to zero by 2030. In fact, econometric analysis suggests that real income changes are by far the largest driver of hunger, followed by food prices and social protection schemes. Absent policy interventions, the 2020 decline in income and increase in food prices would lead, respectively, to 57 million and 3 million increases in the number of hungry people, hitting especially low-income countries. The economic fallout from the pandemic risks setting us back a full decade on eliminating undernourishment.
Social protection, by complementing the income of the most vulnerable households, helps keep inequality under check. It is a valuable shield against income and food price shocks, as it reduces the elasticity of undernourishment to income shocks for a given level of economic development. Governments should thus strengthen safety nets for the most vulnerable and mitigate the risk of food-price spikes by guaranteeing the smooth functioning of food supply chains.
1 giugno 2021
HANS‐HELMUT KOTZ, JAN MISCHKE, SVEN SMIT
Pathways for productivity and growth after the COVID-19 crisis
(synthesis; full article – Vox Eu CEPR 03 May 2021 – https://voxeu.org/article/pathways-productivity-and-growth-after-covid-19-crisis )
Abstract: The future of productivity and economic growth in the US and Europe is uncertain. This column reviews evidence from eight economic sectors to lay out the key conditions for sustained recovery from the Covid-19 crisis. It suggests that the weak productivity growth that followed the Global Crisis can be averted if private and public sectors act together to strengthen demand and diffuse supply-side restructuring to all firms.
Keywords: COVID-19 pandemic death toll vaccines public health crisis recession
The COVID-19 pandemic has exacted a gruesome death toll and, the stunningly quick developing of vaccines notwithstanding, the public health crisis is still far from being contained. Indeed, in spring 2021, Europe appears to be in a third wave and the disease threatens to become endemic, a structural change to which our economies will have to adapt. The pandemic has caused the deepest recession since WWII, hitting demand and supply simultaneously with different force depending on the industry (Baldwin 2020). Prospects for social-contact dependent industries have arguably changed for good.
While this might sound Panglossian, out of this mayhem there are signs that an upside may be emerging. Early evidence suggests that COVID-19 has pushed some businesses to adopt process innovations that were technologically possible, but largely under-utilised, before the crisis. These long-overdue improvements to the way that firms operate could yield a substantial productivity dividend, offering hope of a new phase of economic dynamism once economies reopen. Robert Gordon (2016) pointed to a similar dynamic when explaining the dynamic trajectory of output per working hour in industrialised (and industrialising) economies after WWII.
The shock of the pandemic may have induced a similar upside shock to multi-factor productivity. Under pressure from the dire circumstances, reluctance – a historical perennial – to apply new, different ways of doing things gave way to more bold behaviour (David 1990). Broad-based application of innovations is typically slow. Legacy techniques regularly survive for an extended period. This is one reason for the observed substantial variance in efficiency within industries (Syverson 2011).
The pandemic has now undoubtedly changed our economic environment, opening different perspectives. New McKinsey Global Institute (2021a) research explores potential paths ahead for productivity growth to 2024 in the US and Europe. A review of eight sectors indicates that there is potential to accelerate annual labour productivity growth by around 1% a year to 2024. If that were to materialise, it would be more than double the rate achieved after the Global Crisis. This would imply additional per capita GDP in 2024 ranging from about $1,500 in Spain to about $3,500 in the US. That would be a stunning outcome, but delivering it will require two key conditions to be in place – that productivity-enhancing action spreads widely, to many companies, and that demand is robust.
As economic activity plunged during the pandemic, many firms – and healthcare organisations – took bold steps that could boost labour productivity growth. From a sectoral perspective, the largest gains to be reaped, at about 2%, could be in healthcare, construction, ICT, and retail (see Figure 1).
The pandemic pushed companies to accelerate the deployment of technologies that had been around for some time including digitisation, robotics, and algorithmic process controls. With the right conditions in place, this ‘creative re-processing’ could permanently raise labour productivity by substituting technology for employees. A McKinsey Global Institute (2020a) survey conducted in October 2020 found that companies digitised many activities 20 to 25 times faster than they had previously even thought possible. A McKinsey executive survey in December 2020 found that 51% of respondents in North America and Europe had substantially increased investment in new technologies (excluding remote work technologies) that year.
In healthcare, the pandemic-induced increased use of telemedicine has the potential to be the largest driver of a potential acceleration in productivity growth. Industry experts say that 20% of healthcare could be delivered virtually – permanently. In construction, half of respondents to a May 2020 McKinsey survey said that they had already increased investment in industry transformation, including in digitisation (McKinsey Global Institute 2020c).
A broad shift toward online interaction channels occurred during 2020. In retail, e-commerce exploded (McKinsey Global Institute, 2020b). Before the pandemic broke, e-commerce was forecast to account for less than one-quarter of all US retail sales by 2024; during the first two months of the COVID‑19 crisis, the actual share of e-commerce in total retail sales rose from 16 to 33%. One retailer achieved three years’ worth of pre-pandemic rates of growth in e-commerce in eight weeks. These are structural changes, establishing positive, self-reinforcing feedback effects. Reverting to previous ways becomes implausible.
An immediate response to pandemic-induced revenue shortfalls was for businesses to strive to become more efficient – to substantially rethink their product, business, and operating models, and to become more responsive to contextual changes. Surveys indicate that more is to come. The December 2020 McKinsey survey showed that about 75% of respondents in North America and Europe said they expected investment in new technologies to accelerate substantially in 2020–24, up from 55% who said they increased such investment in 2014–19 (see Figure 2).
Figure 1 Our sector analysis indicates potential for incremental productivity growth of approximately one percentage point per year through 2024
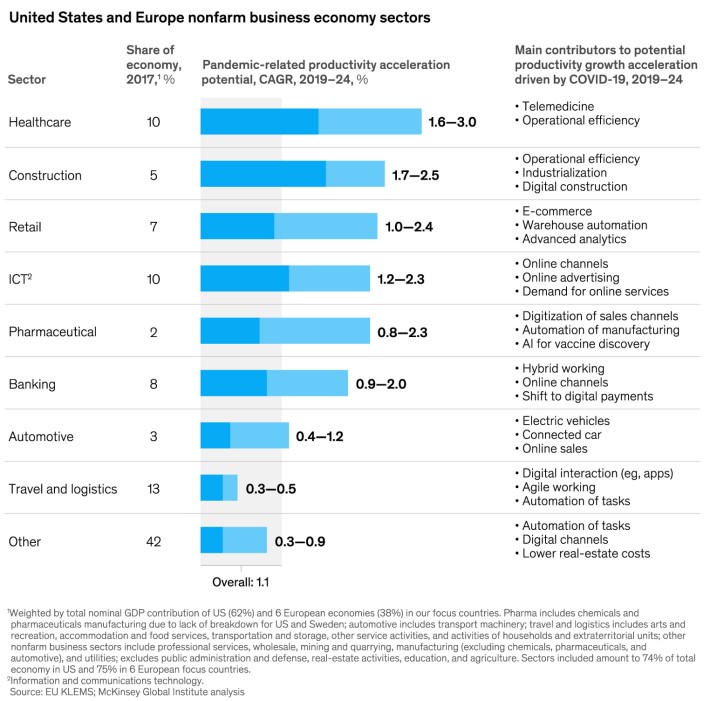
Source: McKinsey Global Institute (2021b)
Figure 2 Surveyed executives expect acceleration on most drivers
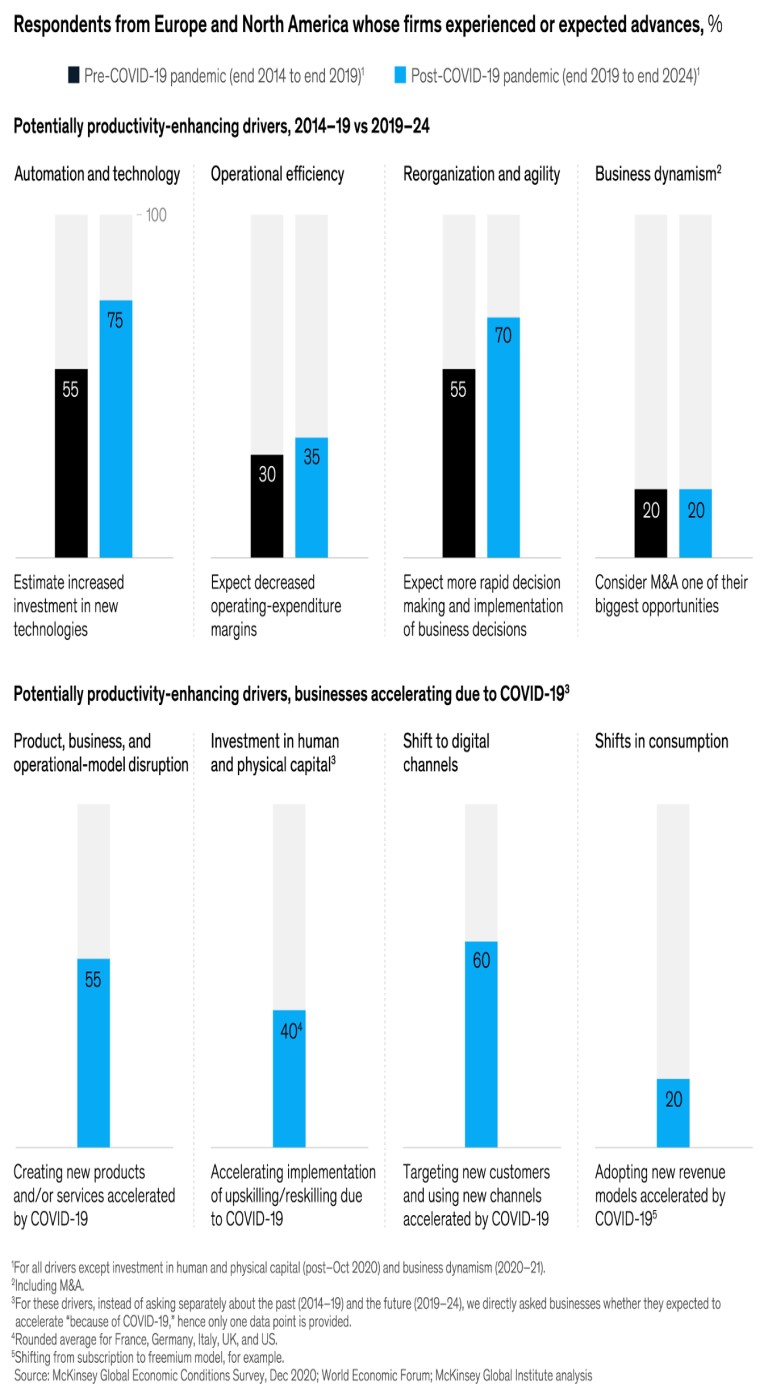
Source: McKinsey Global Institute (2021b)
Condition 1: Diffusion of supply-side change needs to spread
The first condition that needs to be in place is that proactive supply-side reorganisation needs to spread far more widely, particularly in sectors that are large enough for diffusion to have an impact on economy-wide productivity. However, as of the third quarter of 2020, corporate action appears concentrated in large ‘superstar’ firms, defined as the top 10% of firms by 2019 revenue and economic profit (Manyika et al. 2018).
MGI analysis used a number of (imperfect) metrics that are available at the firm level, such as R&D spending, investment, and M&A, as proxies for potential drivers that could in the short-and mid-term accelerate productivity. The metrics showed further advances for firms in sectors that were already ahead of their peers before the pandemic. For instance, between the third quarters of 2019 and 2020, capital expenditures declined by much less for large superstars than for other groups of companies. R&D investment by large US superstars grew by about $2.6 billion (66% of total R&D investment growth in the third quarter of 2020 from a year earlier), compared with $1.4 billion for all other types of firms (34%).
If advances do not diffuse widely, any acceleration in productivity growth could fall short of potential, the gap between superstars and a long tail of lagging or even zombie companies could widen, income inequality and unemployment could increase (McGowan, 2017). In short, there could be a repeat of the ‘great divide’ observed in the aftermath of the 2008 Global Crisis in which, at best, only a minority of companies, households, and regions enjoy productivity and income growth.
Overall, the jury is out on whether diffusion of potentially productivity-enhancing corporate action will be sufficiently broad-based to move the needle for entire economies. The situation looks somewhat more favourable in the US, despite more pronounced superstar dynamics, because SMEs account for a smaller share of the economy, and new business creation has risen during the pandemic—by 24% in 2020 compared with 2019. In Europe, SMEs make up a larger share of the economy, and new business formation fell sharply over this period in Southern Europe.
Condition 2: Demand needs to be robust
There is rising optimism that if and when the health crisis is contained, pent-up demand and savings stocked up during the pandemic could be unleashed, and there could be a strong initial bounce in demand, led by the consumer McKinsey Global Institute (2021a). The key question is whether – and how – demand can be sustained after an initial bounce back.
The large government economic support package in the US, notably the $1.9 trillion passed by Congress in March 2021, coupled with a large infrastructure bill currently being discussed as a medium-term follow-on initiative could create ‘high-pressure’ economic conditions, putting the US economy on a robust trajectory. In Europe, however, the situation thus far appears much less dynamic and substantially more vulnerable.
Healthy demand conditions need to persist to nurture sustained productivity increases. In a highly uncertain environment, with businesses experiencing low demand for their products and services, firms are understandably reluctant to commit resources to innovation and managerial reengineering, and the most productive firms find it more difficult to gain share.
Advanced economies had a demand problem well before the pandemic. Often, productivity growth had not translated into broad-based wage growth and consumption. In the US, median wage growth has been about 18% below productivity growth since 2000—6.5% of today’s GDP in forgone wages (Bughin et al. 2019). Moreover, investment rates were in long-run decline, reflecting factors such as aging, slow growth, and a shift to (less capital-consuming) intangibles.
The pandemic and the way that companies have responded to it could reinforce such drags (see Figure 3). Our sector reviews suggest that about 60% of the estimated productivity potential comes from firms taking measures to cut labour and other input costs, for example by increasing automation (McKinsey Global Institute 2021b).
Figure 3 The COVID-19 pandemic and responses of firms could exacerbate structural demand drags
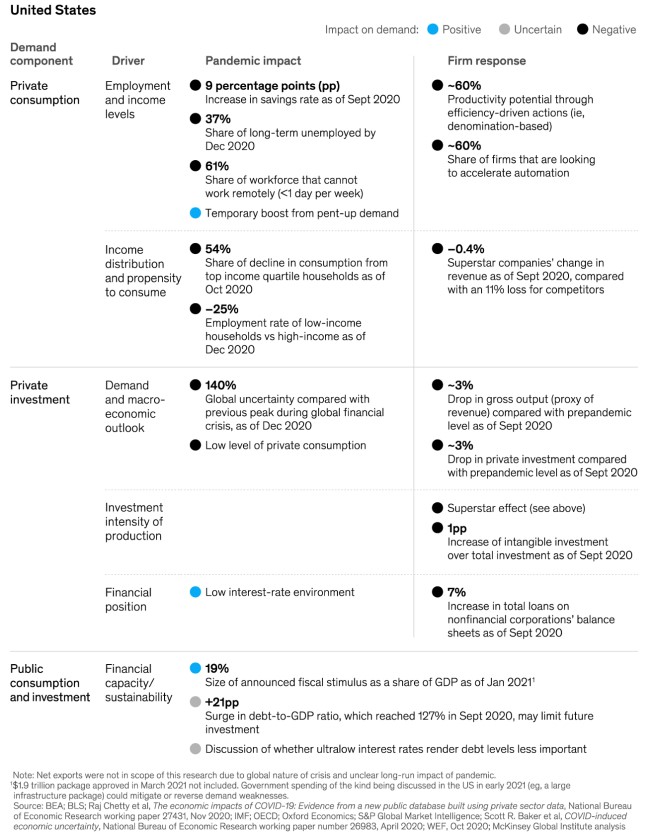
Source: McKinsey Global Institute (2021b)
Will the right conditions fall into place after the pandemic?
The way ahead depends on policy choices made (see Figure 4). Unfortunately, growth akin to the years after the Global Crisis is a plausible outcome, particularly in Europe if there is no sustained and decisive action to spread advances more broadly, supporting demand and, concurrently, investment. At the same time, there is a distinct opportunity for the recovery to evolve as it did in the post-war years if such action is taken.
The stakes are high. Starting at US 2019 per capita GDP, the difference between having, for ten years, a per capita growth rate either like that after the end of World War II or the one experienced after the Global Crisis, for instance, amounts to 27%, or about $17,000.
Figure 4 Could productivity growth accelerate after the COVID-19 crisis?
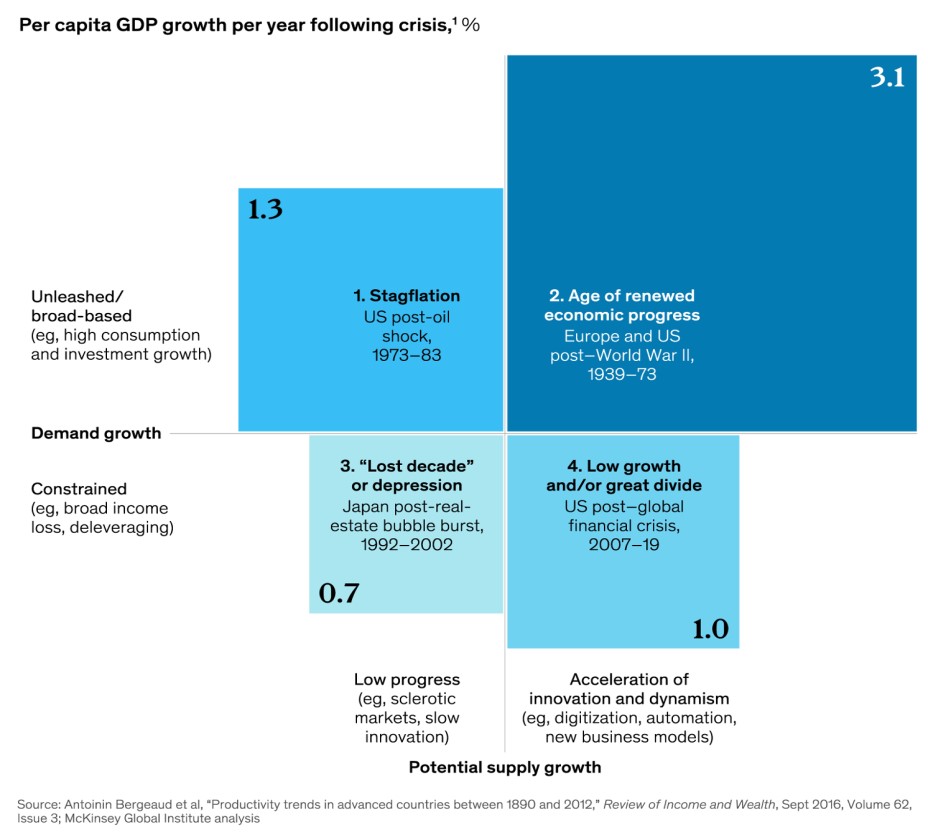
Source: McKinsey Global Institute (2021b)
For innovation and diffusion on the supply side, large corporations need to continue investing in innovation and reengineering their organisations to become more flexible and adaptable, but should also consider how to catalyse change across their entire supply chains and ecosystems. Policymakers can support these efforts through, for instance, public procurement focused on innovation, direct R&D investment, and revising platform, data access, and competition rules, insolvency procedures, and product and labour market regulations.
On the demand side, large-scale, sustained, and direct government economic support could minimise or even reverse the potential demand gap, and, while there is a lively debate about the sustainability of such efforts, it appears important that government support is not withdrawn prematurely before economies have reached “escape velocity.’ In Europe, this might stretch certain readings of the fiscal rule book that is currently under review. There are substantial arguments for pondering a new approach (Blanchard et al. 2021).
But supporting demand is not only a job for governments. Firms, too, need to play their part in ensuring that productivity grows in a way that supports employment, median wages, and thereby demand. Companies clearly need to look after their bottom line, but they need also to grow revenue rather than solely seek efficiencies. They can ramp up retraining their workers to make them less vulnerable and rebuild their incomes. A sustainable recovery will face resistance unless median wage growth tracks productivity growth more closely than it has in the past. Some companies are responding to the pandemic by looking at how to strengthen the finances of their most vulnerable workers.
All need to invest more. Well-known focus areas include sustainability, infrastructure, and affordable housing, all of which have substantial investment gaps. Governments can support such investment by setting rules and pricing externalities, such as for carbon emissions. They can also look at rules governing land and housing markets to unlock investment. Furthermore, they can raise direct investment in high-priority, high-impact areas such as infrastructure, basic science, and skill building. To unlock funds, they could revisit the rules governing public investment, recognising it as a public wealth-building activity on a balance sheet rather than as a deficit-increasing fiscal expense.
Concluding remarks
What we found in terms of the business response to the pandemic gives rise to some optimism, and is reminiscent of Robert Gordon’s diagnosis: there exists substantial potential to lift productivity, at least for the next half decade that is the horizon of the survey (Chaney Cambon 2021). Admittedly, if these expectations pan out, this is not necessarily a trend shift—a new trente glorieuses (Fourastié 1979). The boost could prove to be temporary, but nonetheless would pull economies to higher output levels. Indeed, McKinsey surveys show that some businesses, in particular the larger ones, are prepared to commit substantial resources to this effort.
There is, however, a substantial downside risk. From the perspective of firms, weak demand increases uncertainty, and past MGI research indicated that this encourages firms to be defensive (Mischke et al. 2018). Therefore, the positive feedback loop could just as well work in reverse. This is a particular danger in Europe where, with still highly vulnerable firms, discussions about containing public sector deficits are gaining ground. Innovative firms are faced with higher hurdles. This can be self-reinforcing, providing the ground for mediocre perspectives.
The shock of the pandemic may prompt something of a supply-side miracle, but only if demand receives the attention it needs. The boldness and speed with which businesses and governments responded to the pandemic now need to be deployed in a new era of collective action to craft a broad-based, equitable, and sustainable recovery.
24 maggio 2021
MARCO BUTI, GEORGE PAPACONSTANTINOU
Reshaping European economic integration in the post-Covid world
(synthesis; full article – Vox Eu CEPR 23 April 2021 – https://voxeu.org/article/reshaping-european-economic-integration-post-covid-world )
Abstract: Most of the discussion on the economic policy response to the pandemic in Europe has centred on its ambition, tools, and institutional characteristics. Less discussion has taken place on the factors shaping EU integration and economic policy priorities after the pandemic. In a new CEPR Policy Insight, the authors argue that four sets of issues will be important in shaping the legacy of the pandemic for European integration: redefining the new boundaries between state and market; revisiting the nature of subsidiarity; reconnecting the EU domestic with the global agenda; and learning to respond to longer term structural shifts.
Keywords: COVID-19, response to pandemic, EU integration, CEPR policy.
The EU is navigating its third crisis in the space of a single decade, following the euro area financial crisis and the migration crisis. In some respects, the potential systemic implications of the Covid-19 pandemic are even more pervasive than those of the previous crises (Baldwin and Weder di Mauro 2020, Fuentes and Moder 2021). Jean Monnet famously stated that “Europe will be forged in crises and it will be the sum of solutions adopted for those crises”. But every crisis has its own characteristics, and prompts its own response. In certain cases, the response pushes forward the frontier of European integration – that was the case of the completion of the Single Market after the Eurosclerosis of the 1970s or the creation of the euro after German reunification. In other cases, the response is only partially transformative, as was the case during the financial crisis that started in 2008.
Therefore, not all the responses to crises pass what, in a new CEPR Policy Insight (Buti and Papaconstantinou 2021), we call the triple ‘Monnet Compatibility Test’ of economic coherence (effective policy action), institutional coherence (leveraging common governance mechanisms at the right level of government), and political coherence (maintaining citizens’ support).
This crisis is different, and the policy response, with the Next Generation EU initiative at its heart, is breaking new ground (Verwey et al. 2020) and leading to governance changes at national level (Buti and Polli 2021). This is true in terms of instruments (use of grants, new ‘own resources’, issuance of common debt); institutional mechanics (the return of the so-called Community method); as well as in terms of the sheer magnitude of the underlying fiscal effort and liquidity provision at both national and EU levels.
Why a different policy response this time round?
The decisions taken by the EU do represent a significant ‘stepping up’ and a break with past policy. What has underpinned this shift? We believe three broad factors have driven what we are observing.
The first is the evolution in our understanding of macroeconomic policy – the new macro paradigm that has emerged since the global financial crisis, with a revised consensus on the appropriate overall macro policy stance, a new understanding on debt sustainability, the right mix of fiscal and monetary policy, and the role of central banks (Fornaro and Wolf 2020). With monetary policy at the effective lower bound, fiscal policy – at national and EU level – has to play a more important role in propping up the economy. This is key for domestic reasons, but also to make the European economy less dependent on external demand and hence able to play a more assertive role in global governance.
The second factor is the different nature of the current crisis – exogenous, not policy induced, hence giving less rise to a ‘moral hazard’ narrative. As a consequence, the focus of the policy response has been on a common threat requiring a common response. The asymmetric impact of the crisis has come to be seen as a threat to the whole EU. Hence, solidarity, or enlightened self-interest, has underpinned the policy decisions. Opinion polls show a large support for Next Generation EU not only in countries that are net beneficiaries, but also in Germany and the so-called ‘frugal’ countries that only reluctantly contributed to the rescue programmes during the financial crisis.
The third factor is policy learning from the euro area financial crisis – among others, the need for monetary policy to be forceful to stop self-fulfilling dynamics or the realisation of negative equilibria, the dangers of early withdrawal of fiscal stimulus, and the difficulty of achieving an appropriate euro area fiscal stance only via horizontal coordination of national policies.
In sum, if properly implemented, the economic policy response to the pandemic has a chance to meet the three criteria of the Monnet Compatibility Test. Will it also represent a paradigm shift in European integration?
Four post-Covid shaping factors.
Looking forward, Covid-19 is forcing us to rethink attitudes and policies across a number of areas that will shape the legacy of the pandemic for European integration. As we argue in Buti and Papacostantinou (2021), some of the main issues standing out could be grouped under four headings: the new emerging boundaries between state and market; the notion of subsidiarity in the new environment; reconnecting the EU/domestic with the international/global agenda; and the need for EU economies and policymaking to deal with longer-term structural shifts taking place.
1.Defining the new boundaries between state and market
As the pandemic ripped through European societies, it brought with it a new realisation of the importance of well-functioning health systems as well as of the ability of national governments and the EU collective to protect Europeans. This simple realisation is concretely translated in policy shifts or ongoing discussions which may break new ground: a new emerging paradigm for fiscal balances and policy mix, a new social compact (with higher minimum wages, a universal basic income, more progressive tax systems), the debate on strategic autonomy in key sectors/products that would increase resilience at national and EU level (encapsulated in the shift from ‘just in time’ to ‘just in case’). In these areas, what is underlying is a rethink of the balance between what is provided by states and what is determined mainly by market forces. This policy shift is evident across most EU nations, as well as in the UK and the US. Medium term, it will be crucial that the renewed emphasis on strong social protection does not hamper – but actually enhances – the reallocation of factors of production. Shifting from on-the-job protection to in-the-market protection will be a key challenge.
2.Revisiting subsidiarity
A related issue concerns the balance of what belongs to the domain of national policy in member states and what is a matter for the EU collective. This gives a new twist to the discussion on subsidiarity, as can already be seen by the decisions around the EU Recovery Plan or the proposals on a European health union. The pandemic revealed the need for coordination at EU level and forced cooperation in a number of areas, from travel rules to vaccine procurement. Post-crisis, there will be a review of what has worked and what not: on certain issues, coordination of national policies will suffice; on others, direct supply at EU level will be needed. As health is a global public good, there will be a need to ‘elevate’ a number of issues surrounding the prevention and management of future pandemics to the to EU level. The same would apply also for pan-European infrastructure investment projects (Beetsma et al. 2020). At the same time, the pandemic has highlighted the importance of rebuilding a more ‘dense society’, achieving solidarity through a sense of belonging, and not just from the services delivered by the national welfare state. This would suggest moving policy delivery in the opposite direction, to the local level, closer to citizens. In Einaudi’s tradition of marrying economic freedom and social cohesion, in the post-Covid world, the role of communities and intermediate bodies will be enhanced (Einaudi 1949, Gigliobianco 2010).
- Reconnecting the EU domestic with the global agenda
Covid-19 is also pushing the EU to reconnect the domestic with the global agenda. This is where the other dimension of strategic autonomy belongs – the one dealing not with global supply chains but instead with new geo-economic relations. In a situation of geopolitical re-ordering, upgrading the global role of the EU will be essential in order to be able to influence the discussion on European and global public goods (not just health and pandemics, but also climate and digital governance), as well as avoid beggar-thy-neighbour policies in areas such as trade or finance. The domestic ramifications of a more assertive global role of the Union are substantial: the Single Market will need to provide more ‘indigenous’ sources of growth and enhance the robustness of Europe’s value chains; macroeconomic policies will have to reduce the dependency from external demand, acknowledging that persistent current account surpluses are a source of vulnerability.
It is also in this context that one should reflect on the need to complete the EMU; while bringing to a conclusion the reforms that started with the euro crisis is important in and of itself in terms of better functioning of the EU and increasing its resilience to shocks, it is also essential for bolstering the international role of the euro, thereby increasing the weight of the European Union on the global economy. The issuance of common EU debt under Next Generation EU will also help increase the attractiveness of the euro.
- Responding to longer term shifts
The final Covid policy legacy concerns the need to respond to longer term structural shifts (Terzi 2021). In the pandemic, everything digital thrived. At a first level, this clearly requires a European push to digital – and indeed the EU Recovery Plan is supposed to help the EU “recover and transform” with the twin digital and green transitions. Indeed, as far as the latter is concerned, the pandemic may have demonstrated the devastating dangers of ignoring a ‘slow burn’ crisis such as that of climate change. At the same time, the dominance of digital raises new policy issues regarding regulation and competition in digital platforms, as well as issues of protection of workers in a new online environment. The changes brought by Covid also force more broadly a rethink of the role and nature of work, the role and rights of remote workers and even the new meaning of ‘essential workers’.
The policy response to the current crisis has broken new ground. At the same time, the difficulties on vaccines delivery and uncertainties on the follow up at national level on Next Generation EU have shown that the latest advances will need to be consolidated. Whether the response to the pandemic marks a fundamental shift in the paradigm of European integration and hence or it remains an ‘exceptional one-off’ under extreme duress will depend on addressing the four shaping factors highlighted above.
17 maggio 2021
EDUARDO LEVY YEYATI, FEDERICO FILIPPINI
Pandemic divergence: The social and economic costs of Covid-19
(synthesis; full article – Vox Eu CEPR 12 May 2021 – https://voxeu.org/article/social-and-economic-costs-covid-19)
Abstract: The long-term social and economic consequences of Covid-19 are uncertain. This column provides a preliminary assessment of the variation in costs across countries and regions, and suggests that developing economies will suffer the most lasting damage. The pandemic has exposed the differential capacity of governments to mitigate health and economic crises and to allocate scarce resources efficiently, while some labour market structures have inhibited government efforts to attenuate the pandemic’s impact – impediments that will also shape comparative recoveries
Keywords: COVID-19, pandemic recession, IMF, World Economic Outlook
According to the IMF´s latest World Economic Outlook (WEO April 2021), the pandemic recession is the deepest since the end of WWII, with a 3.5% output contraction in 2020, which represents a 7% loss relative to the IMF´s 3.4% growth forecast back in October 2019. More importantly, the consequences of the shock will likely be long-lasting. While the medium-term costs are still uncertain and vary significantly across countries, it is safe to say that developing economies will suffer the most. Whereas the IMF projects that the world GDP will be 3% lower in 2024 relative to the no-Covid scenario, the number doubles to 6% for the developing world despite the fact that the shock, as measured by Covid-related deaths, was more muted in low-income economies. In a recent paper (Levy Yeyati and Filippini 2021), we run a preliminary assessment of these long-term costs by countries and regions.
How big is big?
First, we compute the differences between the output paths for 2020–2030 projected before and after the pandemic (the shaded area in Figure 1) and estimate its present value discounting at a 0% real interest rate (a reasonably conservative assumption in a context where real rates are negative for most developed countries). This yields a total loss of about half of global GDP.
Figure 1 Global GDP projections (in constant USD, index 2017=100)
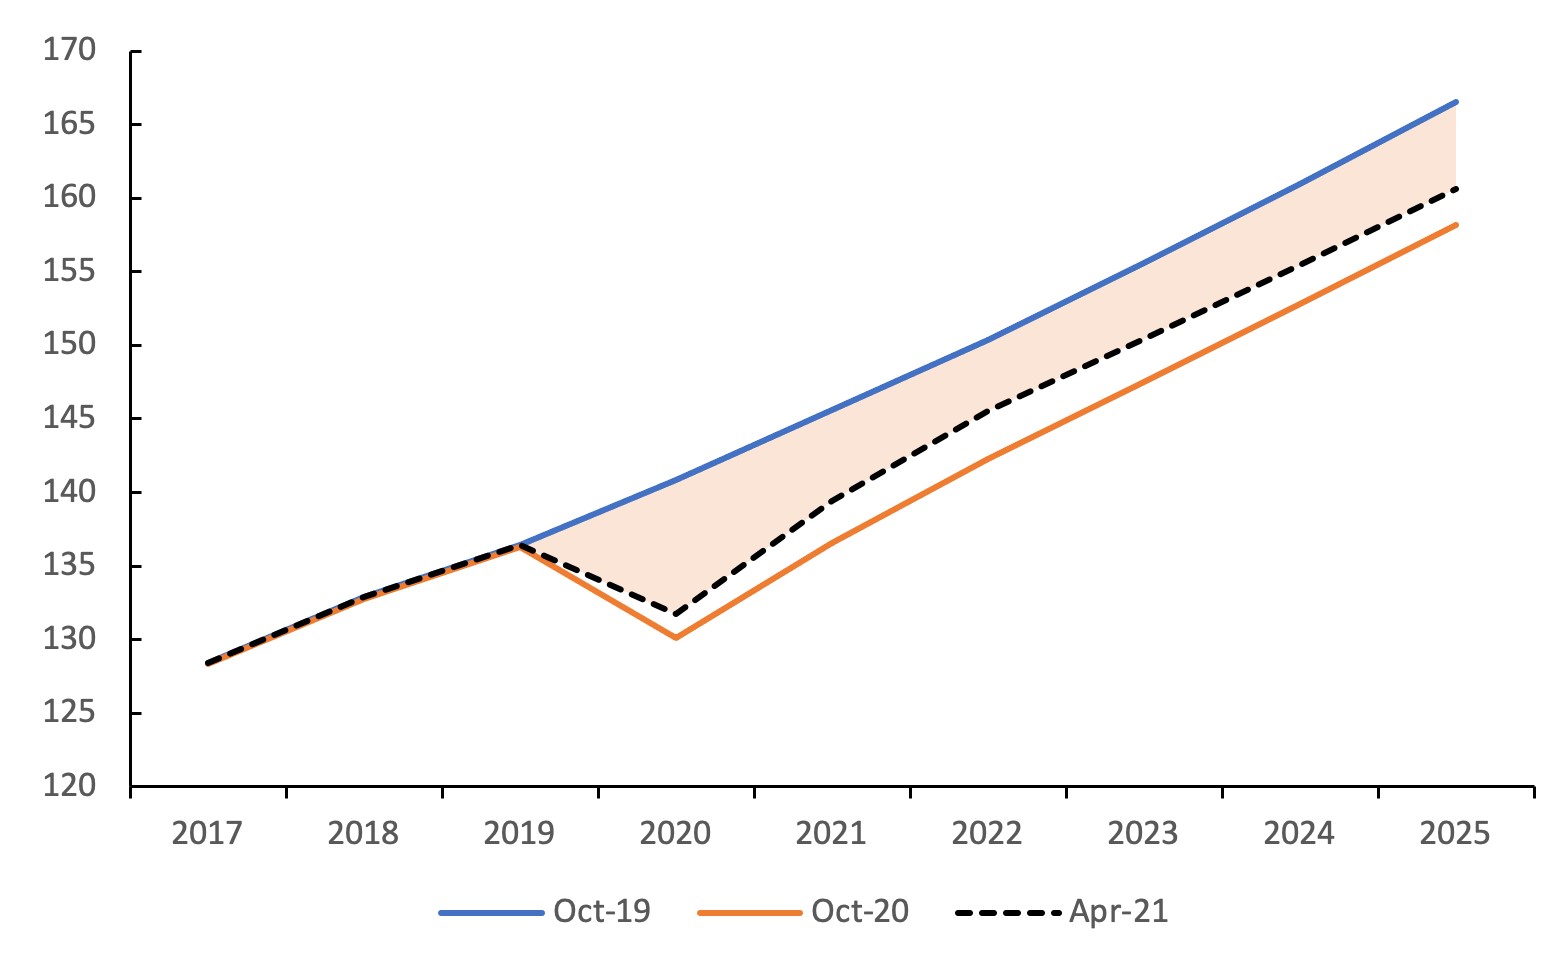
Next, there is the question of the fiscal stimulus (equivalent to 15% of GDP, according to the IMF fiscal monitor) without which the output loss in 2020 would have been much steeper. How much of the economic impact of the fiscal unwinding is properly accounted for in the revised growth projections (Beck et al. 2021), particularly given that a big part of the stimulus (6% of the 15%) was below the line (loans, equity stakes, guarantees) with a cost that is contingent on the speed and composition of economic recovery in each country? There is no simple answer here. Moreover, we are ignoring potential bouts of financial stress or debt restructurings in heavily indebted countries (Persaud 2021), as well as the second wave of stimulus already in line for 2021 in many advanced economies. All things considered, adding the full 15% of GDP as an indicative measure of the cost of fiscal support does not look unreasonable.
Third, there is the value of the excess deaths due to Covid-19. There is, of course, no uncontroversial way to put a value on human life. For the sake of argument, we follow a recent estimation for the US by Cutler and Summers (2020) that uses the ‘statistical lives’ value to place it between $10 million and $7 million per life. If we take the considerably more conservative $5 million per life, acknowledging that the statistical value may vary across countries, the cost related to the global cumulative deaths registered so far amounts to 16.9% of global GDP.
Fourth, we address education losses. School closures translate into a loss of human capital through a decline in both effective hours of schooling and retention ratios (Burgess and Sievertsen 2021). At a global scale, school closures affected 1.6 billion students at the peak of the pandemic (World Bank 2020b). Azevedo et al. (2020) estimated the lifetime loss in labour earnings for the affected cohort at $10 trillion, or roughly 12% of global GDP.
Table 1 Economic costs of the Covid shock (% of GDP)
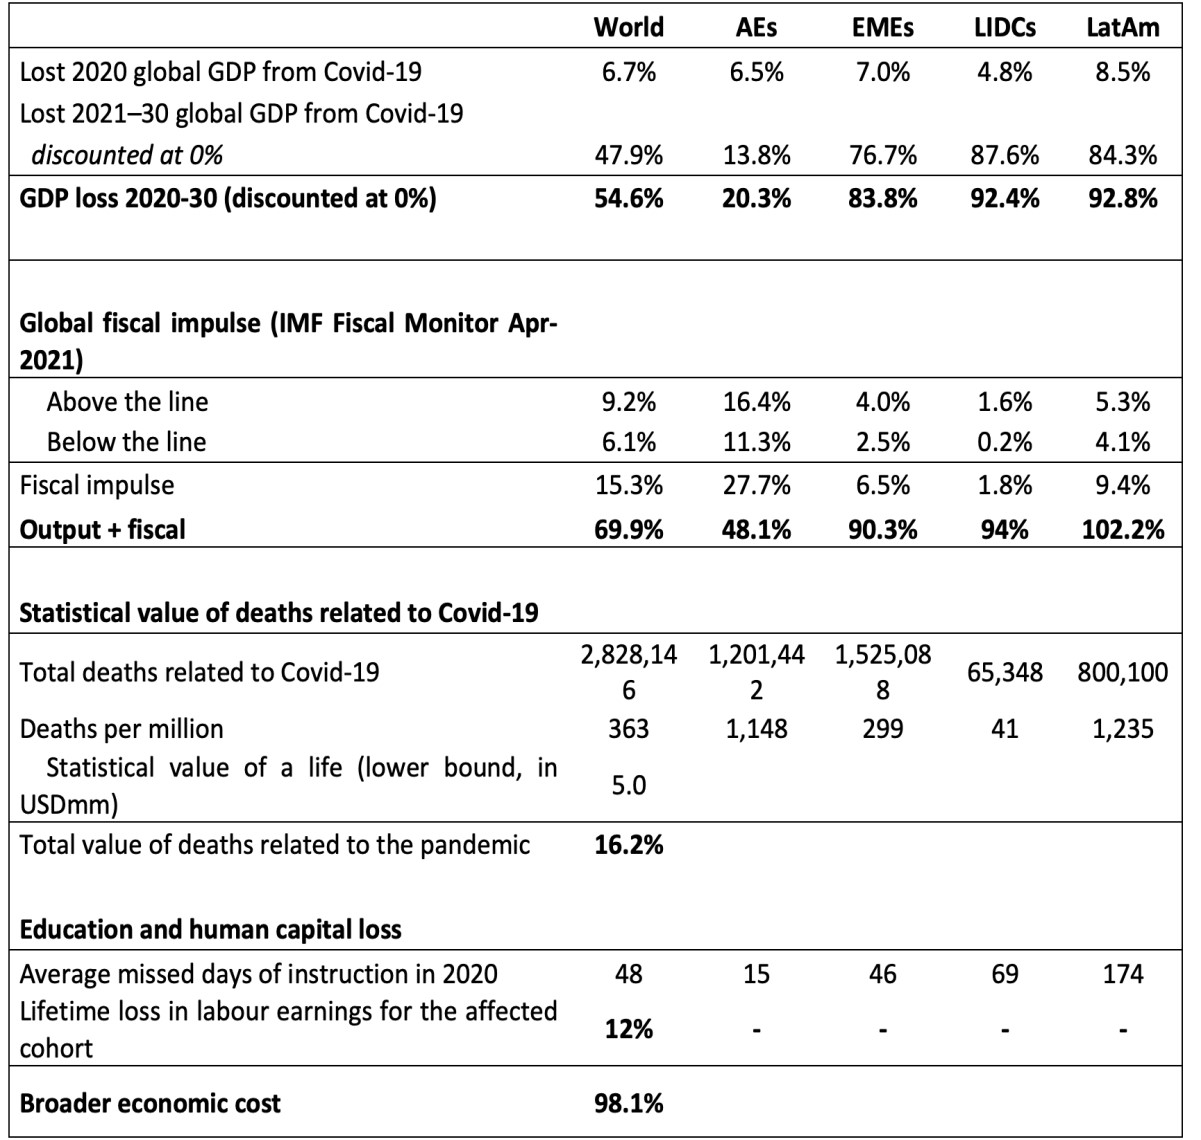
There are many other, harder-to-quantify losses: job and firm destruction (with its concomitant loss of job-specific human capital and the firms´ social capital and know how), untreated/undiagnosed illnesses, and psychological losses from social distancing, which can only be conjectured at this point. At any rate, taking all this into account, our estimated cost of the pandemic, roughly equal to 100% of global GDP in 2019 (see Table 1), should be regarded as a fairly conservative lower bound.
In a sea of averages, the dwarfs drown
In a recent paper, Deaton (2021) highlights something of a silver lining. For all the relevance of superior initial conditions (state capacity, labour formality) to cope with the Covid shock in advanced economies, the output loss (as measured by the difference in growth projections before and after Covid) was larger in the developed world than elsewhere: 2020 output losses are slightly larger for high-income countries due to the higher virulence (so far) of the Covid shock in advanced economies.
Figure 2 Growth revisions and per capita income (areas proportional to population; advanced economies in red)
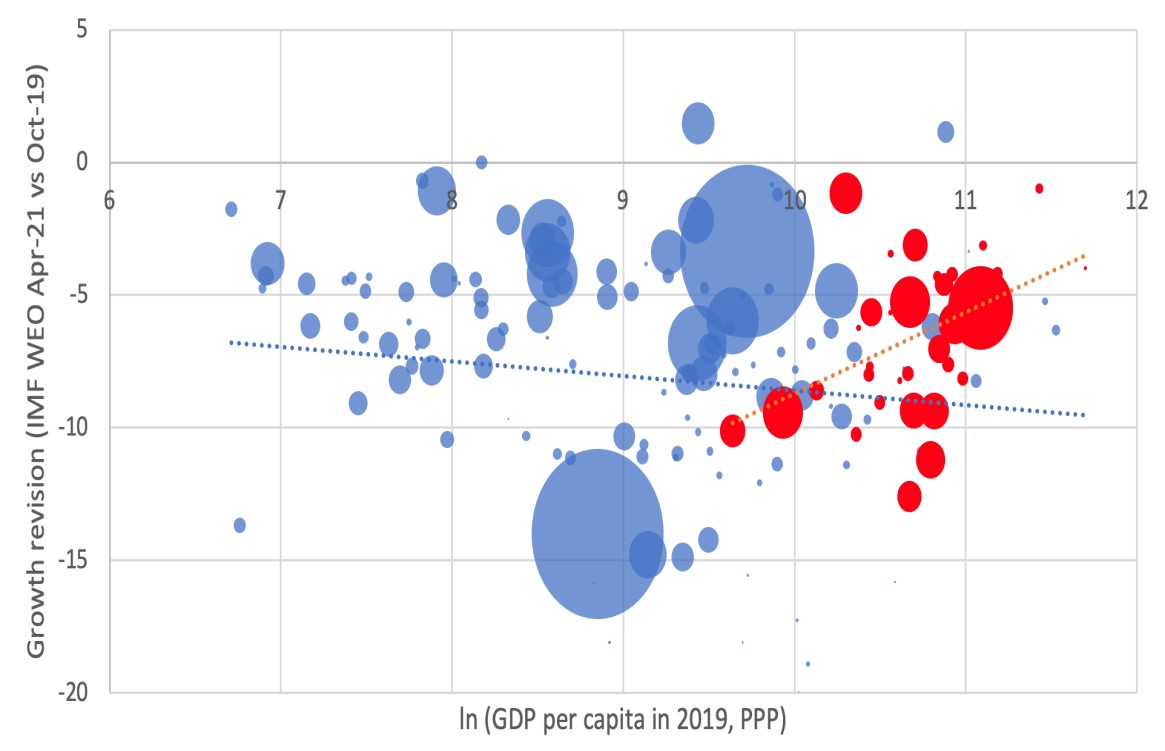
However, judging the relative costs solely by the 2020 downturn could be misleading, as it ignores the differential recoveries (Fornaro and Wolf 2021) and, more generally, the fact that many Covid-related costs will be long lasting. For starters, the comparison already changes significantly once we account for the fact that richer economies will likely recover better and faster this year and the next. Downward revisions to growth in 2021 and 2022 clearly favoured the global north.
Figure 3 Revisions to per capita GDP growth (Jan-2020 vs. Apr-2021 WEO forecasts, percentage points)
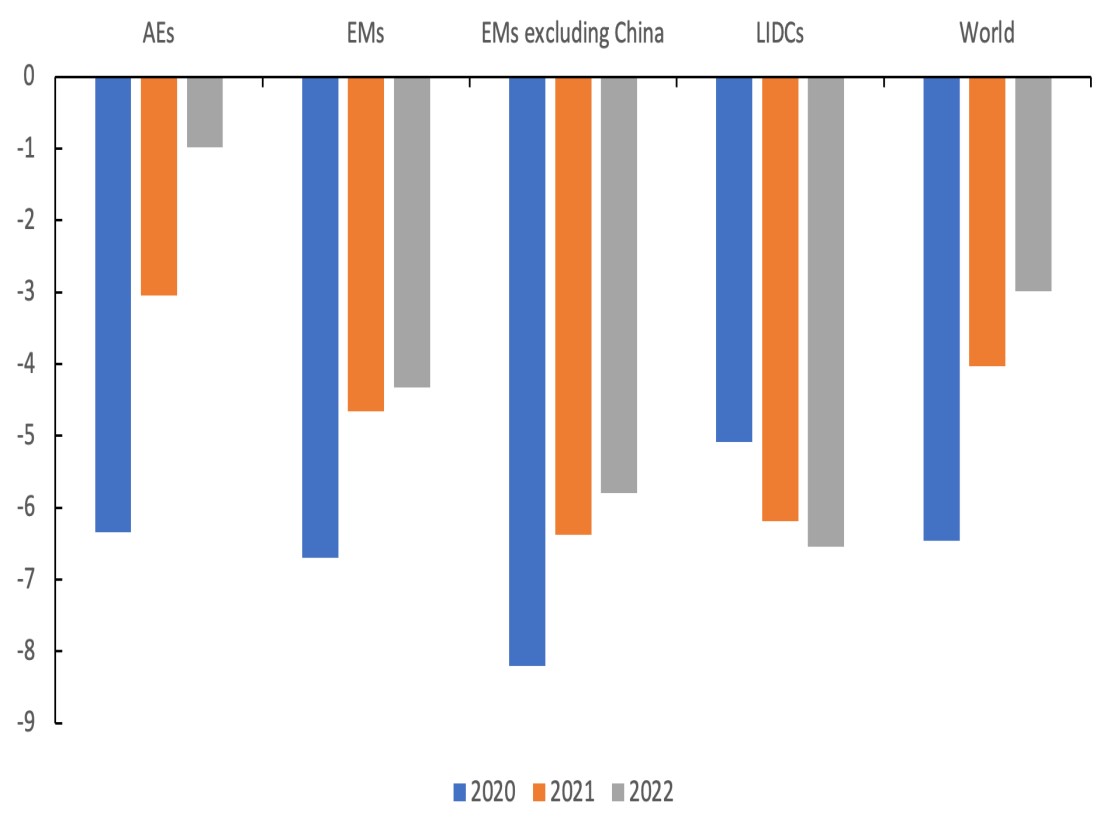
Reasons are not hard to find: better state capacity, stronger labour markets, preferred access to vaccines and, last but not least, larger fiscal packages funded by the issuance of debt at negative real rates, as we have noted here before. The pandemic, besides highlighting the traditional problem of the differential fiscal space to cope with the crisis via fiscal stimuli, revealed two other equally critical aspects: the capacity of governments to buffer the health and economic effect and prioritise and allocate its scarce resources efficiently, and the crucial role played by the labour market structure in inhibiting the government effort to attenuate the impact (Levy Yeyati and Valdes 2020). All of these handicaps will be at play in the comparative recoveries (Cárdenas et al. 2020).
To illustrate how these losses compare across countries and regions, in Filippini and Levy Yeyati (2021) we run the previous Covid cost accounting by country and find that, even if the immediate output loss in 2020 was larger or smaller for developed countries than for advanced economies, that difference – and the absolute cost of the crisis – are dwarfed by the estimated ten-year loss. Predictably, the negative relation between the country´s income and Covid losses changes sign: both globally and within rich OECD countries, poorer countries fare worse.
Figure 4 Economic costs, ten-year window (areas proportional to population; advanced economies in red)
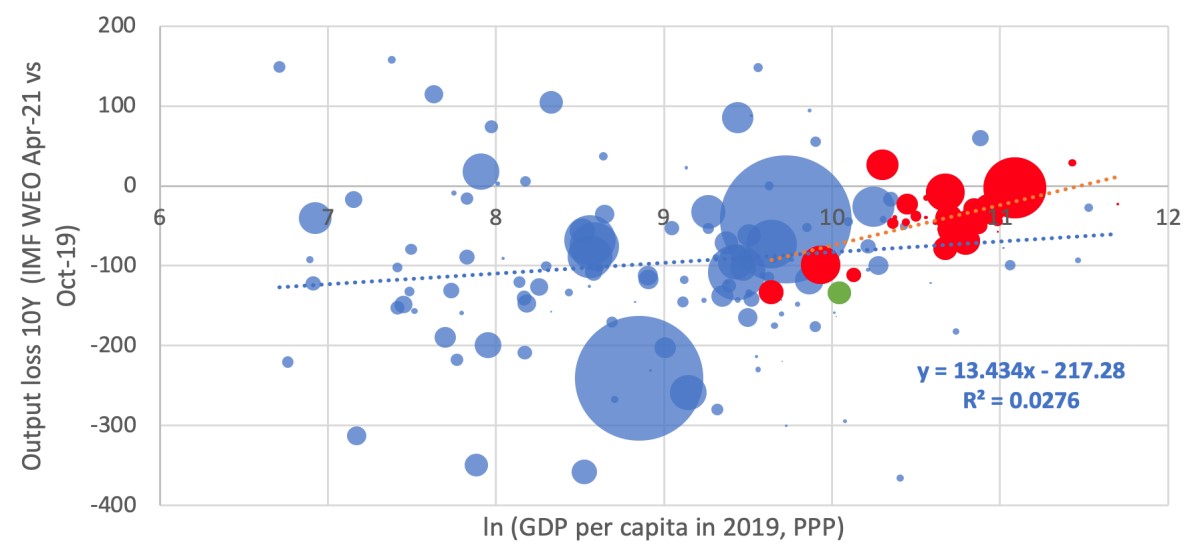
Source: Author’s calculation.
The regression coefficients also change sign. The relationship between the country´s income and Covid have a coefficient of -0.57 (t = -2.16) when considering only the short-term impact (2020); when we look at a longer horizon that includes the recovery path (2020-30), the coefficient turns positive and significant: +13.43 (t = 2.00). This result is robust to running a population-weighted regression, excluding China, or adding the fiscal stimuli. On the latter, the relationship strengthens when only below-the-line measures are considered (coefficient: +14.06, t = 2.19) and softens marginally when including the full stimulus (coefficient: +12.73, t = 2.33) reflecting the fact that advanced economies had a substantially larger above-the-line (debt-funded) fiscal response.
There are other, even harder-to-quantify factors that should be added to this account: job and firm destruction (with its concomitant loss of job-specific human capital and the firms´ social capital and know how), untreated/undiagnosed illnesses, and the psychological loss of social distancing. At any rate, the data indicates that the estimated global cost of the pandemic in Table 1 (roughly 100% of GDP) is likely to be a lower bound, and that the negative correlation with income is probably stronger than the one suggested in Figure 2 and Table 1.
10 maggio 2021
Arnoud Boot, Elena Carletti, Hans‐Helmut Kotz, Jan Pieter Krahnen, Loriana Pelizzon, Marti Subrahmanyam
CORONAVIRUS AND BANKING: EVALUATING POLICY OPTIONS FOR AVOIDING A FINANCIAL CRISIS
(synthesis; full article – Vox Eu CEPR 25 January 2021 – https://voxeu.org/article/coronavirus-and-banking-evaluating-policy-options-avoiding-financial-crisis)
Abstract: Covid-19 has placed renewed pressure on the European banking sector as firms and households struggle to meet the costs imposed by the pandemic. This column provides a comparative assessment of the various policy responses to strengthen banks in light of the crisis. While the authors do not make a specific final recommendation, they review the different options suggested within current research and provide a criteria-based framework for policymakers to guide them in their decision making.
Keywords: COVID-19, financial crisis, European banking sector, euro area, capitalization.
The Covid-19 pandemic will leave deep scars across the globe, particularly in the euro area. Given that the health of banking systems is inextricably tied to the performance of the underlying economies, the non-performing loans (NPLs) of banks are an important issue. What are the policy options to safeguard the integrity and functionality of the banking system? And what are the criteria defining the desired response? This column will address these questions in the context of the EU.
What makes the identification of a suitable policy response particularly difficult is the strong reliance on banks and the apparent ‘overbanking’ in Europe (Pagano et al. 2014). At the national level, banking markets are highly concentrated, and many institutions are considered too-big-to-fail. The structurally low profitability of European banking makes this even more of a concern.
Policy responses should take these structural issues into consideration. In particular, the policy actions should neither reinforce the substantial reliance on banks, nor perpetuate a ‘legacy banking’ architecture that is nation-centric and prone to a ‘doom-loop’ between the fiscal state of national governments and the state of the banking system. The extent to which financial markets could play a more prominent role should also be considered.
In this column, we discuss and evaluate a variety of policy options that are considered in the current debate on how to deal with potential problems of the European banking sector, amplified by the Covid-19 crisis.1 The evaluation is based on a set of criteria that, in our view, capture the effectiveness and credibility of a proper policy response.
Evaluating policy options
We carefully distill the requirements that a desirable policy response should meet in light of two objectives of the policy intervention: (i) the stability of the banking system and (ii) the ability of the banking system to fulfill its important role in society. Subsequently, we apply the criteria to the policy options.
Assessment criteria
We define the following five criteria:
- Effectiveness
- Feasibility
- Credibility of the policy
- Alignment with incentives of private players
- Structural impact at the bank level
Evaluation
We evaluate the various options along the criteria defined above, giving an assessment based on a three point-scale: yes (green), medium (yellow), and no (red). Table 1 summarises the results of the evaluation. For more details see Boot et al. (2021).
Option zero: Private recapitalisation
The basic option to improve the resilience of a single bank is to have it strengthen its capital base. This would allow the bank to deal with the problems at hand on its own (e.g. raise equity and manage non-performing loan). Such private sector initiatives seem preferable, if circumstances permit. A privately recapitalised bank would take full control over its own destiny and have the right incentives for making appropriate business decisions. As Table 1 indicates, this option is effective: it provides the right incentives to private players and would have the right structural impact at the bank level. Feasibility might be an issue, but it is a useful benchmark.
Option 1: Forbearance
The forbearance we focus on aims at giving banks some leeway in meeting regulatory requirements. Banking supervisors have stressed their willingness to accept temporary breaches of regulatory capital requirements if the shortfall is due to pandemic-related provisioning. The actions taken include deactivating surcharges for systemically important banks, lowering risk weights, excluding assets when calculating the leverage ratio, and temporarily suspending newly introduced accounting rules (IFRS 9). We evaluate option 1 under the assumption that it is the only measure taken by authorities and interpreted broadly (including, for example, relaxing accounting rules). As highlighted in Table 1, this option is feasible, but it would be largely ineffective because it does not contribute to the overall stability of the financial system in the medium term. Forbearance may beg for more forbearance, as often happens. Financial institutions will learn the lesson that tough regulatory rules will be bent whenever the risk outlook is gloomy enough. This option might provide perverse incentives to private players as a sole measure. In particular, it could entail substantial elements of the banking union to be suspended. It may lead to the zombification of banks and encourage continued lending to sclerotic firms. Moreover, this option would not have a favourable impact on the banking sector.
Option 2: Recapitalisation via public money
Recapitalization by governments refers to precautionary and mandatory recapitalisations, as suggested by Schularick et al. (2020). For European banks, the authors estimate a capital shortfall between €60 billion and €600 billion, depending on the pandemic scenario. The acceptance of such publicly financed equity infusion would be compulsory, conditional on not passing a stress test. Hence, this alternative could build on the previously discussed basic option if recapitalising via private money cannot be accomplished. As reported in Table 1, this option is effective and credible, but it would be difficult to implement because it encounters resistance as it involves public money. Moreover, this option could perpetuate overbanking. To contain this risk, it is key to attach strong conditions to the public infusion of capital.
Option 3: De-risking via asset sales
In case a bank is unwilling or unable to raise new equity, it may seek to improve its capitalisation ratio by selling assets, or more generally, by ‘de-risking’. This can lead to fire sales, producing systemic risk. As shown in Table 1, this option is feasible and would have a structural impact to the banking system, but it is not effective because the option might imply fire sales and threaten wider financial stability. Moreover, banks would have a strong incentive to substantially cut back on lending. This option is not credible because it may contribute to systemic risk in the economy, which, in turn, may make subsequent bailouts more, rather than less, likely. In terms of alignment with private incentives, this option would limit zombification and contain moral hazard.
Option 4: Asset separation through an individual bad bank model at the national level
‘Bad banks’ – also called asset management companies – have been used in the past to resolve calamities in banking. Sweden in the early 1990s is an interesting case in point. A bad bank typically needs substantial support by the government because losses will be realised. Creating a bad bank tends to invite challenges that relate to the nature of the assets transferred. What is a fair price of a particular loan? How can policymakers ensure that the private information owned by the bank is shared with the management of the bad bank? How can the bad bank optimally manage the assets and maximise recovery? In our assessment we assume that there are clear incentives to maximise the value of recovery. As reported in Table 1, this option would be effective and would provide the right incentives if the bad bank is managed and incentivised in the right way. The risk of moral hazard is limited, but there are still risks concerning national champions. However, in terms of feasibility this option is complex. The structural impact on the banking sector is constrained if national banking champions are preserved or created.
Option 5: Asset separation through an EU-wide bad bank model
A variation on option 4 is to set up an EU-wide bad bank – the irrevocable transfer of non-performing loans by banks to a supranational asset management company. Collecting these loans from across the single market, as reported in Table 1, is effective and might be managed more efficiently and objectively than national vehicles. However, complexity substantial undermines feasibility. Moreover, the supranational solution may trigger ‘mutualisation’ concerns. That being said, it might also incentivize the creation of a market for distressed assets, and ultimately help the development of the Capital Markets Union (Beck 2017). In doing so, it could have a favourable structural impact on the banking system in Europe.
Option 6: Loss capping through debt restructuring/conversion
A different approach to tackling NPLs is a partial transfer of the default risk on each bank loan from a bank to (typically) a public authority. One avenue is via a targeted insurance scheme that offers coverage for realised losses exceeding a threshold level. Another avenue is a scheme where a public body refinances existing bank loans (where these new loans have limited recourse on the bank involved). It should be noted that this is effectively a capital infusion by the government since the bank receives more than the distressed value of the loan. As highlighted in Table 1, this option would be effective and, compared to the bad bank option, it leaves incentives more aligned, preserves the informational advantage of bank relationships, yet might have weaker collection incentives. The feasibility largely depends on the presence of an effective state-owned ‘development bank’, or a similarly established institution. Credibility relies not just on the effectiveness of the development bank, but also on the political strength to deal with the too-big-to-fail problem and moral hazard (see option four). The restructuring consequences of the scheme are partial, as individual loans are the focus; the risk of preserving national champions still exists.
Table 1Overview: Criteria-based assessment of selected options
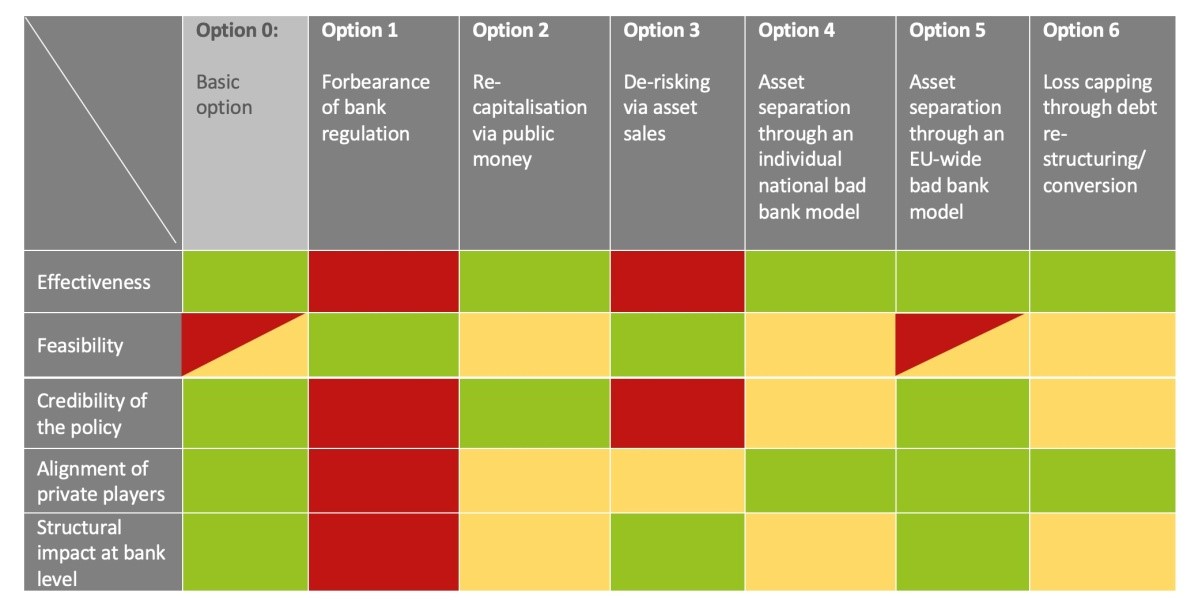
Conclusion
In this column, we have highlighted and assessed several policy options that aim at improving the resilience of European banks. The policy options range from forbearance, public recapitalisation, asset sales/de-risking to asset separation (bad bank at national or EU level), and loan conversion by state banks. We have evaluated each along a list of five criteria that should define the desired response: effectiveness, feasibility, credibility of policy, alignment with private incentives (mitigating moral hazard), and structural impact on the banking industry. Clearly, none of them are a panacea and there are positive and negative aspects to all of them.
Our assessment indicates that asset separation and loan conversion might be crucial for the viability of the European banking system, as these options dominate the other three (forbearance, public re-capitalisation, and de-risking). Among the preferred options, we point to the benefits that an EU-wide bad bank might bring (option 5). Such EU-wide system, collecting NPLs from across the Single Market, could potentially operate more efficiently and could be less prone to capture than national vehicles. On the downside, informational advantages embedded in the long-term bank-firm relationships might be lost. This loss of information would be avoided in a debt conversion scheme (option 6), and possibly also with a national bad bank (option 4).
When it comes to feasibility, the national bad bank and/or debt conversion options might have a benefit but have a disadvantage when it comes to the credibility of the policy. National authorities might still find themselves ‘captured’ by domestic banks.
In this assessment, we have taken no stance on whether an infusion of public money is easier to accomplish at the national or at the European level. We also have not attached a value to the risk transfer to the European level with the pan-European bad bank. It could improve risk diversification but, for sure, raise mutualisation concerns. Although we do not make a specific recommendation, we provide a framework for policymakers to guide them in their decision making.
3 maggio 2021
SERGEI SOARES, FLORENCE BONNET, JANINE BERG
Working from home during the COVID-19 pandemic: Updating global estimates using household survey data
(synthesis; full article – Vox Eu CEPR 25 April 2021 -https://voxeu.org/article/working-home-during-covid-19-pandemic-updated-estimates)
Abstract: At the onset of the COVID-19 crisis, scholars around the world estimated the potential of working from home, given its efficacy as a measure to mitigate the spread of the contagion while allowing productive activities to continue. This column uses household survey data for 31 countries to update previous estimates of working from home during the pandemic. The new data suggest that that during the second quarter of 2020, 557 million workers worked from home, accounting for 17.4% of the world’s employment. This estimate is remarkably close to the previous estimate from May 2020, based on an expert assessment of teleworkability adjusted for occupational distributions.
Keywords: COVID-19 crisis, pandemic, occupation, labour force, teleworkability, occupational distributions.
At the onset of the COVID-19 crisis, scholars around the world estimated the potential of working from home given its efficacy as a measure that could mitigate the spread of the contagion while allowing productive activities to continue. One of the first studies was by Dingel and Neiman (2020), who used occupational descriptions from the Occupational Information Network (O*NET) to derive an estimate that 34% of American jobs could potentially be performed from home. Other scholars adapted their methodology to their particular country circumstance (e.g. Ramiro Albieu 2020 for Argentina and Boeri et al. 2020 for Europe).
Because the O*NET data are for the US, their application is limited to countries with a similar employment structure and working environment. As we were interested in estimating numbers for a world that includes labour markets from Uganda to the UK, we undertook a Delphi survey of labour market experts from across the world and then weighed these estimates by countries’ occupational shares (Berg et al. 2020, ILO 2020).We calculated that 18%, or approximately one in six workers at the global level, were potentially able to work from home. However, the variations by country income group were stark: our estimates for potential home-based work ranged from 27% of the workforce in high-income countries to 17% in middle-income countries and only 13% in low-income ones.
One year since the onset of the pandemic, we now have data from 33 household surveys covering 31 countries that can tell us how many workers were working from home during the second quarter of 2020.We therefore revisit our earlier estimates and derive a new estimate based on the existing survey data (see Soares et al. 2021 for more detail).
The challenge of measuring working from home during the pandemic: A closer look at labour force surveys
Knowing how many workers from across the world shifted to working from home during the pandemic has been difficult, as relatively few countries have household survey data that are both available for the pandemic period and include information on working from home. Moreover, the way the questions are posed differs, making the identification of homeworking difficult.
One crucial aspect is whether the question in the household survey asks from where you normally worked. This type of formulation may lead the respondent to think of a long period and not specifically of the COVID-19 pandemic. Therefore, it may not be sufficient to identify those working from home as a result of pandemic-related restrictions, as pandemic-induced work from home might be perceived as temporary and not typical over a longer period. Many surveys, of course, have always asked about place of work over a specific period such as the last four weeks.
In addition, with the advent of the COVID-19 pandemic and its ensuing lockdowns, a series of ad hoc questions were added to existing surveys and a number of ad hoc surveys were undertaken by different national statistical offices throughout the world. This created a new group of working from home questions that are highly varied.
The UK’s Opinions and Lifestyle Survey added COVID-related questions that distinguished between occasional and fulltime COVID-induced homework. Similarly, the Brazilian PNAD-Covid, which uses outgoing rotation groups from the regular PNADC and calls them by phone with a specific COVID-19 questionnaire, also includes a question designed with the pandemic in mind.
Because both the UK and Brazil have parallel surveys undertaken at the same time and with the same sampling scheme, we can compare how workers declare their place of work. In both countries, outgoing rotation groups are contacted for further questions, which means that they answered both the “usual” and “COVID-19” place-of-work questions, although in different surveys. Figures 1 and 2 show the results.
Figure 1 Great Britain (LFS vs OLS)
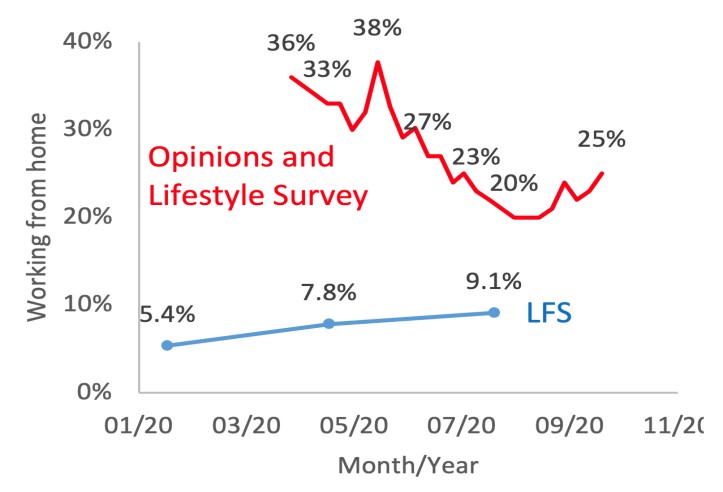
Figure 2 Brazil (PNAD-C vs PNAD-Covid)
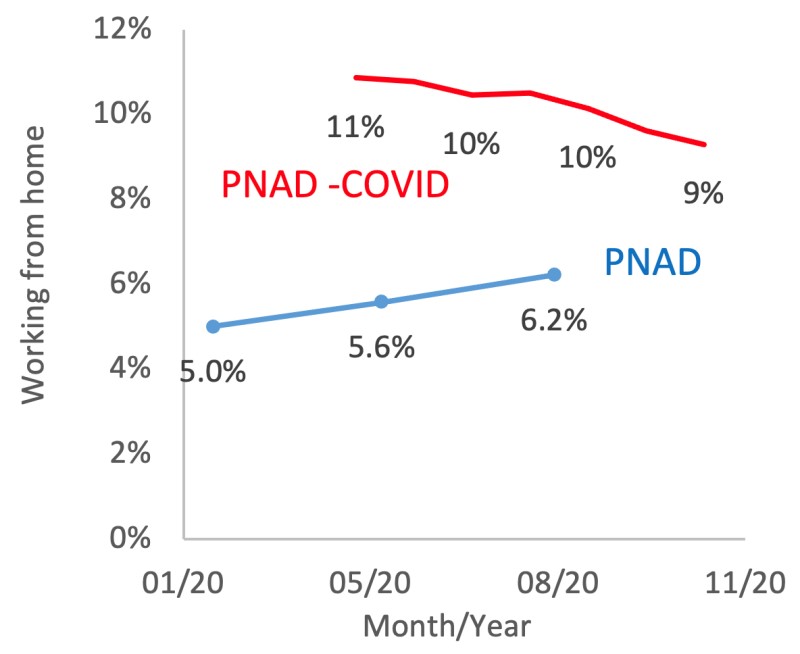
Sources: UK LFS, Brazil PNAD COVID and Brazil PNADC microdata. UK OLS data from ONS.
In the UK, the Opinions and Lifestyle Survey (OLS) average for the work at home question was 33.8% of those employed but the Labour Force Survey figure was 7.8% – about a quarter of the OLS number. For Brazil the differences are less dramatic but still very significant at 5.6% and 11%. In other words, the wording of the place-of-work question is crucial.
In addition, the surveys show opposing trends. Even as the COVID-specific questions show a decrease in home-based work, the “usual place of work” questions show an increase. The obvious interpretation is that growing numbers of workers, after many months at home, begin to think of this work arrangement as the ‘new normal’ and not anomalous.
Other countries took a different approach, such as the question added to the American CPS: “At any time in the LAST 4 WEEKS, did you telework or work at home for pay BECAUSE OF THE CORONAVIRUS PANDEMIC?” This is a difficult question to work with because it creates both upward and downward biases. On the one hand, those who have always worked from home may answer no due to the “because of the coronavirus pandemic” qualifier. On the other hand, those who worked from home only occasionally would answer yes, whereas a person under the same working arrangement would answer no to a question requiring that home be the main place of work. For this reason, we treat the US as a special case in the calculations.
As our focus is on how many people were effectively working from home during the second quarter of 2020, we choose formulations of the place of work question that are consistent with the question we are trying to answer, namely questions that define specific reference periods for working from home and eschew questions about “usual” or “normal” place of work. Luckily, almost all of the 33 surveys we base our estimates upon define specific reference periods.
Estimating working from home using existing household surveys
The countries for which we have surveys represent 43% of employment in high-income countries, 19% in upper-middle-income ones and only 14% of lower-middle-income and low-income ones.1 We therefore stratify countries by income level to derive a worldwide estimate. Nevertheless, there are two important limitations.
The first and most obvious is the limited number of countries used to extrapolate a figure for the entire world. In particular, although some high-population countries such as the US, the Russian Federation and Brazil are in the figures, China, India and Indonesia are not. The second limitation concerns the sample size of some of the surveys, particularly the ad hoc COVID surveys. The sampling errors are much larger for lower-middle-income and low-income countries; while this does not have an impact on the estimate, it does affect the confidence intervals (see Figure 3).
Figure 3 Confidence intervals (95%) for home-based work, by country (survey)
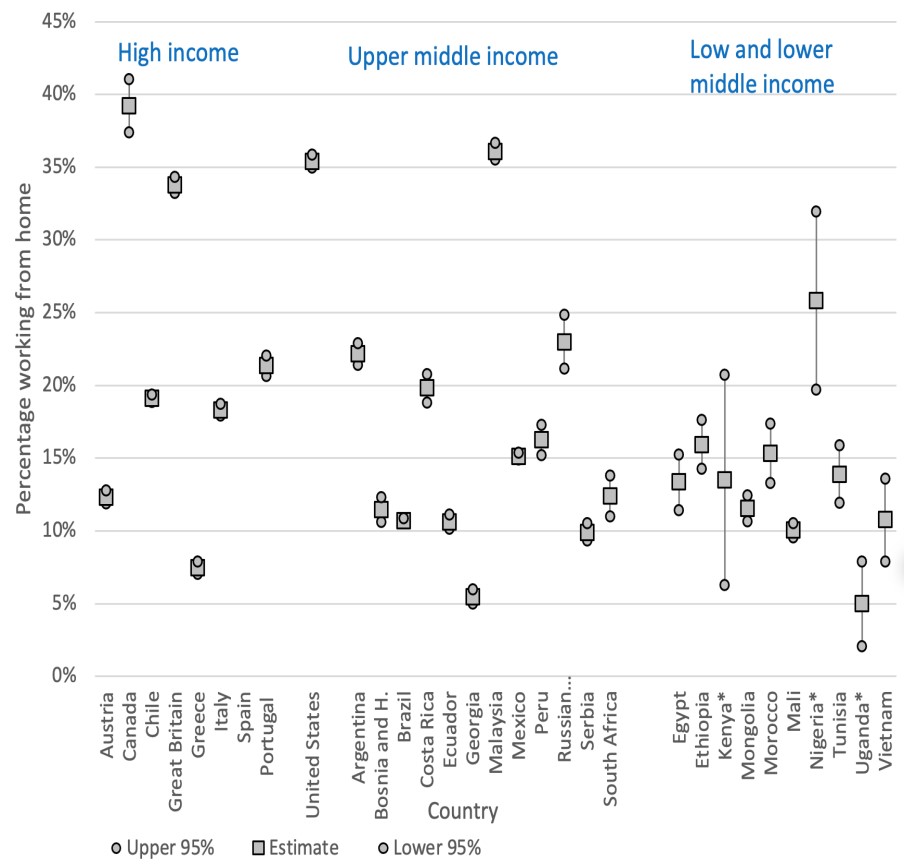
Source: Household, labour force and ad hoc COVID-19 surveys.
Note: 95% confidence intervals are calculated using the normality assumption. Since variances are estimated and not known, a t-distribution would be more appropriate. For large samples, the difference is small.
Calculating the number of individuals working from home during the COVID-19 pandemic
As predicted in the estimates of homeworking potential, the higher the income of the country, the higher the percentage of workers carrying out their work from home. For the US, the figure was 35.4%, and for other high-income countries it was 25.4%. For upper-middle-income countries, the figure was 17.1% and for the lower-middle and low-income country group, it was 13.6%. Using these strata, the global number of workers working from home was estimated at 558 million, which corresponds to 17.4% of global employment (see Table 1).
This number is quite close to our estimates published in May 2020 based on the expert forecasts and adjusted for the occupational distribution of employment (Berg et al. 2020, ILO 2020). The results, which appear in the last column of the table, are surprisingly close: 17.4% for the estimate based on household data versus 18% for the expert assessments.
Table 1 Estimates for the proportions of workers working from home during Q2 2020
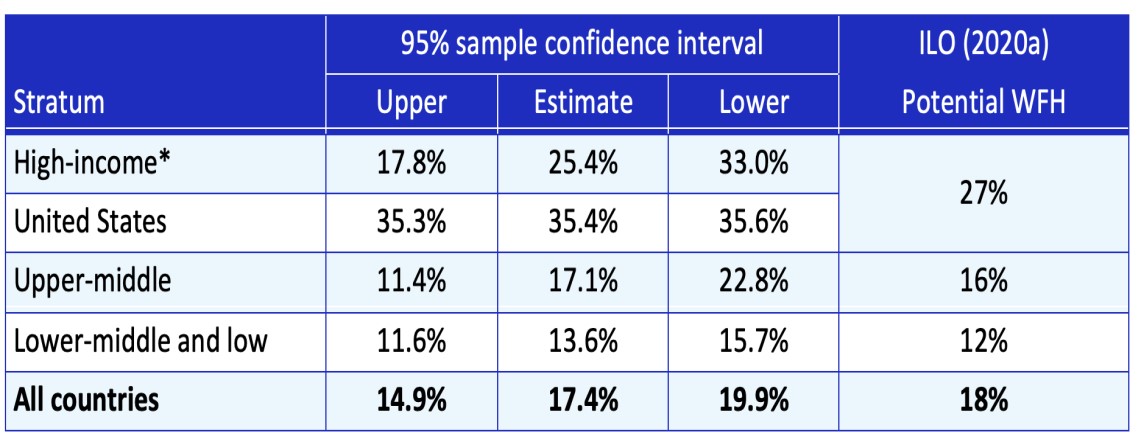
Note: *Excluding US.
Source: Household, labour force and ad hoc COVID-19 surveys.
27 aprile 2021
EMANUEL MOENCH, LORIANA PELIZZON, MICHAEL SCHNEIDER
‘Dash for cash’ versus ‘dash for collateral’: Market liquidity of European sovereign bonds during the Covid-19 crisis
(synthesis; full article – Vox Eu CEPR 23 March 2020 – https://voxeu.org/article/market-liquidity-european-sovereign-bonds-during-covid-19-crisis)
Abstract: In March 2020, a ‘dash for cash’ driven by the Covid-19 crisis affected the liquidity of the US Treasury bonds market as well as numerous other financial markets around the globe. This column investigates how euro area sovereign bond markets fared during the same period. While deteriorations in sovereign debt market liquidity are evident, these appear to be driven by a ‘dash for collateral’ in euro-denominated safe assets. This suggests some differences from the US experience, as well as variations across European countries.
Keywords: pandemic, financial markets, monetary phenomenon, liquidity, bond markets.
The spread of Covid-19 has caused tremendous stress to public health around the globe. As the scale of the pandemic became increasingly clear to investors in March 2020, financial markets were strongly affected – both in terms of valuations and their functioning. Economists use the concept of market liquidity to capture the ease of trading in financial markets. In this column, we study how market liquidity in European sovereign bonds evolved at the start of the pandemic, and explore the main possible drivers of this evolution: ‘dash for cash’ or ‘dash for collateral’.
We first focus on German Bunds, which serve as a benchmark safe asset for the euro area and beyond. The liquidity of risk-free assets such as Bunds is a key measure of market stress. In the US, widespread selling pressure – a ‘dash for cash’ – led to a dramatic deterioration of liquidity conditions in the Treasury market by early- to mid-March (Duffie 2020, Muzinich 2020). To answer the question of whether this deterioration was mirrored in European sovereign bond markets, we use data from the inter-dealer platform, MTS.
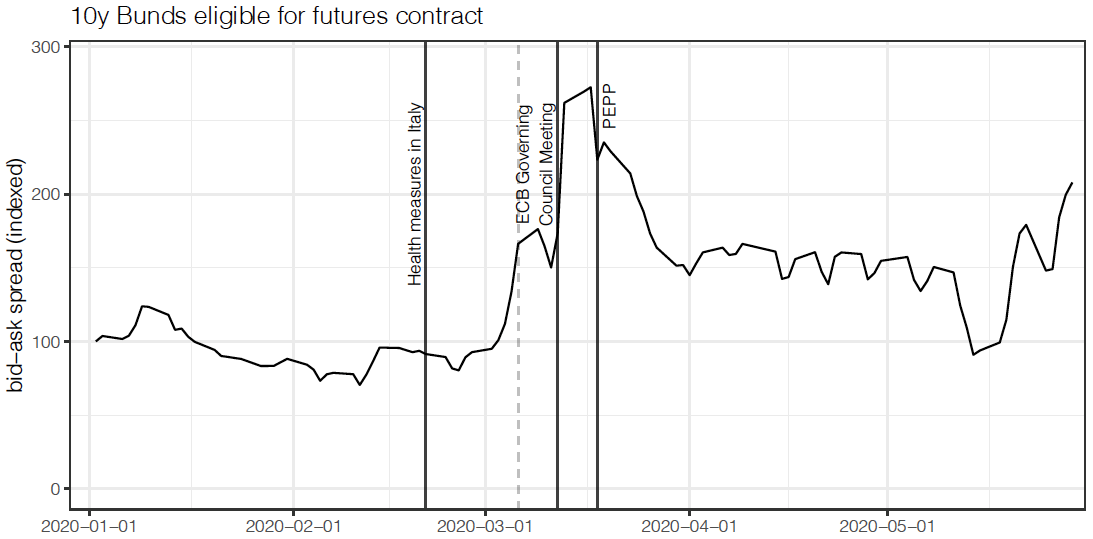
A standard measure of liquidity is the bid-ask spread. This measures the transaction cost dealers charge each other for trading Bunds. Figure 1 shows the evolution of the average bid-ask spread quoted for German reference bonds from January to May 2020.
vertical lines in Figure 1 indicate (1) the enforcement of health measures in Italy on 21 February 2020, (2) the meeting of the ECB governing council on 12 March 2020, and (3) the announcement of the Pandemic Emergency Purchase Program (PEPP) on 18 March 2020.
This programme was introduced to “counter the serious risks to the monetary policy transmission mechanism and the outlook for the euro area posed by the outbreak and escalating diffusion of the coronavirus, COVID-19” (ECB 2020). The figure shows that the bid-ask spread began to rise at the beginning of March. Shortly after the ECB Governing Council meeting, it reached more than double its pre-pandemic level. Around the announcement of the PEPP, the bid-ask spread started to fall again but remained at approximately 150% of its pre-pandemic levels thereafter. The increase in transaction cost is not limited to the inter-dealer segment. As we show in a related research paper (de Roure et al. 2020), transaction costs in the inter-dealer (D2D) and the dealer-to-customer (D2C) segments of the Bund market are closely related. Indeed, a similar picture of increased transaction costs emerges from D2C trades reported on Bloomberg (Nguyen 2021).
Another important indicator of liquidity is the market depth. This is measured as the average overall volume that is quoted via limit orders in the MTS order book. This measure indicates dealers’ willingness to provide liquidity to each other (Schneider et al. 2018).
…
The overall market depth plunged with the introduction of health measures in Italy (21 February 2020), several weeks before a reaction in the bid-ask spread became visible. Only about half of the pre-pandemic level of liquidity was available after February 2020, and there was no discernible improvement after the ECB governing council meeting or the subsequent PEPP announcement. Only in May did market depth improved somewhat. Interestingly the US Treasury market depth retreated well before the bid-ask spread increased (Duffie 2020).
Looking beyond German Bunds, we observe similar patterns in the markets for French and Italian sovereign bonds – the two largest sovereign debt markets in Europe by amount issued. Bid-ask spreads … were at similar levels at the beginning of the year but started to increase in Italy in late-February and in early-March in France. In particular, bid-ask spreads on Italian bonds then spiked sharply in mid-March 2020, reaching very high levels of more than 100 basis points. Bid-ask spreads retreated to approximately 150% of their pre-pandemic levels for all countries by the end of April. The overall volume available for trade … moved in lockstep across countries, and also started to fall shortly after the introduction of health measures in Italy. The drop in overall bond volume available for sale was largest in France.
In the US Treasury market, the sharp increase in trading frictions was accompanied by a spike in sales of Treasuries in March 2020 (Duffie 2020, Financial Stability Board 2020, Vissing-Jorgensen 2020). Similar effects were also observed in the UK gilt market (Hüser et al. 2021). These sales of safe assets were attributed to a ‘dash for cash’ by non-financial corporates, banks, and other intermediaries as the pandemic unfolded (Quarles 2020, Vissing-Jorgensen 2020).
Was the deterioration of European sovereign debt market liquidity that we document above equally associated with widespread selling pressures? To answer this question, we look at rates on repurchase agreements which can be interpreted as a measure of the scarcity of bonds as collateral.
…
In contrast to the US and UK experience, there was a sharp decline in the ‘RepoFunds rate’ for France and Germany at the end of March. That is, borrowers in the repo market were willing to pay a ‘specialness premium’ in order to receive French or German sovereign bonds as collateral (Billio et al. 2020). This suggests a ‘dash for collateral’ – an increased demand for Bunds and French sovereign debt – rather than a ‘dash for cash’. While this effect cannot be seen in Italian sovereign debt, the ‘repo spreads’ do not indicate strong selling pressures at the onset of the pandemic.
To conclude, we document that European sovereign debt markets experienced a strong deterioration of market liquidity at the beginning of the Covid-19 pandemic in February and March 2020. These patterns were similar across the largest three euro area economies, and resemble those in the US Treasury market. However, a dash-for-cash effect with an increased demand for cash or short-term Treasury Bills (as observed in the US) did not manifest itself in Europe for the French and the German sovereign bonds. Instead, the increased economic uncertainty led to an increased demand for euro-denominated safe assets (i.e. a ‘flight to safety’ or a ‘dash for collateral’).
15 marzo 2021
NIELS THYGESEN, ROEL BEETSMA, MASSIMO BORDIGNON, XAVIER DEBRUN, MATEUSZ SZCZUREK, MARTIN LARCH, MATTHIAS BUSSE, MATEJA GABRIJELCIC, LASZLO JANKOVICS, STEFANO SANTACROCE
HIGH DEBT, LOW RATES, AND TAIL EVENTS: RULES-BASED FISCAL FRAMEWORKS UNDER STRESS
(synthesis; full article 08 March 2021 – https://voxeu.org/article/rules-based-fiscal-frameworks-under-stress)
Abstract: National governments and EU institutions enacted unprecedented budgetary measures to mitigate the economic and social impact of the Covid pandemic, a truly exogenous shock. While everyone agrees that a forceful response was needed, the pandemic magnified a number of pre-existing challenges and vulnerabilities in public finances, which need to be addressed in the coming years. This column discusses this year’s conference of the European Fiscal Board on 26 February, at which a prominent line-up of speakers had an open and inspiring exchange on the future of the EU fiscal framework.
Keywords: Covid-19 pandemic, health crisis, fiscal framework, fiscal policy, independent fiscal institutions, European Fiscal Board,
This year’s annual conference of the European Fiscal Board (EFB) attracted more than 300 policymakers, academics, and practitioners from all over the globe. The meeting’s virtual format allowed for a much larger representation of independent fiscal institutions (IFIs) among the speakers and audience. The ambition is to provide an additional forum for IFIs to share their insights on fiscal policy developments and stimulate a broader debate with the community of fiscal experts.
The discussions reflected the concerns of the time: the implications of the Covid pandemic for fiscal policymaking, the sustainability of public finances and, more broadly, the future of the EU fiscal framework. Acknowledging the profound impact of the crisis on the economy and public finances, Valdis Dombrovskis, the European Commission’s Executive-Vice President, opened the conference pointing out that many of the questions on the agenda were not entirely new – high government debt combined with low economic growth and subdued inflation had occupied policymakers well before the Covid-19 shock. The crisis has magnified existing issues, making their resolution more urgent.
The debate revolved around three main topics particularly relevant for the future of the EU fiscal framework: (1) the high debt levels of member states coming out of the crisis; (2) the need for better and more stable medium-term fiscal planning; and (3) the importance of the quality of public finance.
Coping with high levels of government debt
The Covid crisis has led to a sudden jump in government debt, only adding to already elevated pre-pandemic debt-to-GDP ratios in many EU member states. Coming out of the Global Financial Crisis (GFC) more than a decade ago, governments were expected to return to lower levels of debt. Some member states succeeded, others much less, if at all.
…
Naturally, all eyes are and should currently be on ensuring a swift recovery. This point was underscored by all keynote speakers at the conference. At the same time, forecasts predict debt ratios to plateau in the coming years and to gradually decline over time. This may be a repeated fallacy. Indeed, the accuracy of fiscal forecasts of international institutions is not encouraging. Jonathan D. Ostry’s (IMF) analysis of medium-term public debt forecasts in more than 170 economies reveals a clear and widespread optimism bias. For example, after the GFC, five-year-ahead forecasts for the debt-to-GDP ratio were on average off by 10% of GDP as forecasters repeatedly or naively expected a steady decline in the medium term. Over-optimism also tends to be larger the higher the initial debt.
…
IFIs have played an important role in containing the optimism of government forecasts by critically assessing and validating government projections (Jonung and Larch 2006). As Eddie Casey (Irish Fiscal Council) shows, EU IFIs have become important sources of budgetary forecasts to ensure more realistic predictions underpinning government budgets. Aside from traditional stochastic debt sustainability analysis, IFIs also produce deterministic analysis in the form of different ‘scenarios’. These are particularly helpful in highly unusual times, when past patterns in the data are unlikely to be repeated. Both analytical tools have merits and should be seen as complements, as Claudia Braz (Banco de Portugal) pointed out.
…
The stark differences across scenarios underscore the sensitivity of forecasts to the underlying assumptions on potential growth, especially when the debt-to-GDP ratios are high. The scenarios range from a gradual decline back to pre-crisis debt levels, to steadily rising debt ratios. In addition, implicit debt linked to pre-existing pension claims and significant guarantees extended during the pandemic, threaten debt sustainability without being fully accounted for. Charles Goodhart (Professor Emeritus, London School of Economics) warned that pandemic-related deficits are but a blip compared to ageing related costs that will exert growing pressure on public finance in the next decades. In the end, all forecasts point to formidable challenges ahead.
Building the foundation through quality public finance
In recent years, ultra-low interest rates have contained sovereign borrowing costs despite sharply rising debt levels, thereby supporting debt sustainability – for now. As Isabel Schnabel, Member of the ECB’s Executive Board, noted in her keynote speech, monetary policy has been very accommodative throughout the past decade and, faced with the current crisis, reacted swiftly with further new unconventional policy tools – foremost the Pandemic Emergency Purchase Programme (PEPP). At the same time, constrained by the zero lower bound on nominal policy rates, monetary authorities also look at fiscal policy to provide unconventional support for stabilisation purposes. In this context, Giancarlo Corsetti (Cambridge University) argued that independence should not be used as an argument against the complementarity of monetary and fiscal policy. An appropriate policy mix and, hence, coordination of macroeconomic instruments has rarely been as decisive as now.
While financial markets expect real interest rates to stay low for some time, the ECB will have to keep a close eye on inflation, while governments cannot bet on an indefinite continuation of current policies. Consequently, while in the current low-interest environment issuing debt may look like a free lunch for governments, in truth, it seems unlikely to hold. Kenneth Rogoff (Harvard University) suggested that advanced economies may have ‘graduated’ from outright default but reminded how periods of high debt are associated with lower economic growth and that a high debt burden may reduce the fiscal flexibility during the next crisis.
True, interest rates have been outstripped by growth rates in recent history for advanced economies and global real interest rates have been on a long-term gradual decline. However, the currently ultra-low interest rates are well below any historical trend and there is no guarantee the negative interest-growth differential will continue indefinitely. At the very least, governments face an increased sensitivity of debt sustainability to interest rate spikes or persistent growth slumps. Some EU member states have already suffered from protracted low growth. It will be one of the key tasks of governments to enhance potential growth coming out of the crisis in order to dampen the pressure on outright consolidation.
Against this background, the quality of public finance is stepping into the spotlight. Aside from effective tax collection, much of the debate has recently focused on the allocation of government spending. The crucial point here is not necessarily how much the government spends, but how and on what. By extension, this also applies to debt-financed spending. As Commissioner Gentiloni put it in his speech, there is ‘good’ debt (for research, education, infrastructure, hospitals) and ‘bad’ debt (for non-productive spending). This logic is relevant not only for supportive measures now but also in the eventual consolidation phase. In the past, EU governments had the tendency to disproportionately cut back public investment. The EFB has repeatedly called for stronger focus on growth-enhancing government expenditures and proposed ways to stimulate these also through the Stability and Growth Pact (SGP) – beyond the already existing, but scarcely used, ‘investment clause’.
The Recovery and Resilience Facility (RRF) is a welcome new financial instrument to boost public investment. It is a unique chance to show the viability of such an EU facility, thereby strengthening the case for a euro area central fiscal capacity. As Thiess Büttner (Friedrich–Alexander University Erlangen–Nürnberg) pointed out, the asymmetric distribution of RRF grants not only supports those member states disproportionally affected by the pandemic, but incidentally also those with high debt levels. Moreover, the accompanying reform packages to be outlined and approved in the Recovery and Resilience Plans have the potential to structurally improve the quality of public finance. If implemented successfully, the RRF can play an important role towards enabling member states to grow out of their debt; it is an opportunity Europe cannot afford to miss.
Looking beyond the next budgetary year
One pre-existing weakness in the fiscal domain that has worsened over the years is medium-term fiscal planning. Medium-term perspectives were supposed to become more important in the reformed SGP, but they have recently lost in significance (European Fiscal Board 2019a). The notorious focus on the short-term has been one of the contributing factors to many member states entering the Covid crisis with only limited fiscal space. IFIs and the EFB have been critical on the implementation of European as well as national fiscal rules in practice. Lucía Rodríguez Muñoz (Independent Authority for Fiscal Responsibility, Madrid) presented evidence on the implementation gap, which hinders effective medium-term fiscal planning. While planning for the following year tends to provide a good guidance on eventually realised outlays, plans of outer years are “frequently aspirational rather than constraining”. Best practises often rely on a strong political commitment and in a few cases fixed fiscal targets, which are also binding for the outer years – for example, throughout an electoral cycle. Fiscal targets should have clear counterparts in budgetary execution and should be easy to communicate, for example, through to medium-term expenditure growth ceilings. Gilles Mourre (European Commission, DG ECFIN) noted that moving to a debt anchor and net expenditure rules is likely to be conducive to strengthening the medium-term perspective of the fiscal framework.
The future of the EU fiscal framework
The European Commission will relaunch its economic governance reviewin 2021. This provides the opportunity to address some of the well-documented weaknesses of the EU fiscal framework (e.g. European Fiscal Board 2019b). The crisis has added urgency to the review.
The impact of the pandemic also doubles down on the question of how to square the very high debt levels with the current debt rule. The debt benchmark requires a fiscal adjustment towards the 60% of GDP threshold with a reduction of the distance to the threshold by, on average, one-twentieth on an annual basis. Nicolas Carnot’s contribution showed that if the debt benchmark were enforced, it would require an onerous adjustment effort for countries with debt ratios well above 100% and low economic growth. A review could introduce a differentiated adjustment pace (Thygesen at al. 2020). Several speakers echoed the calls by the EFB for a fiscal framework that combines a debt anchor and a single operational rule (net expenditure growth). Such a framework would be less complex and easier to communicate. It would continue to pursue long-term sustainability of public finances but with fiscal variables that are under more direct control of the government (expenditure growth) and translate into better compliance, provided enforcement can be ensured. There are of course many other aspects of the SGP that could be addressed in the review. Lorenzo Bini Smaghi (Société Générale), for example, alluded to the asymmetry of the fiscal rules while others commented on observed pro-cyclicality of fiscal policy.
Overall, expectations ran high for the economic governance review, initially launched in February 2020 and put on hold when the Covid pandemic hit the EU. The activation of the general escape clause of the SGP provides a unique opportunity to return to a fully-fledged, rules-based fiscal policy with a simpler, nimbler, and more resilient fiscal framework
8 marzo 2021
Vincent Aussilloux, Adam Baïz, Matthieu Garrigue, Philippe Martin, Dimitris Mavridis
FISCAL PLANS IN EUROPE: NO DIVERGENCE BUT NO COORDINATION
(synthesis; full article – VoxEu CEPR 06 February 2021 -: https://voxeu.org/article/fiscal-plans-europe-no-divergence-no-coordination)
Abstract: The Covid-19 crisis has presented policymakers across the euro area with an unprecedented challenge, not least of all because the shock has come to both the supply side and the demand side of the economy. This column presents a preliminary analysis of different nations’ responses so far, focusing on which measures have been deployed to address each side of the economic shock and where a ‘mixed approach’ has been taken to work in tandem. At a time where coordinated action may be needed, there is a concerning level of inconsistency in strategy.
Keywords: Covid-19 pandemic, health crisis, euro area, fiscal response.
In the early stages of the Covid-19 crisis, concerns emerged over potential divergence in the euro area (e.g. Boot et al. 2020). These concerns were valid given the unprecedented scale and asymmetric impact of the shock. These concerns were also aggravated by the initial situation of the euro area, with potentially destabilising imbalances between ‘core’ and ‘periphery’ countries.
Calls for coordinated responses – in particular on the fiscal front – appeared quickly (Baldwin and Weder di Mauro 2020). The ECB acted fast in order to provide fiscal space (Bartsch et al. 2020a) by keeping borrowing costs low and by effectively providing a monetary backstop to government debt. The same authors also noted that “correcting current imbalances between investment and saving, could set in a virtuous circle of stronger growth and reduced indebtedness” (Bartsch et al. 2020b). The fiscal response at the national level was strong all over Europe, and the unprecedented fiscal package adopted by the European Council this summer – Next Generation EU – is an important step towards addressing potential divergence in the euro area.
By allocating more funds to countries most affected by the shock, the EU Recovery and Resilience Facility has chosen the right strategy. But two concerns remain. First, there is no explicit objective to reduce euro area current account imbalances. Second, there is no coordination of national fiscal plans and this may actually increase pre-existing current account imbalances.
In a recent report produced by the French Productivity Board (French National Productivity Board 2020), we provide a preliminary (but incomplete) step towards analysing this concern. To do this, we compiled a comprehensive and detailed comparison of all measures announced by the largest six European economies, five euro area countries (Germany, France, Italy, Spain, and the Netherlands), and one outsider (the UK). A summary of our findings is presented here.
A comparison of aggregate amounts of emergency and recovery plans
Our main contribution is to offer a detailed comparison of the nature of fiscal plans for these countries. Other investigations (Bruegel 2020, OECD 2020) offer complementary analysis on a different set of countries. The detailed data on the measures, available for other researchers, can be useful for further analysis. It is important to stress that announcements may ultimately differ with actual spending. But at this early stage we can only analyse announced measures. To facilitate comparisons, we begin by distinguishing two categories of schemes. First, there are fiscal measures such as subsidies or tax credits. Second, there are liquidity and guarantee measures, such as deferral of taxes and social contributions, state-guaranteed loans, or public guarantees. This distinction avoids mixing expenditures with immediate effect and guarantees that will have – in all probability – only limited impact on the budget balance in the coming years. Liquidity and guarantee measures are therefore dealt with separately in our report, and the descriptive statistics presented thereafter relate only to immediate fiscal measures in the sense that there are no repayments expected from the economic agents benefiting from them.
The largest fiscal response was announced in Spain, with a global effort (emergency and recovery) equivalent to 11.2% of its GDP. The UK and Germany are second and third, with announced amounts equivalent to 9.1% and 8.4% of their GDP, respectively.
In this context, France’s announced response is large by historical standards, at 7.6% of its GDP (€185 billion). However, its emergency measures are smaller than in other countries in the sample, with 3.8% of its GDP (€93 billion) against 8% in the UK, 5.4% in Spain, 4.8% in Germany, 4.5% in the Netherlands, and 3.8% in Italy. On the other hand, in comparison with Germany, the French recovery plan is slightly larger (3.8% of its GDP compared with 3.6% in Germany), but with a lengthier implementation over time (four years compared with only two in Germany).
Figure 1 Amount of announced immediate fiscal emergency measures and recovery plan by country, excluding liquidity and guarantee measures and excluding automatic stabilisers
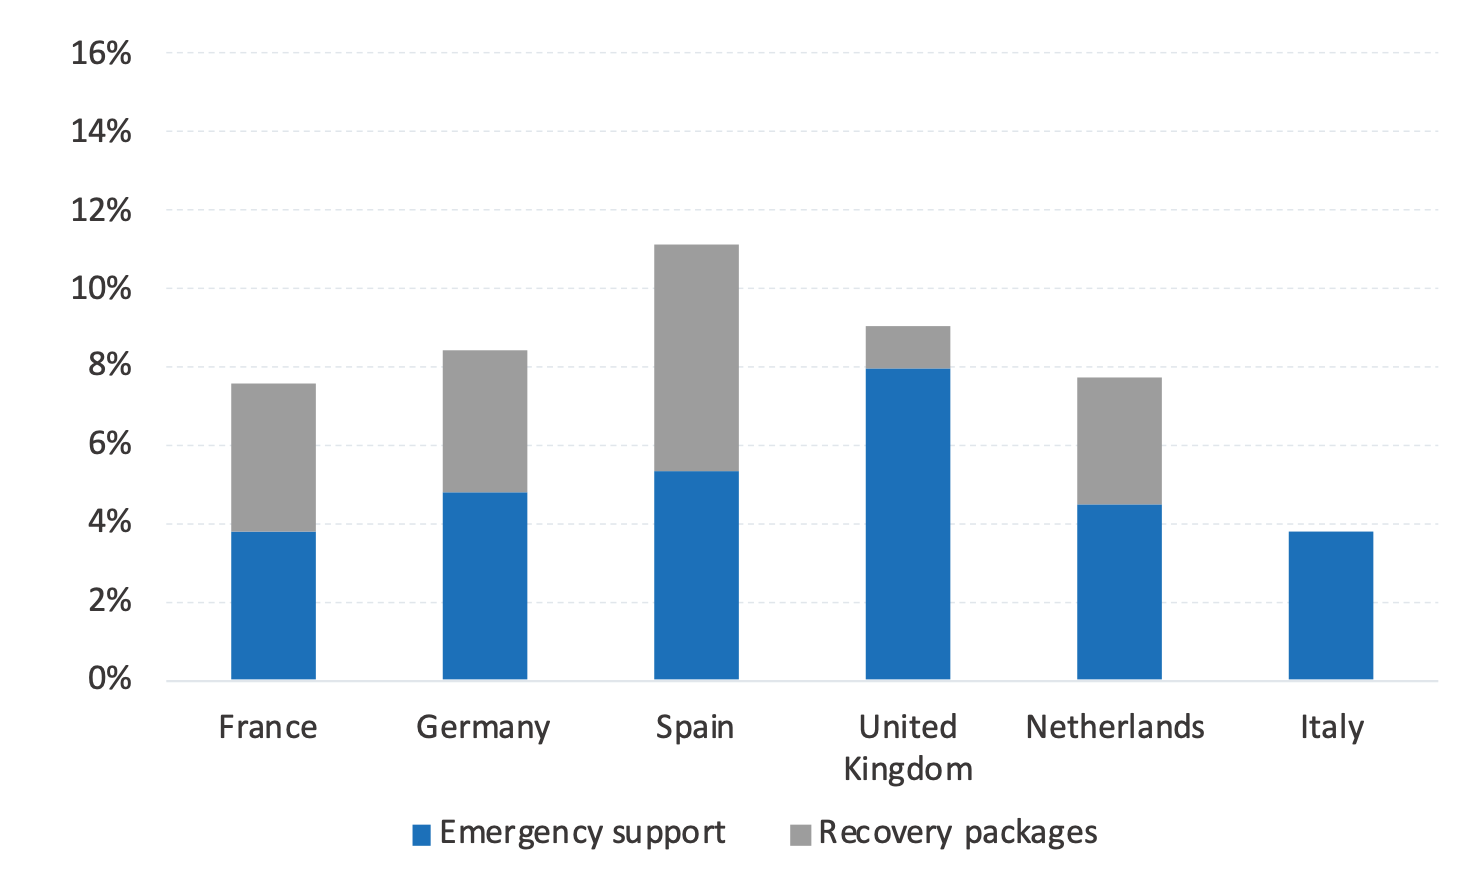
Note: the aggregate amounts of the national emergency and recovery packages correspond to the amounts announced on 17 December 2020 for France and on 15 or 20 November for the other countries. The measures announced are more or less spread out over time depending on the country: until the end of 2021 at the most for the emergency measures, until the end of 2023 at the most for the stimulus measures (see details in the annexes). Source: National sources; authors’ calculations.
Supply, demand, and mixed measures
One question on the impact of national fiscal plans is that if countries target measures differently on the demand- and the supply-sides, this may affect trade imbalances. Hence, we distinguished measures according to whether they support supply, demand, or a third category – ‘mixed’ – whose effects are considered as affecting both simultaneously.
Most of support packages to businesses deployed by the various countries are aimed primarily at small and medium-sized enterprises (SMEs), very small enterprises (VSEs), self-employed workers, and freelancers. These measures support the continuation of the economic activity, but also provide income-replacement for entrepreneurs experiencing a sharp fall in income. These packages are hence included in the ‘mixed’ category. Short-time work schemes were a typical example of these ‘mixed’ measures, as they both reduce costs of firms and alleviate the fall in income for workers who otherwise might have lost their jobs.
Only support and subsidies intended for mid-sized and large companies (or addressed by default to all companies regardless of their size) were included in the ‘supply’ category. ‘Demand’ measures are those designed to support the income of households and vulnerable persons (such as the extension of social benefits), measures to stimulate consumption (such as VAT cuts), or health expenditure (purchase of medical equipment, increased¬ medical staff costs linked to recruitment, and increased working hours, etc.).
As far as emergency measures are concerned, all countries except Spain converge on an immediate effort – mainly focused on partial activity schemes as well as aid to SMEs, VSEs, and the self-employed (included in the ‘mixed’ category). These schemes represent up to 69% of the effort in Germany, 65% in France, 55% in Italy, 52% in the Netherlands, and 51% in the UK. This should not be a surprise. The Covid-19 crisis affected both the demand- and the supply-side of the economy, and the government measures responded accordingly through ‘mixed’ measures that supported both sides.
This is followed by demand mechanisms, which account for 49% of fiscal emergency measures in Spain, and 41% in the UK and the Netherlands. The proportion of emergency measures to support demand is more limited in France (19%) and Italy (22%).
Figure 2 Emergency plan allocation strategy by country
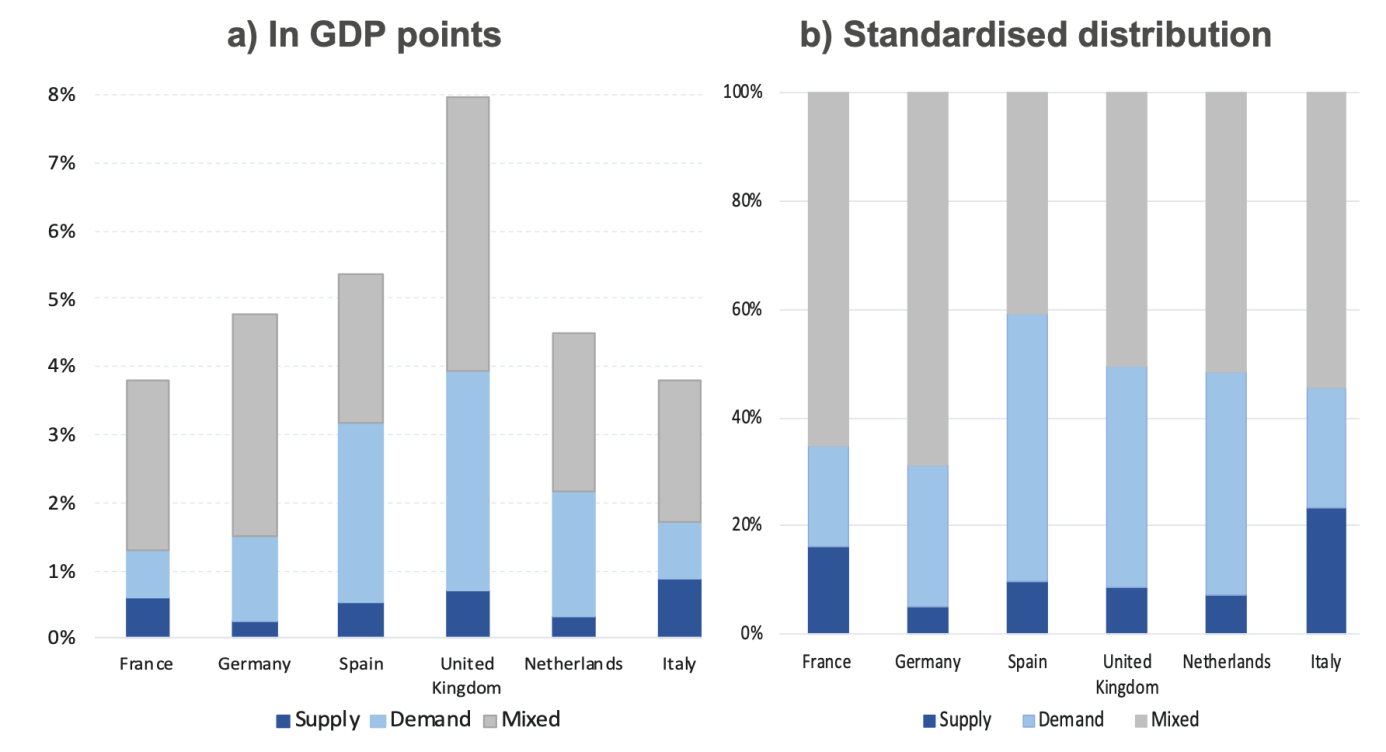
Note: the amounts indicated are spread over 2020 and 2021 for most countries.
Source: National sources; NPB restatements and calculations.
As far as recovery packages are concerned, there are two distinct groups of countries. On the one hand, the UK and the Netherlands, for example, have recovery plans that are overwhelmingly demand-driven (89% of the total amount for the Dutch plan, 69% for the UK plan). On the other hand, Spain, Germany, and France present recovery plans that are more balanced between supply and demand measures. Germany and Spain, for example, are allocating around 49% of their stimulus spending to support demand, followed by France (42%). It is also notable that UK recovery measures (1.1% of GDP) are much smaller than those of its European neighbours. At the time of writing, the details or the Italian recovery plan are not known, therefore it cannot be included in the analysis.
Based on this preliminary analysis, there is no overwhelming evidence that national government fiscal plans strongly diverged on favouring the demand or the supply side of the economy. From that point of view (qualitative rather than quantitative), the concern that they could aggravate trade imbalances may not materialise. However, this also implies that because of the absence of coordination on these plans, they have not been used to reduce imbalances in the euro area. For example, a country with larger trade surplus like Germany has not tilted its fiscal plan towards more support to demand. Another risk we identify in the report is that countries with current account surpluses may be the first to reduce their fiscal stimulus.
Protection and reallocation measures
The distinction between supply and demand measures is standard and useful, but the ‘mixed’ nature of the crisis (and of a large part of the policy response) means it is not clear-cut. For this reason, we compared countries’ fiscal responses in another dimension: we classified the different measures on whether their objective was to ‘protect’ or to ‘reallocate’. The first category contains measures that aim to protect households or firms against the economic and pandemic shock (bankruptcies, income loss, lack of access to healthcare, etc.). The second group contains measures encouraging the reallocation of resources in the economy to promote structurally a more productive and greener recovery, improving the competitiveness or accelerating the energy transition.
Protection measures are generally more short-term. In contrast, reallocation measures are more structural and long term.
In the protection category, we included partial unemployment measures; aid for SMEs, VSEs, and the self-employed; exemptions from social security contributions; and health care expenditure. In the reallocation category, we included measures to support innovation, promote energy transition, as well as investment in infrastructure.
All countries except Spain mainly focused on protection measures. These comprised mostly of support to SMEs, VSEs, and the self-employed; health expenditure; or partial unemployment schemes. This type of measure represents 92% of all emergency and recovery measures announced by the UK (8.4% of GDP) and 71% in Germany (6% of GDP). The vast majority of protection measures are in emergency packages, while reallocation measures are almost exclusively contained in recovery packages.
Spain, France, and the Netherlands present more balanced strategies between protection and reallocation measures, while the UK and Germany focused more on short term protection. Reallocation measures account for 51.5% of the overall effort in Spain (5.7% of GDP), 42% in France (3.2% of GDP), and 40% in the Netherlands (3.1% of GDP). It is therefore interesting to note that these three countries stand out from the others by a strategy that is relatively more focused on long-term reallocation arrangements than short-term protection.
Figure 3 Protection and reallocation measures by country
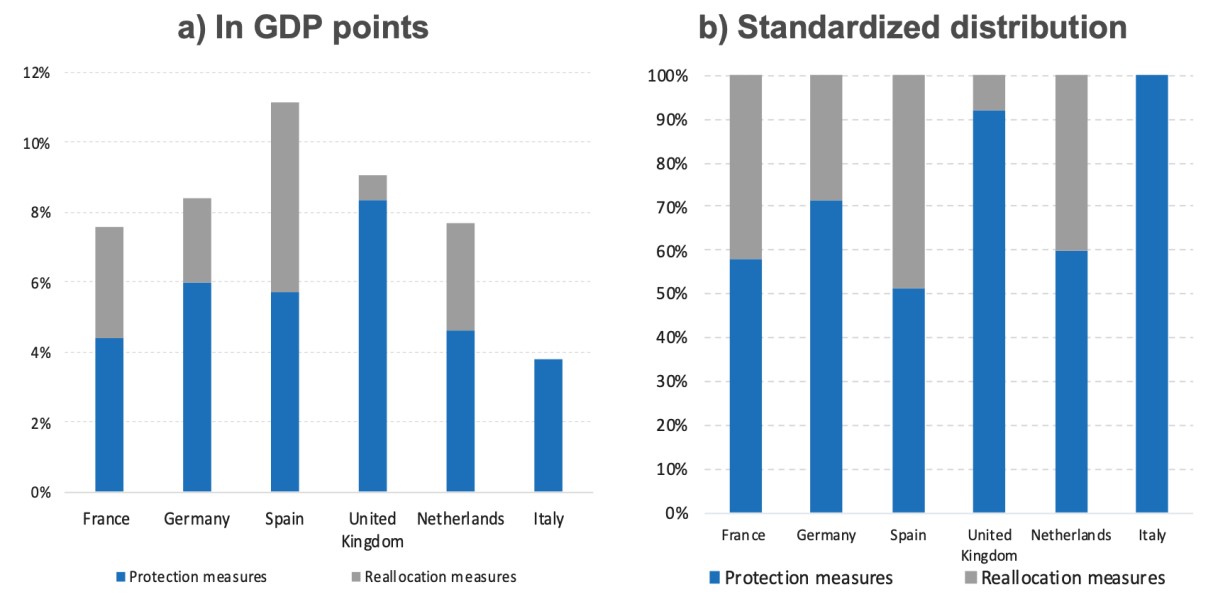
Source: National sources; NPB restatements and calculations.
Note: The Italian recovery package is not included as the full details of its content are not yet available at the time of writing.
23 febbraio 2021
Catarina Midões, Mateo Seré
MILLIONS OF EUROPEANS WOULD FALL INTO VULNERABILITY IF IT WERE NOT FOR COVID-19 UNEMPLOYMENT BENEFITS
(synthesis; full article – VoxEu CEPR 06 February 2021 -: https://voxeu.org/article/millions-europeans-would-fall-vulnerability-without-covid-19-unemployment-benefits)
Abstract: The COVID-19 outbreak has induced dramatic economic shocks in European countries. Using ECB survey data, this column examines households’ financial vulnerability to an income shock in seven European countries and assesses the degree of protection awarded to employees by COVID-19 employment protection schemes. It finds that 18.2 million individuals, or 7% of the population of the countries analysed, cannot cover one month of food and utilities by resorting to their deposits, pensions, and public transfers. Importantly, there is a significant drop in the number of vulnerable with COVID-19 unemployment benefits. Rent and mortgage suspensions are more effective in some countries than in others.
Keywords
Covid-19 pandemic, health crisis, economic shocks, households’ financial vulnerabilities, unemployment, mitigation policies.
The COVID-19 outbreak has brought, alongside a major health crisis, dramatic economic shocks to European countries. Governments around the continent are taking different measures to face the pandemic while preserving jobs and incomes (Baldwin and Weder di Mauro 2020). With economic activity far below pre-pandemic levels, many households are still witnessing substantial decreases in their earnings (Adams-Prassl et al, 2020).
In a recent paper (Midoes and Seré 2021), we analyse households’ financial vulnerabilities to an income shock and assesses the degree of protection awarded to employees, in different European countries, by COVID-19 employment protection schemes. The literature has measured financial vulnerability with different approaches, such as possession of financial assets, amounts in savings accounts and access to credit, or by directly asking individuals how confident they are that they could come up with a certain amount of money to face an unexpected need (Lusardi et al. 2011).
In our work, we instead define households as financially vulnerable or not by assessing whether they could cover their usual basic expenditures under a hypothetical shock. For that we analyse whether they could afford food and utilities, rent and mortgages if deprived of their privately earned income, resorting instead to a combination of savings and publicly provided income such as pensions, public transfers first, and also COVID-19 unemployment protection.
Our data come from Wave 3 of the ECB Household Finance and Consumption Survey (HFCS), conducted in 2017 where we consider seven countries (Austria, Belgium, Finland, France, Germany, Italy and Portugal). Given that the HFCS only covers gross income, we simulate net incomes obtained under the actual COVID-19 unemployment protection schemes enacted by each country through a microsimulation model, EUROMOD.
Vulnerability without unemployment protection schemes
For the seven countries of our sample, we estimate that 31.2 million individuals – or 12.8% of their combined population – are financially vulnerable when we consider food and utilities over a three-month horizon, meaning that they would not be able to afford those expenses for three months without privately earned income.
…
Both rent and mortgage expenses substantially increase the number of vulnerable individuals. Without privately earned income, 47.2 million, or 19.4% of the population analysed, cannot afford expenses once we add rents and mortgages to their basket. In relative terms, the impact of housing expenses is more severe in countries such as Germany and France – in the former, the percentage of vulnerable individuals jumps from 12.2% to 19.9%; in the latter it doubles from 9.2% to 18.4% – than in Portugal or Italy.
By restricting our sample to households where at least one individual has been in employment throughout the previous year, we consider whether households can afford expenses when they are deprived of their salary but are instead receiving COVID-19 unemployment benefits.
…
When we consider rent and mortgage as part of basic expenses, the percentage of vulnerable individuals increases to 10.5%. Nonetheless, COVID-19 employment protection benefits reduce the percentage of vulnerable individuals to 2.1%. …The benefits are again quite effective at reducing vulnerabilities across all countries. In Italy, Portugal and Belgium, where vulnerability is highest at baseline, we estimate only 5.0%, 4.2% and 3.7%, respectively, of those affected are vulnerable at the three-month mark. Despite the effectiveness of the scheme, Italy is the country with the highest absolute number of vulnerable individuals, at 969,000. France, where only 0.85% of those affected are vulnerable, nonetheless follows with 360,000.
Effects of a more generous COVID-19 unemployment benefit
With the exception of Finland – where the unemployment benefit is a daily fixed amount – the unemployment scheme covers a percentage of salaries, varying from 60% (in Portugal) to 90% (in Austria). By raising the replacement rate to 90%, we observe a reduction of individuals’ vulnerability in all countries. A more noticeable effect is observed in Italy and Portugal, but there are also meaningful reductions in countries with an already extremely low percentage of vulnerable individuals (i.e. in France, Finland and Belgium).
This highlights the fact that the vulnerable individuals identified in our simulations do not come from gaps in coverage generated by our procedure, but from the coverage itself not being sufficient for expenses. The results we now find, where there is an important reduction of vulnerability under a more generous layoff scheme, are a reflection of this. It should be noted that while the performance of Belgium was among the best before considering COVID-19 unemployment benefits, after its consideration, the country only performs better than Italy and Portugal. This is because the Belgian COVID-19 income support is amongst the least generous.
…
Effect of a suspension of rent and mortgages on the main household
We can see the percentage of vulnerable individuals when we consider expenses on food and utilities, rent and mortgage, at the three-month mark, detailing how much each expense contributes to overall vulnerability. In Germany and Italy, expenses with rent explain a larger part of vulnerability than mortgages. For example, in Italy, the percentage of individuals who would not be able to cover expenses considering food and utilities, rent, and mortgages is 22.3%. This percentage would be reduced by 3.4 percentage points if a rent suspension were enacted. By contrast, it would only be reduced by 1.5 percentage points if instead mortgages were suspended. We observe the opposite in countries such as Belgium and Portugal. In these countries, while rent suspension would only reduce the percentage of vulnerable individuals by 1.6 percentage points and 3.1 percentage points, respectively, mortgages suspension would reduce it by 6 percentage points and 6.4 percentage points, respectively.
When we analyse these policies under a scenario where individuals are receiving the COVID-19 layoff, in Portugal, rent and mortgage expenditures play a similar role, in Italy rent remains more relevant, and in Belgium mortgages remain more relevant. Rent and mortgage suspensions thus can be an effective support for vulnerable households. In most countries, both under a non-salary scenario and under COVID-19 benefits, mortgages play a more relevant role. Yet, in Italy, rent is more relevant, while in France, they are equally important. This highlights the need to develop country-specific policies for alleviating vulnerability.
Concluding remarks
While we still do not know how long the economic recession induced by the COVID-19 pandemic will last, in this column we attempt to provide evidence on how sensitive individuals are to this type of shock and on the effectiveness of the enacted mitigation policies.
Even with pensions and public transfers, a large number of individuals depend on household privately earned income to cover for their most basic expenses in the very short term – 18.2 million individuals, or 7% of the population of the seven European countries analysed, cannot cover one month of food and utilities by resorting to their deposits, pensions and public transfers. At the three-month horizon, this number increases to 31.2 million, or 13% of the population analysed. We observe a significant drop in the number of vulnerable people when we award them COVID-19 unemployment benefits. By considering net incomes on households of employees, we find significant differences across countries. Employees in Austria, Finland, Belgium and Germany are less vulnerable to a labour income shock than those in Italy and Portugal. The employment protection schemes awarded are extremely effective in decreasing these numbers, particularly in Italy. Rent and mortgage suspensions are more effective in some countries than in others. Countries like Portugal, Belgium and France can achieve an important reduction in their vulnerability through these measures, while in Italy they should be coupled with COVID-19 unemployment benefits to bring about a meaningful reduction.
Two reasons explain why countries like Austria and France perform better than, for example, Portugal. The first is that, in the former two countries, only 2.1% and 2.5%, respectively, receive an income below basic expenses under the scheme, while in Portugal that figure is 12.7%. The difference in the generosity of the support results in a more effective public transfer in the former two countries, just as with non-COVID-19 public transfers. The second reason is the pre-existing differential in savings – French and particularly Austrian households can cover their expenses from deposits alone for a longer period of time.
Countries with wider fiscal space can enact more generous policies. The layoff schemes in Austria and Finland are more generous than the Portuguese. Households in these countries, according to our results, are the most robust to overall income shocks, being able to sustain expenses from deposits alone for longest. These differentials in suffered impact, household finances, and public finances underlie the different perceptions of urgency about the crisis and different eagerness for concerted EU financing of support policies.
15 febbraio 2021
SIMEON DJANKOV, EVA (YIWEN) ZHANG
As COVID rages, bankruptcy cases fall
(synthesis; full article – VoxEu CEPR 04 February 2021 -: https://voxeu.org/article/covid-rages-bankruptcy-cases-fall)
Abstract: Bankruptcies have fallen sharply in OECD economies because of the array of COVID-related support available to businesses, as well as imposed moratoria on bankruptcy filings. This column argue that this situation won’t last, and that governments should start planning for a surge by the end of 2021 – ideally by reforming their bankruptcy laws, as the UK has done, and lessening the burden on courts.
Keywords
Covid-19 pandemic, bankruptcy, advanced economies, job support programmes, insolvency laws.
Economic crises bring an upturn in bankruptcies. Companies suffering losses struggle to survive, and many fail. A wave of bankruptcy filings was expected in the wake of COVID-19 too (Bailey et al. 2021). Yet during 2020, the number of corporate bankruptcy filings in most advanced economies – members of the OECD – fell by 17% relative to 2019, and by even more relative to previous years (Figure 1). This decline in bankruptcy cases demonstrates the success of the initial COVID-19 response measures. On second glance, however, it brings worries too (Blanchard et al. 2020).
Figure 1 Average 2020 bankruptcy filings are 17% lower than in 2019
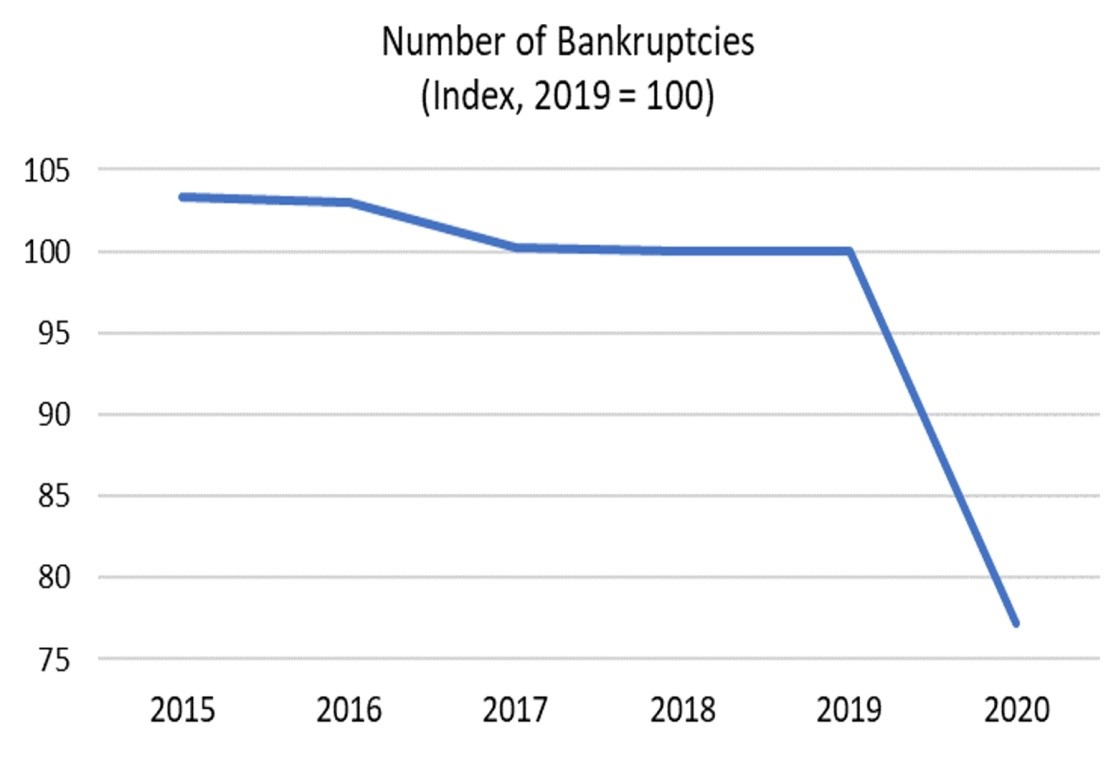
Note: The index is based on total number of bankruptcies in 25 advanced economies (Australia, Austria, Belgium, Canada, the Czech Republic, Denmark, Estonia, Finland, France, Germany, Iceland, Japan, Luxembourg, the Netherlands, New Zealand, Norway, Poland, Portugal, South Korea, Spain, Sweden, Switzerland, Turkey, the United Kingdom and the United States. For 12 economies (Australia, Belgium, Canada, Estonia, Finland, Germany, Iceland, Norway, Spain, Sweden, Turkey and the United Kingdom), the latest available data (most often to November 2020) are annualized to 2020 annual aggregates.
Source: Authors’ calculation using national data (accessed through Macrobond on 26 January 2021).
Bankruptcy filings have declined in 24 of 25 advanced economies
Data for 2020 are available on bankruptcy filings in 25 OECD economies. In the US, these fell by 16% relative to last year. The other major economies show the same pattern of decline. In Japan and Germany the falls are 7% and 13%, respectively; in Canada and the UK, bankruptcies fell by around a quarter (Figure 2). The largest decline is in Australia and France (40%), while Poland is the only country that shows no change relative to 2019.
Figure 2 Bankruptcy cases decline across advanced economies
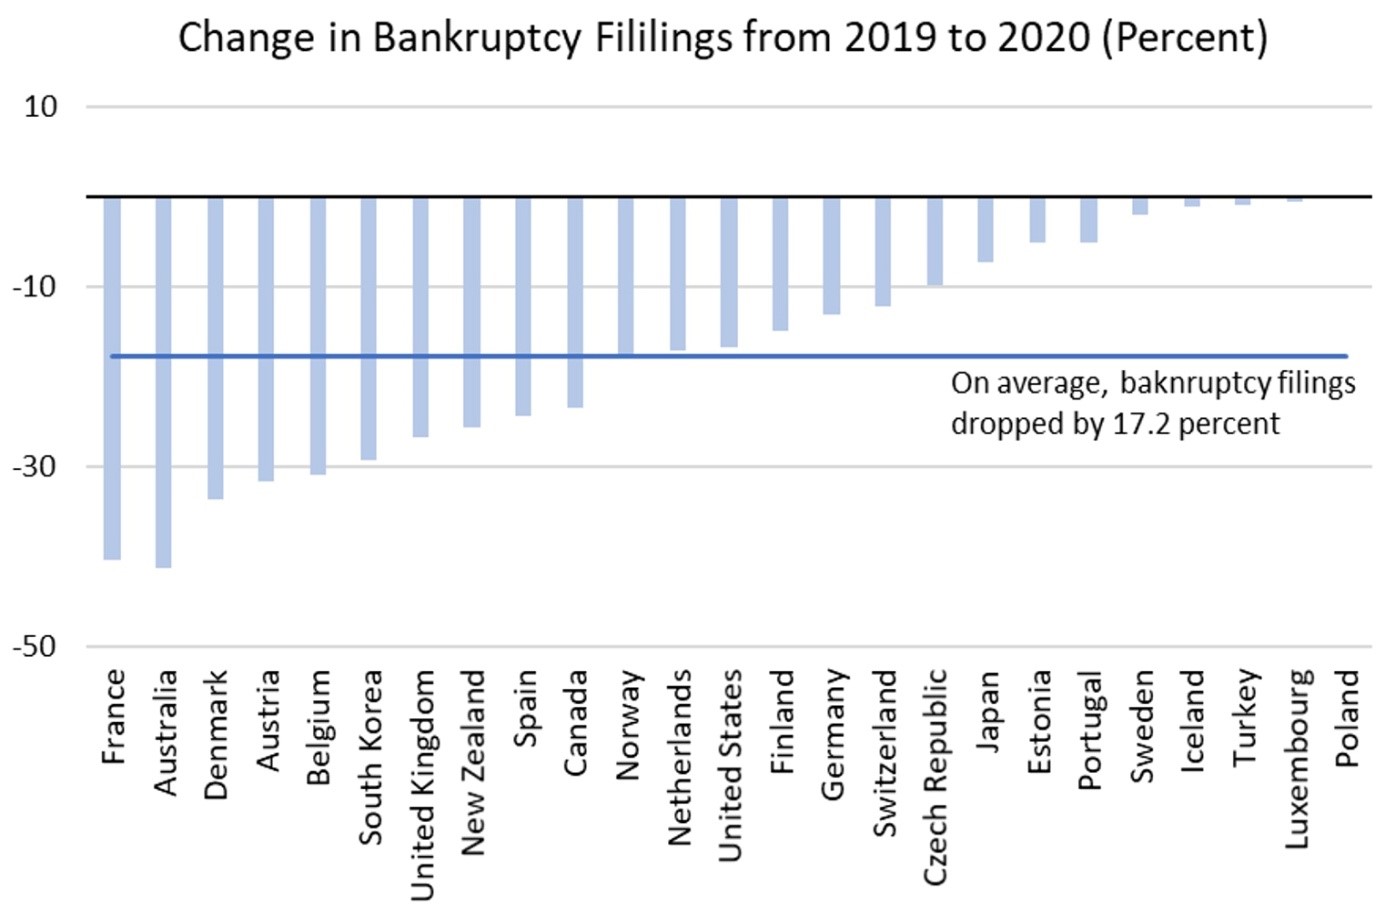
Note: The index is based on total number of bankruptcies in 25 advanced economies (Australia, Austria, Belgium, Canada, the Czech Republic, Denmark, Estonia, Finland, France, Germany, Iceland, Japan, Luxembourg, the Netherlands, New Zealand, Norway, Poland, Portugal, South Korea, Spain, Sweden, Switzerland, Turkey, the United Kingdom and the United States. For 12 economies (Australia, Belgium, Canada, Estonia, Finland, Germany, Iceland, Norway, Spain, Sweden, Turkey and the United Kingdom), the latest available data (most often to November 2020) are annualized to 2020 annual aggregates.
Source: Authors’ calculation using national data (accessed through Macrobond on 26 January 2021).
The reasons for this decline are twofold. The COVID-19 pandemic has induced governments in many advanced economies to finance job support programmes to assist workers and to temporarily halt bankruptcy procedures – providing lifelines to keep firms alive through the crisis, at a time when premature bankruptcy can worsen the recession. The job support programmes have been updated and expanded in most OECD countries, while the bankruptcy moratoriums are expiring soon in many countries. Australia, for example, returned to normal bankruptcy procedures on 1 January 2021 (Australian Financial Security Authority 2021).
For many employers and businesses, the government programmes have worked. Businesses have reacted by keeping employees on board or hiring new ones when restrictions on business operations became less onerous. In turn, the support keeps businesses open, in the hope that the economy turns around.
This availability of plentiful financial support to businesses cannot continue for long. A large number of firms will need debt restructuring once government support programmes run out and the courts open up. Extensive reorganisation or liquidation procedures, which may work in normal times, will prove insufficient to service a large wave of insolvencies. Changes to existing regimes should be done now, before the wave on bankruptcies comes. In March 2019 – a year before COVID started closing down businesses – the European Parliament adopted a new directive on preventive restructuring, aiming to increase the efficiency of insolvency proceedings (Becker 2019). The Reform Directive specifies that a new procedure must be in place in all EU member countries by 2022. The UK has done just that and thus provides an example for other governments to follow.
The UK has added three features to its bankruptcy law
The amendments to the UK insolvency law, adopted in June 2020, add three features (Balloch et al. 2020). First, these amendments introduce a two-month moratorium, during which the company benefits from a payment holiday from the majority of its debts. Second, the amendments allow the debtor to propose a rescue plan that can be forced onto every creditor if the majority of creditors agree. Third, suppliers are prevented from stopping deliveries once they find out that the debtor has trouble paying creditors, as long as the firm pays for its supplies on time – even ahead of bank creditors. Research on bankruptcy procedures around the world (Djankov et al. 2008) shows that the type of changes the UK has enacted increase the likelihood firms will survive, as they continue operating during their restructuring.
Some economists are concerned that keeping insolvent firms alive will drain resources from the healthy parts of the economy (Acharya 2020). These fears are fundamentally misguided. Policies to force businesses to shut down permanently risk slowing down the COVID recovery (Laeven et al 2020). As businesses shut down, they break a supply chain that affects other businesses, including in healthier sectors. Such breakage should be avoided as much as possible.
08 Febbraio 2021
Natalia Martín Fuentes, Isabella Moder
THE SCARRING EFFECTS OF COVID-19 ON THE GLOBAL ECONOMY
(synthesis; full article -05 February 2021 – : https://voxeu.org/article/scarring-effects-covid-19-global-economy)
Abstract: The COVID-19 pandemic is an unprecedented shock to the global economy and its potential scarring effects are thus difficult to predict. This column presents estimates of the long-term impact of past crises, suggesting that past epidemics and other exogenous shocks did not cause scarring effects, while the negative impact of financial crises on the long-term level of potential growth tends to be persistent. However, unlike previous exogenous shocks, the COVID-19 pandemic could affect the supply side of the economy through several channels and thus lead to a permanently lower level of potential output.
Keywords: COVID-19 pandemic, global economy, financial crisis, potential output levels, growth rates.
Motivated by the sluggish recovery after the global financial crisis, a recent literature has developed showing that recessions cause persistent or ‘scarring’ effects on the level of GDP. The reason behind this are cyclical shocks that affect the supply side of the economy through several channels, thereby shaping the long-term trend (Cerra et al. 2020). As the COVID-19 pandemic constitutes an unprecedented shock to the global economy, its potential scarring effects are difficult to predict. Assessing the scarring effects of past crises might however provide some indication as to how the COVID-19 shock could affect potential output (Martín Fuentes and Moder 2021).
A local projections analysis of past epidemics suggests that their initial impact on the level of potential output is relatively short-lived, tending to dissipate two years after the end of the epidemic (see Figure 1, upper-left panel). However, it should be noted that the past epidemics considered in the analysis were – with the exception of the swine flu – mostly localised events which are not comparable to a major global pandemic (see also Jordà et al. 2020, who find significant long-lasting macroeconomic consequences from 15 major pandemics since the 14th century). We hence additionally consider the impact of two other exogenous crises on potential output: the 1973-74 oil embargo imposed by the Organization of the Petroleum Exporting Countries (OPEC), which can be regarded as an exogenous negative supply shock for the affected countries, and major wars. Our results suggest that the oil embargo only had a negative effect on potential output in the first year after the shock (upper-right panel). Similarly, the results for major wars (lower left panel) suggest that following a severe initial impact, post-war economic recoveries tend to be steep and with no significant longer-lasting scarring effects (i.e. beyond four years).
Figure 1 Scarring effects of past epidemics and other crises on potential output levels
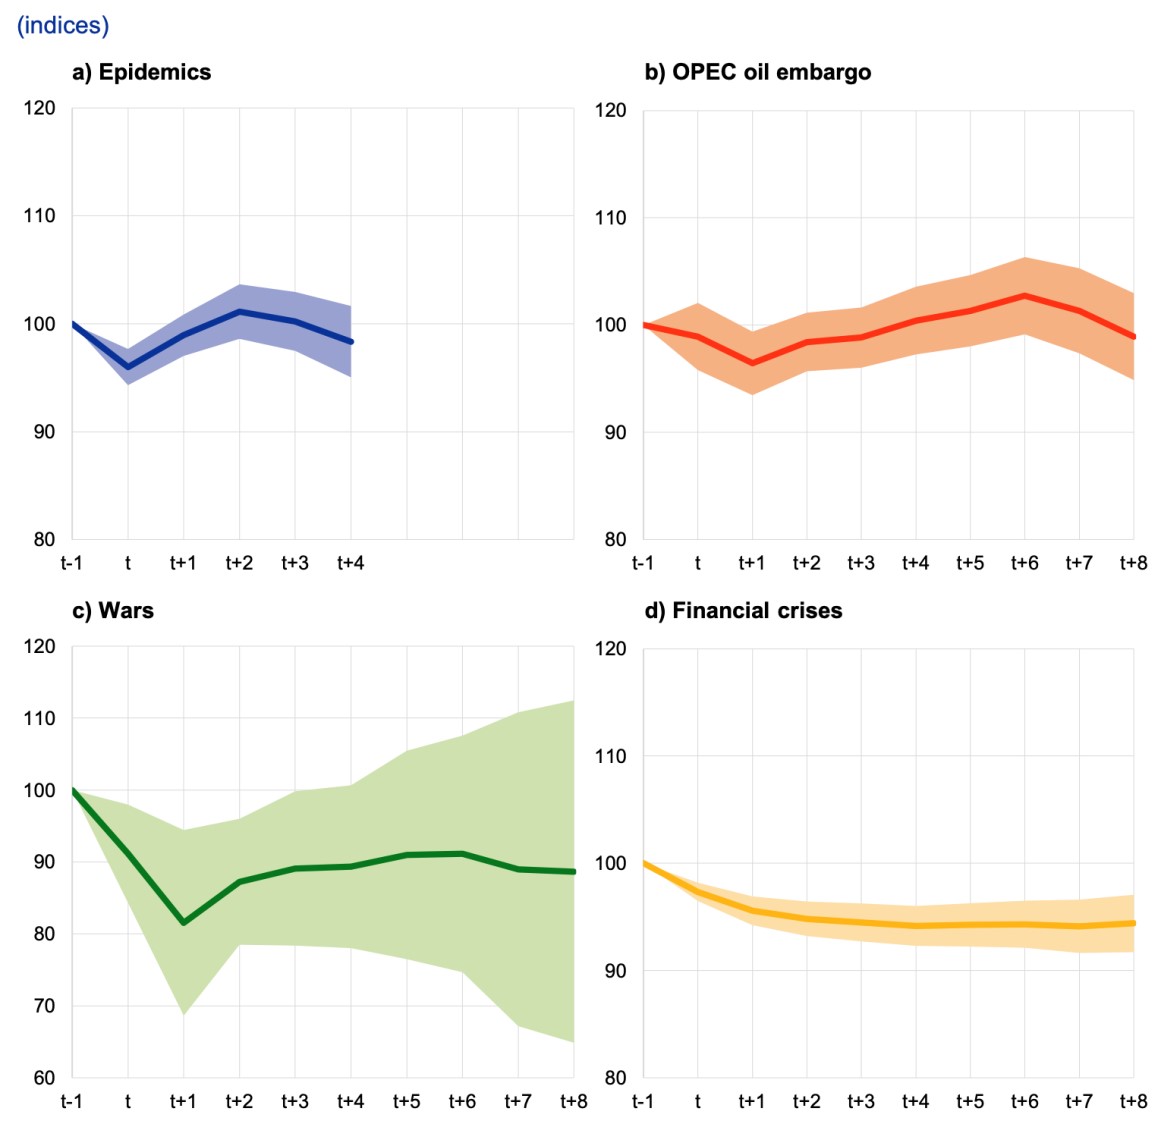
Sources: ECB staff calculations based on Feenstra et al. (2015) and Laeven and Valencia (2018).
Note: The continuous lines indicate the impact of the respective event in year t on the level of potential output up to the period t+8, i.e. eight years after the end of the event, and the shaded areas depict the 95% confidence interval. The impact on potential output is estimated with a local projections approach, based on a global panel that includes all events simultaneously, four lags of potential output growth to control for endogeneity, and country-fixed effects. As most of the epidemics considered in the analysis are relatively recent, the sample only allows their impact to be calculated until four years after the end of the epidemic. Potential output is defined as the level of output that is consistent with the productive capacity of an economy.
In contrast, financial crises are associated with a significant and very persistent downward shift in potential output. The results for past financial crises (as examples of endogenous crises, i.e. those triggered by the accumulation of economic imbalances) suggest a loss of around 5% even after eight years, in line with the recent literature discussed above. This is supported by the fact that, for recessions caused by financial crises, no overshooting in growth rates can be observed after the end of the recession, pointing to long-lasting scarring effects on the level of potential output (see Figure 2). This is different from the exogenous crises (i.e. epidemics, the OPEC embargo and wars), where the initial contraction is followed by above-normal growth rates, bringing the economy’s potential output back to its long-term trend path.
Figure 2 Impact of past epidemics and other crises on potential output growth
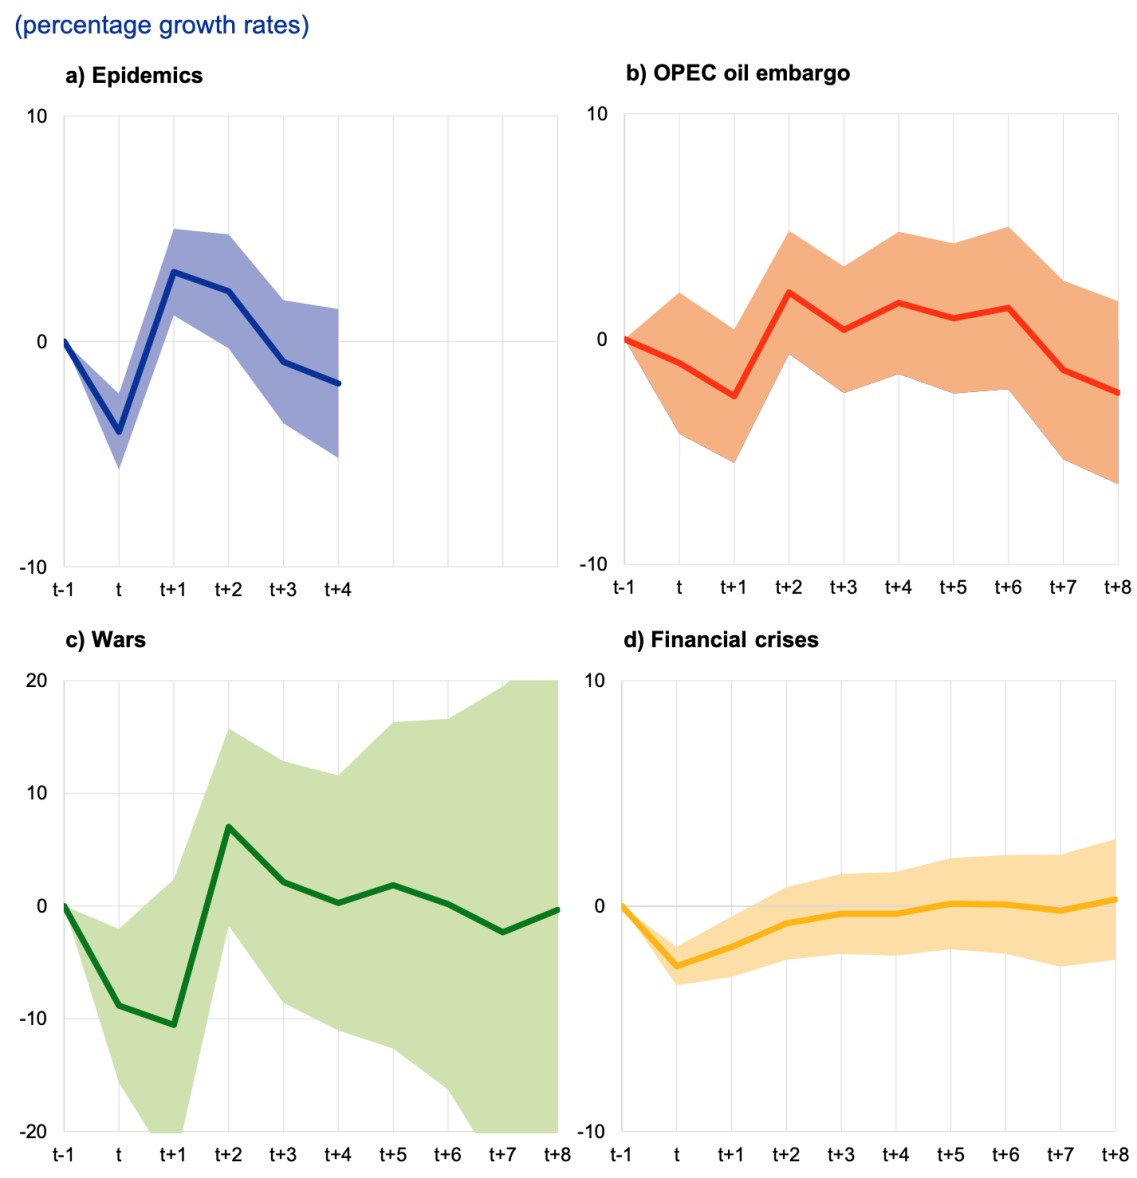
Sources: ECB staff calculations based on Feenstra et al. (2015) and Laeven and Valencia (2018).
Note: The continuous lines indicate the impact of the respective event in year t on the growth rate of potential output up to the period t+8, i.e. eight years after the end of the event, and the shaded areas depict the 95% confidence interval. The impact on potential output is estimated with a local projections approach, based on a global panel that includes all events simultaneously, four lags of potential output growth to control for endogeneity, and country-fixed effects. As most of the epidemics considered in the analysis are relatively recent, the sample only allows their impact to be calculated until four years after the end of the epidemic. Potential output is defined as the level of output that is consistent with the productive capacity of an economy.
In order to gain more insights into how past financial crises left scarring effects on potential output, the local projections approach is applied to the individual components of potential output.7 Our results indicate that all three supply-side components of the production function are initially affected by a financial crisis (see Figure 3). While the negative impact on total factor productivity and labour input starts to subside after approximately three years, there are adverse and persistent effects on the capital stock, which is the main source of the long-term scarring effects of financial crises.
The jury is still out on whether the long-term impact of COVID-19 will resemble more those of the epidemics and other exogenous shocks examined above (i.e. no scarring effects) or those of financial crises (i.e. persistent scarring effects). Looking at the individual components of potential output, COVID-19 could negatively affect the capital stock similarly to past financial crises. Capital depreciation is likely to have increased as a result of COVID-19, especially in capital-intensive sectors hit by the crisis such as the airline industry, where parts of the capital stock could become obsolete, as well as in other sectors that are struggling as a result of the demand shock. Furthermore, post-crisis public finance consolidation needs combined with difficult economic prospects for companies may contribute to a period of protracted under-investment.
Figure 3 Impact of financial crises on supply-side components of potential output
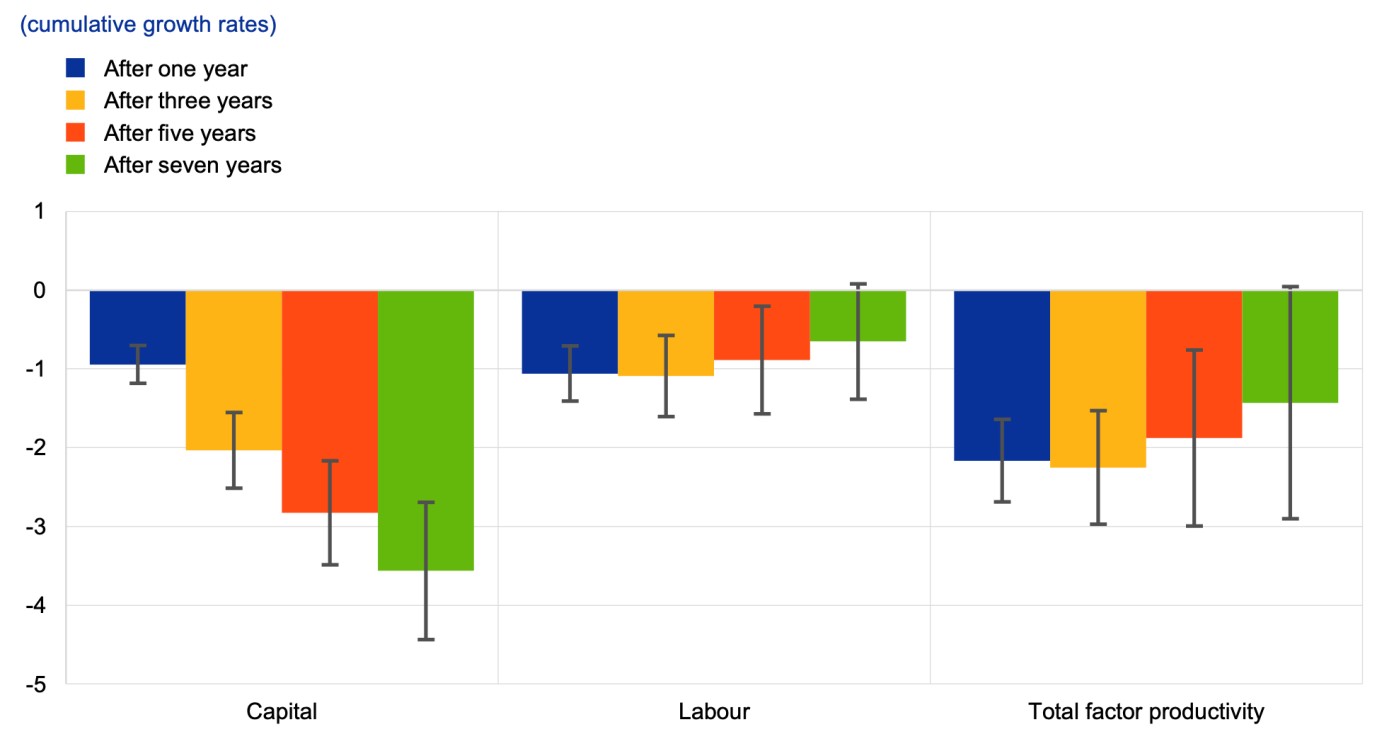
Sources: ECB staff calculations based on Feenstra et al. (2015) and Laeven and Valencia (2018).
Notes: The bars indicate the impact of financial crises on the respective supply-side components after the number of years shown since the end of the crisis. The error bars represent a 95% confidence interval. The impact on potential output is estimated using a local projections approach, based on a global panel that includes all events simultaneously, four lags of potential output growth to control for endogeneity, and country-fixed effects. Potential output is defined as the level of output that is consistent with the productive capacity of an economy.
As the COVID-19 shock has above all hit labour-intensive sectors, the initial impact on labour supply could be stronger compared with past financial crises. With the exception of transport, the sectors most affected by the COVID-19 containment measures (i.e. retail trade, accommodation and food services, entertainment and recreation) tend to be more labour- rather than capital-intensive (see Figure 4). At the same time, even sectors not targeted by the lockdown measures may have been hit indirectly through reduced sales of intermediate goods to affected sectors (Laeven 2020). Whether those employment losses will become more permanent will depend on the speed of the reallocation of workers across sectors and firms. Pandemic-related labour market consequences, such as a reduction in the labour force due to an increase in the number of discouraged workers or more limited global migration flows to advanced economies, might lead to a sustained contraction in the labour force. This contraction, combined with the impact on the accumulation of human capital from widespread school closures, could exacerbate the loss in labour supply (Burgess and Sievertson 2020). At the same time, it should be recognised that the losses depend on the policy response and the success of labour market policies in mitigating these effects.
Figure 4 Sectoral losses as a result of the COVID-19 containment measures and capital/labour intensity ratio
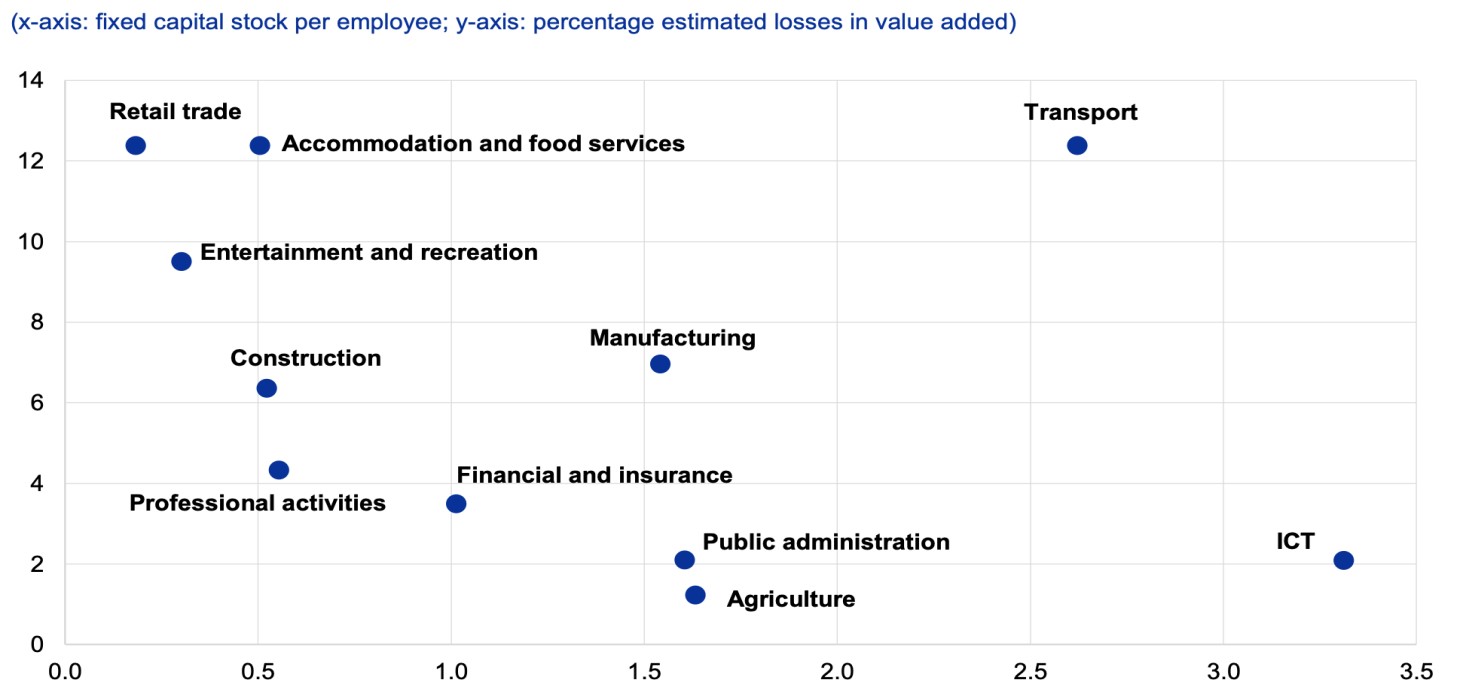
Sources: ECB staff calculations, Adarov and Stehrer (2019) and Stehrer et al. (2019).
Notes: Sectoral losses as a result of the COVID-19 lockdown measures are based on an ECB staff assessment for a sample of globally systemic countries and calculated as an unweighted average. The capital/labour intensity ratio is calculated as the fixed capital stock (in 2017) divided by the labour input (in number of employees in 2017) for each sector, based on the unweighted average of a sample of 19 countries.
The COVID-19 crisis could affect total factor productivity in several ways. First, the impact of COVID-19 could temporarily lock resources in unproductive sectors, and the reallocation of productive resources towards fast-growing industries is likely to take time. In addition, innovation could be impaired through lower spending on research and development, both in the public sector on account of consolidation needs and in the private sector owing to elevated uncertainty. Furthermore, reshoring of global value chains in the aftermath of the COVID-19 crisis could hamper innovation and knowledge spillovers across countries. At the same time, the increased use of digital technologies spurred by the COVID-19 crisis has the potential to accelerate the digital transformation of the global economy and therefore contribute positively to total factor productivity.
1 febbraio 2021
BALÁZS ÉGERT, YVAN GUILLEMETTE, FABRICE MURTIN, DAVID TURNER
Epidemiological and economic consequences of government responses to the COVID-19 pandemic
(synthesis; full article – VoxEu CEPR 02 January 2021 – : https://voxeu.org/article/epidemiological-and-economic-consequences-government-responses-covid-19)
Abstract: Policymakers have faced a crucial trade-off between curbing the spread of the Covid-19 pandemic and minimising further damage to economic activity. Employing reduced form econometric estimates of the Covid-19 pandemic, this column seeks to quantify the impact of government interventions on disease progression and mobility.It finds that a wide-ranging package of public health policies – including comprehensive testing, tracing and isolation, mask-wearing, and policies directed at vulnerable people in care homes – are crucial to avoid full lockdowns while also containing the spread of the virus. Such policies may, however, need to be complemented by selective containment measures such as restricting large public events and international travel or localised lockdowns.
Keywords
Covid-19 pandemic, epidemiological models, diseases dynamics, economic activity, government interventions, containment policies.
Since the onset of the Covid-19 pandemic, parameterised epidemiological models (‘SIR’ models, for Susceptible, Infected, and Recovered) have been a popular tool to analyse the diseases dynamics (Anderson et al. 2020, Atkeson et al. 2020). These models can be used to shed light on the impact of physical distancing and other public health measures in containing waves of infections (Aschwanden 2020, Ferguson et al. 2020, Davies et al. 2020). SIR models rely on several parameters (for instance, to quantify the impact of physical distancing on the reproduction rate of the virus, or R), so their insights are only as good as the accuracy of their parameters.
By contrast, our study (Égert et al. 2020) contributes to a burgeoning literature that seeks to quantify the impact of government interventions on disease progression and mobility, employing reduced-form econometric estimates for the Covid-19 pandemic. This literature has already shown that stricter lockdown policies go in tandem with a reduction in Covid-19-related deaths (Conyon et al. 2020). It has found strong evidence in favour of banning mass gatherings as one of the most effective ways of taming the spread of the virus (Ahammer et al. 2020). Similarly, air travel restrictions are found to be effective, especially those imposed on national and international flights and at the early stages of the pandemic (Hubert 2020, Xiong 2020). Stay-at-home requirements and workplace closures can also curb the propagation of the disease (Deb et al. 2020), as can the use of face masks (Chu et al. 2020, Betsch et al. 2020). Nevertheless, the recent empirical literature has said little about the importance of testing and contact tracing policies despite their prominence in SIR models (Aleta et al. 2020), and the protection of the elderly population.
In most OECD countries, a combination of public health and containment measures, often involving a shutdown of major parts of the economy, was successful in reducing the spread of the pandemic in the first half of 2020. Having lifted many restrictions, the dilemma many policymakers are now facing is how to deal with subsequent waves of infection without inflicting significant damage on economic activity as caused by the measures deployed in response to the first wave. Our study attempts to inform these decisions by examining country experiences at a daily frequency during the period from March to mid-August, with a focus on how the reproduction number, R, and the physical mobility of people (a proxy for economic activity) respond to policy measures. Indicators of containment policies from the Oxford Blavatnik School of Government are complemented with public health indicators assembled for the study.
Figure 1 shows that, based on estimation results from an econometric model with the log of R and mobility, the combined effect of applying all containment polices – including stay-at-home requirements, workplace and school closures, restricting public gatherings, and imposing limits to international travel – would nearly halve the reproduction number, from an initial R value of about 3.
Results further suggest that test and trace policies can reduce the spread of the virus. The most comprehensive form of such policies are more than two and a half times more effective in reducing R than more limited forms. Test and trace polices are most effective when the infection rate is not too high (which in estimation is taken to be less than ten new daily cases per million population – a rate which was well exceeded in many countries in March and April). This is a rather unsurprising finding given the difficulties of tracking down all contact persons in a timely manner if the system is overwhelmed with new cases. Overall, the most effective test and trace regime, in an environment of low daily infections, is estimated to be more effective than any other public health intervention and two to three times more effective than most individual containment measures. Policies aiming at shielding the elderly population can also play an important role, as the testing of residents and staff in long-term care facilities and general stay-at-home recommendations for the elderly are associated with fewer infections. The combined effect of these polices on reducing R is estimated to exceed the effect of most individual containment measures. Regarding masks, results show a sizeable and fairly robust negative effect on R from the introduction of mandatory mask wearing in all closed public spaces, although other results (not reported) suggest that extending mask wearing obligations to the outdoors does not appear to add much to reducing the reproduction rate.
The national and global daily death rates are used as proxies for the severity of the pandemic, which by itself could drive spontaneous changes in behaviour irrespective of policy measures. The national cumulative death rate is used to control for the possibility that built-up population immunity could lower R over time. Coefficient estimates on all three variables are statistically significant and their magnitudes imply that spontaneous changes in behaviour and immunity have played an important role in the evolution of R.
Figure 1The determinants of the log reproduction rate and physical mobility of people
Turning to the policy drivers of mobility, empirical results suggest that seven of the eight categories of containment policies have a negative effect on mobility. There is a clear ranking of coefficients, so that the more stringent application of a particular policy tends to reduce mobility to a greater extent. For example, the most severe form of workplace closure (a score of three) has nine times the effect on mobility as that of the mildest form (a score of one). These findings suggest that moving to the more stringent forms of workplace closure, stay-at-home requirements, and school closure has large negative effects on mobility and hence economic activity, although it is difficult to detect any corresponding benefit from further reductions in R. In contrast, for policies such as the cancellation of public events and travel restrictions, the most limited application of the policy has no significant effect on mobility. Applying all containment policies in their most severe forms would reduce mobility by more than half relative to normal, with 50% of this reduction accounted for by workplace closures and stay-at-home requirements. Alternative estimations, not reported here, explored the effect of mask-wearing on mobility. The estimated positive coefficient estimates suggest that mandating mask wearing in public transports and shops raises mobility, possibly by reducing concerns about infection. The national daily death rate from the virus is again included to proxy general awareness of the virus and its effect in voluntarily reducing mobility due to an increase in natural caution. A national daily death rate running at around 15 per million – similar to the rate experienced by some of the major OECD countries going into the lockdown in March – is estimated to reduce mobility by 10%, independently of any government-mandated polices.
These estimates are consistent with much of the above literature. Containment policies can successfully reduce the spread of the virus, but most have a substantial impact on mobility and, by implication, economic activity; in particular stay-at-home requirements, workplace closures, and school closures. Most importantly, unlike earlier empirical studies, the results strongly support the view that testing, combined with effective contact tracing are key components of the post-lockdown strategy, especially at relatively low level of infections (OECD 2020). This corroborates a recent outbreak modelling study (Hellewell et al. 2020), which found that contact tracing and isolation would only contain outbreaks of Covid-19 if very high levels of contact tracing were achieved. This is also consistent with the view that testing and tracing is most effective in a low-infection environment, because contact tracing becomes increasingly difficult with higher levels of new daily infections (Hellewell et al. 2020). Furthermore, estimation results suggest that mask-wearing and the protection of the elderly population in general and those in care homes in particular might play an important role in combating the virus.
25 gennaio 2021
MICHELE LIMOSANI
L’altra pandemia Il ritorno dello Yeti e la questione riforme (seconda parte)
(synthesis; full article – Tempostretto 17 January 2021 – : https://www.tempostretto.it/news/limosani-laltra-pandemia-il-ritorno-dello-yeti-e-la-questione-riforme-seconda-parte.html )
Abstract: la seconda parte dell’analisi della crisi economica in corso, la più grave da quella del 1929, e sulle conseguenze del Covid-19 sul fronte economico e occupazionale. La crisi mette in evidenza la necessità d introdurre alcune riforme e, in particolare, quelle della pubblica amministrazione, della giustizia e dei rapporti Stato-Regioni. Queste riforme sono necessarie e vanno affrontate con decisione, per cui il ruolo dello Stato in alcuni casi diventa essenziale ed insostituibile come nel caso dei “Beni Pubblici” (salute, difesa, legalità, istruzione), situazione nella quale il libero mercato è incapace di assicurare una distribuzione giusta e ottimale delle risorse.
Keywords
Pandemia, crisi economica, politica delle riforme, ruolo dello Stato, economia di mercato
La crisi economica ha riportato al centro del dibattito politico due questioni di carattere istituzionali: il ruolo dello Stato in un’economia di mercato e le politiche delle riforme. Riguardo al primo tema ritengo che “Il buon funzionamento del mercato dipenda dal buon funzionamento dello Stato e che le due istituzioni non sono tra loro alternative ma reciprocamente dipendenti”. Ed il ruolo dello Stato in alcuni casi diventa essenziale ed insostituibile come nel caso dei “Beni Pubblici” (salute, difesa, legalità, istruzione), situazione nella quale il libero mercato è incapace di assicurare una distribuzione giusta e ottimale delle risorse. La vera questione è la ricerca di un nuovo punto di equilibrio per evitare di “buttare l’acqua con tutto il bambino”. Lasciamo fare al mercato tutto ciò che esso può fare bene resistendo (Alitalia, ILVA docet) al ritorno incondizionato di un vecchio e inefficiente statalismo, il ritorno dello Yeti.
La necessità delle riforme
Durante la crisi ci siamo resi conto, altresì, della necessità di introdurre alcune riforme e, in particolare, quelle della pubblica amministrazione, della giustizia e dei rapporti Stato-Regioni. Queste riforme sono necessarie e vanno affrontate con decisione. Ma è quello della crisi il momento opportuno per intervenire e proporre quelle riforme tanto attese e a vantaggio di tutti, necessarie per far compiere un salto di qualità al paese e per fare ripartire la crescita? Su questo tema gli studiosi sono divisi ma il tema è troppo importante per essere eluso ancora una volta dalla classe politica.
La crisi come opportunità o rischio; gli effetti sul sistema produttivo e sul mercato del lavoro.
Alla luce dei bilanci, delle condizioni patrimoniali di partenza e dei livelli di indebitamento raggiunti, molte piccole e medie imprese, soprattutto nel mezzogiorno, hanno una probabilità di default elevata. Ciò che più preoccupa, quindi, è la pesante perdita di potenziale produttivo che ci aspetta dopo il Covid e l’impatto che ciò produrrà sul mercato del lavoro e poi sulle condizioni finanziarie del sistema bancario.
Chi fa boom e chi “scoppia”
Certo, va rilevato che la crisi ha prodotto effetti positivi su molti settori produttivi determinando una significativa redistribuzione di ricchezza all’interno del mondo delle imprese. I settori agroalimentare, elettronica, logistica, informatica, grande distribuzione, hanno infatti registrato un boom di fatturato durante il periodo covid. Alcune imprese, quindi, spariranno, altre si rafforzeranno; nuove imprese emergeranno e con esse nuove opportunità di lavoro. Ma nel caso di serie difficoltà di sopravvivenza delle imprese medio-grandi, lo Stato sarà chiamato ad intervenire? E quali imprese salvare e quali lasciare andare? Quali criteri seguire? Quali le modalità di intervento?
Chi ha pagato la crisi
Rimane, infine, sullo sfondo il tema degli effetti distributivi sui redditi delle famiglie generati dalla crisi. Chi ha pagato di più, tra le famiglie italiane, il prezzo della crisi? -vedi il tema garantiti vs non garantiti– E’ opportuno intervenire sulla nuova distribuzione dei redditi? E quali politiche attuare per limitare e ridurre gli effetti redistributivi? Sono questioni complesse ma nello stesso tempo fondamentali per lo sviluppo futuro del paese e richiedono pertanto serie ed equilibrate riflessioni.
La scommessa sul futuro: Il Piano di resilienza e di ripresa
L’ultimo intervento economico nel nostro paese paragonabile -per dimensione di risorse finanziarie mobilitate- a quello previsto dal Next Generation Plan europeo è stato il Piano Marshall, piano voluto dagli americani per favorire la ricostruzione dei paesi europei distrutti dalla guerra. Non possiamo perdere o arrivare in ritardo a questo appuntamento. Ora, è quasi scontato che la sostenibilità del debito pubblico in un certo paese sarà giudicata dai mercati finanziari sulla base dei tassi di crescita dell’economia, e quindi di come verranno spese le risorse del Next Generation Plan; i tassi di interesse, infatti, rimarranno molto bassi per ancora un pó di tempo. Se dunque le risorse del Piano saranno sprecate il debito pubblico alla fine potrebbe diventare insostenibile.
I progetti da scegliere
Nei paesi con un elevato debito pubblico, inoltre, il governo nazionale dovrà fare una valutazione ancora più attenta e rigorosa dei progetti da finanziare. I progetti, certo, potranno essere sia di natura prettamente economica che sociale e non tutti produrranno effetti nel breve periodo perché, come è noto, la ricerca scientifica e l’innovazione tecnologica hanno rendimenti differiti nel tempo. Ma è sull’impatto che ogni progetto produrrà sulle nuove opportunità di lavoro che si gioca la grande sfida. Non è questo il momento per pensare a sostegni e sussidi.
Tante quindi sono le questioni economiche che nel futuro dovranno essere studiate ed approfondite per lasciare alle future generazioni un patrimonio di idee, di conoscenze e di riflessioni su un evento che ha segnato profondamente il nostro tempo e le cui conseguenze sono, ancora per molti versi, inesplorate.
20 gennaio 2021
MICHELE LIMOSANI
L’altra pandemia. Gli effetti economici del Covid 19 (prima parte)
(synthesis; full article – Tempostretto 16 January 2021 – : https://www.tempostretto.it/news/limosani-laltra-pandemia-gli-effetti-economici-del-covid-19-prima-parte.html)
Abstract: Una analisi approfondita della crisi economica in corso, la più grave da quella del 1929, evidenzia gli scenari che abbiamo davanti in questo momento cruciale per l’economia mondiale, e gli effetti che il Covid-19 produrrà sul sistema economico e sociale del nostro paese.
Keywords
Covid-19 pandemic, economic activity, global crisis, global action, containment policies.
Un esame esaustivo degli effetti che la pandemia produrrà sul sistema economico e sociale del nostro paese è difficile da compiere; anche per il semplice motivo che la crisi è in corso d’opera e solo il tempo potrà restituirci un quadro completo della situazione. Dal punto di vista di chi studia i temi della Politica Economica, tuttavia, è possibile avanzare alcune brevi -anche se parziali- riflessioni su quelli che sono le questioni fondamentali che questo tempo pone alla nostra attenzione e che meritano analisi rigorose ed approfondite.
Un evento epocale
Questa crisi sarà studiata dalle future generazioni. E’ la più grave crisi dopo quella del 1929 e la fila di persone in cerca di cibo registrata nelle scorse settimane a Milano, e ripresa da tutti i media e le tv nazionali, ha richiamato alla nostra mente proprio le immagini degli anni ‘30 a New York. Questa crisi racchiude in sé contemporaneamente le cause delle tre precedenti recessioni: crisi da domanda (come appunto quella degli anni trenta), crisi da offerta (blocco delle attività produttive) come quella degli anni settanta caratterizzati dalla esplosione dei prezzi del petrolio), crisi finanziaria (come quella del biennio 2008-2009) di cui si colgono i primi segnali sui mercati finanziari e sulle oscillazioni dei titoli quotati in borsa, ma che non ha ancora dispiegato tutti i suoi effetti. Mario Draghi è intervenuto nei giorni scorsi anticipando che il peggio non è ancora passato e che le banche possono finire sotto tensione per via dei potenziali crediti che andranno in sofferenza.
Crisi extra economica
È, inoltre, una crisi diversa dalle altre perché ad originarla non sono fattori economici e sociali ma una causa extra economica (sanitaria). Ciò genera, a sua volta, una profonda incertezza sui relativi tempi di uscita. Nonostante gli effetti annunciati dovuti all’erogazione del vaccino, il Governatore della Banca D’Italia ha di recente affermato che dovremo aspettare la fine del 2023 per veder ritornare il livello del PIL a livelli pre-covid.
Crisi globale risposta globale
Il riduzionismo non funziona; questioni globali necessitano di risposte globali. Il virus, lo abbiamo visto, non ha conosciuto confini e, atteso l’elevato grado di integrazione e di interdipendenza tra i diversi paesi, la crisi economica è diventata mondiale. Uno stato di crisi globale necessita risposte di politica economica coordinate a livello internazionale; in primo luogo tra quei paesi (Stati Uniti, Cina ed Europa) che insieme determinano l’80% circa della produzione mondiale, e poi, per quanto riguarda il nostro paese, a livello europeo.
Certo, ricorderete tutti, dopo una non brillante partenza con le affermazioni della Lagarde, l’Europa ha recuperato ed è stata all’altezza del compito ad essa affidata; difendere l’euro e l’economia degli stati europei. La Banca Centrale ha lanciato un piano di acquisto rinforzato per oltre 1100 miliardi di titoli del debito pubblico sui mercati finanziari secondari. La commissione ha varato diversi strumenti di prestito a tassi bassissimi per coprire spese sanitaria, cassa integrazione, prestato garanzia al sistema bancario per prestiti alle imprese, eliminato il vincolo del patto di stabilità.
Operazioni colossali
L’Italia da sola, con la sua moneta, non sarebbe stata in grado di difendere il paese. Le operazioni colossali di creazione di denaro da parte delle banche centrali sono sostenibili senza il collasso del tasso di cambio, fughe di capitali, ed impennate dei tassi (come è successo recentemente in Argentina) solo con una Banca Centrale in grado di emettere una moneta considerata dai mercati come riserva globale.
Verso il Green New Deal
La crisi economica e sanitaria quindi -e questo è il punto centrale- segna un’accelerazione nel processo di costruzione e di completamento dell’Unione Monetaria Europea (Riforma Fiscale) e sulla necessità di condividere un rinnovato paradigma economico e sociale (Green New Deal), rafforzare i sistemi democratici e selezionare una nuova leadership europea in grado di governare questo processo.
18 gennaio 2021
ETHAN ILZETZKI
Post-Covid-19 potential output in the euro area
(synthesis; full article – VoxEu CEPR 02 January 2021 – : https://voxeu.org/article/post-covid-19-potential-output-euro-area)
Abstract: Global economic activity took a large hit during the Covid-19 pandemic, and the euro area was no exception. This column reveals how the majority of the CfM-CEPR panel of macroeconomic experts on the European economy predict a 2-5% decline in the level of potential euro area GDP, but no impact on the potential long-run growth rate.
Keywords
Covid-19 pandemic, Global economic activity, euro area, economy’s productive capacity.
Global economic activity took a large hit during the Covid-19 pandemic. The euro area is no exception, with the ECB currently projecting an 8% decline in GDP this year and that GDP will only recover to its pre-pandemic level at the end of 2021. But looking five years ahead, the ECB has made no change to its long-run growth forecast (of 1.4% in five years’ time) throughout the pandemic. This particular forecast suggests a permanent loss in the level of GDP, but no effect on its growth in the long run. Yet, the long-run effect of Covid-19 on the euro area’s economic potential remains very uncertain.
Bodnár et al. (2020) give an overview on the theory and evidence on the effects of Covid-19 on the euro area’s potential output (defined as the maximal level of economic activity that an economy can sustain at current technology, labour supply, and capital stock, without leading to inflationary pressures). There are several reasons to think that Covid-19 may have persistent effects.
First, supply chain disruptions can cause a decline in the economy’s productive capacity, but how persistent these are is still uncertain. Vinci and Licandro (2020) point out the role of monetary policy interventions in preventing the destruction of productive capacities following large negative shocks. Second, it may take time for new entrants to replace firms that failed due to Covid-19. Third, unemployment tends to be persistent as workers’ skills deteriorate and their attachment to the labour force may weaken. Fatás and Summers (2017) give evidence of hysteresis effects of this sort.
Fourth, corporate debt overhang may create ‘zombie firms’, which have lesser incentives to invest in productive capital. However, Jordá et al. (2020) find no historical support for post-crisis growth depending on corporate debt levels. Fifth, there is some theoretical support for the notion that low demand may have scarring effects on the economy due to underinvestment in capital or innovation, whether the recession originated from the demand or supply side (Benigno and Fornaro 2018, Fornaro and Wolf 2020, Benedetti-Fasil et al. 2020). Finally, pessimistic forecasts of long-run growth can be self-fulfilling because policymakers are more likely to enact fiscal consolidation if they foresee a permanent loss in output. This, in turn, could secure the drop in GDP due to lower demand (Heimberger 2020).
There are also reasons why Covid-19 may increase the economy’s long-run growth potential. It may have accelerated the implementation of new technologies. Further, it has led to improvements in health investments, and could continue to do so.
…
The December 2020 CfM-CEPR survey asked members of its European panel to estimate the loss in the level and growth rate of potential GDP in the euro area due to the Covid-19 pandemic.
Question 1: How much lower will the potential level of GDP in the euro area in 2025 be due to Covid-19 relative to pre-Covid forecasts?
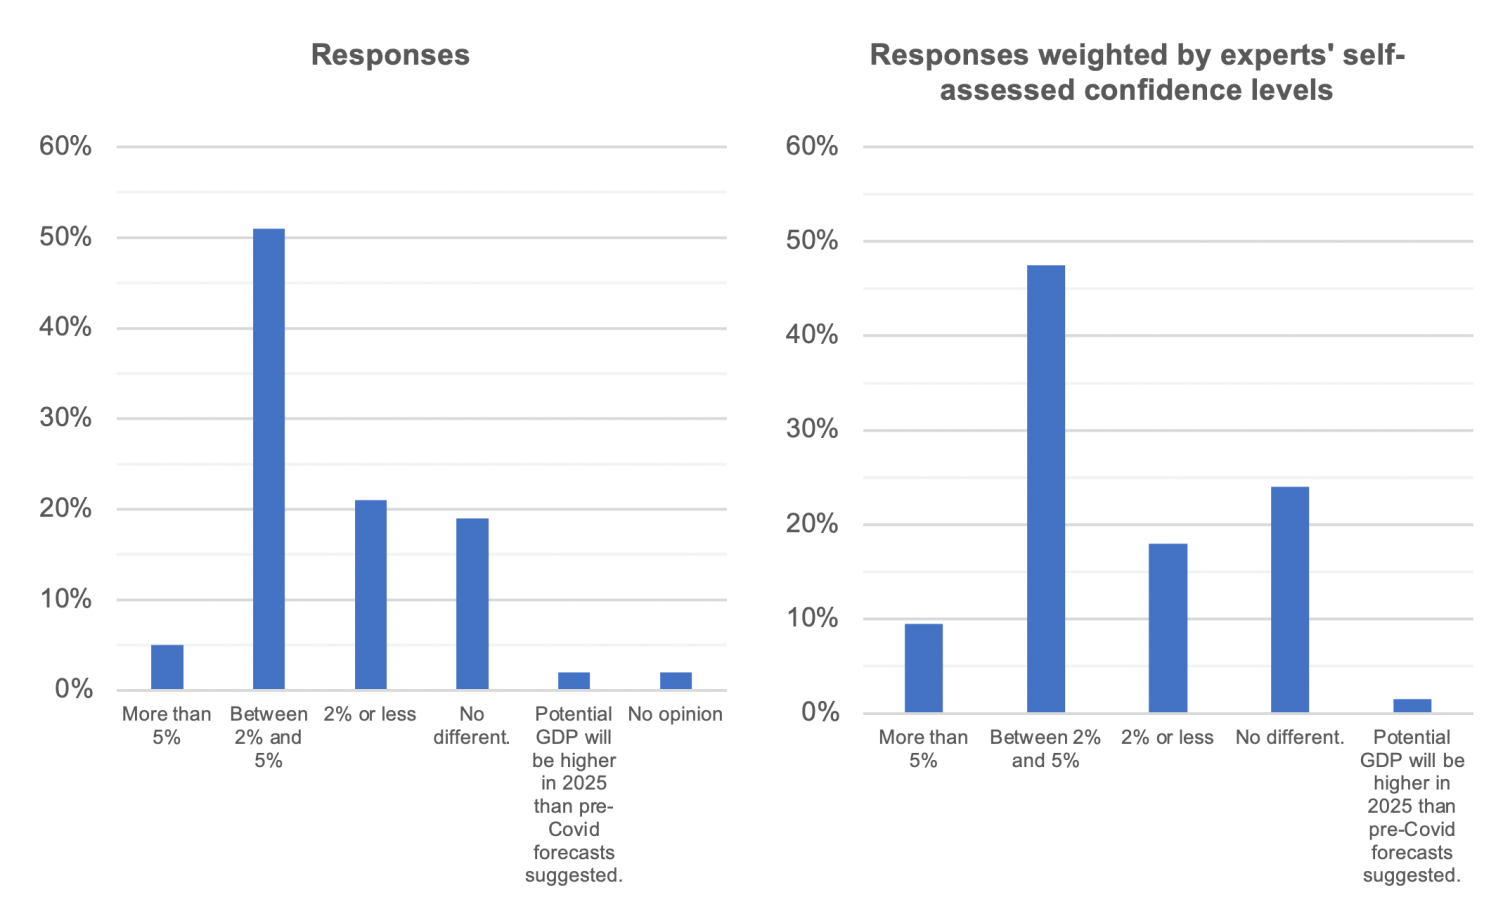
Forty-three panellists responded to this question. A majority (51%) of the panel predicts that the level of potential GDP will be 2-5% lower in 2025 than it would have otherwise been absent Covid-19. In other words, they predict a permanent loss in income due to Covid. However, nearly 40% of the panel predicted a small or negligible cost in terms of the level of GDP, with 21% predicting that potential GDP will decline by 2% or less, and 19% that it will not decline at all.
The more pessimistic responses note that GDP losses in deep recessions tend to be permanent. Roger Farmer (University of Warwick) points out that “[a]fter a major shock, and COVID certainly qualifies as major, there is little or no tendency to return to a give[n] path.” Several participants pointed to factors that were unique to Covid-19 and may have a longer-term effect. David Miles (Imperial College) referred to the “[e]ducation disruption and failure of firms allied with a sharp rise in unemployment” as factors affecting the economy in the long run. Francesco Lippi (LUISS) highlights other scarring factors including “higher public and private debts [and] more unemployment.” Other respondents voiced concern that political and social factors may further hamper the recovery. Etienne Wasmer (Sciences Po) argues that “[t]his is a break in the trend, and Europe has traditionally be[en] slow to adjust to a new organization, it will indeed take 5 to 10 years to adjust.” Ramon Marimon (European University Institute and UPF-Barcelona GSE) points directly to EU politics: “The main problem is not the potential level in the euro area in 2025, but how the euro area divide, which already increased after the financial-euro crisis, will be in 2025?”
The optimists noted that Covid-19 may also be viewed as a creative destruction shock. Francesco Lippi, while noting the risks of scarring effects above, believes potential GDP could be higher because “[t]he shock pushed many firms to adopt new technologies that may be cost effective in the medium run and increase potential output and welfare.” Robert Kollmann (Université Libre de Bruxelles), while predicting a minor loss to long run GDP, adds that “households and firms have been forced by the Covid crisis to upgrade their IT skills and equipment, and new ways of organizing office work, production and distribution have been invented. In addition, the crisis could accelerate the transition to greener technologies.” Others credit good macroeconomic policy to their rosier forecasts. John Hassler (IIES, Stockholm University) predicts that “[m]ost likely, the fundamental cause of the crisis will vanish this year. Due to very forceful policies, the initial shock did not lead to self-reinforcing feedbacks – a quite possible scenario with a financial crisis leading to perhaps even a depression was avoided.” However, Thorsten Beck (Cass Business School) warns that the outcome depends on future policies as well: “The impact of COVID-19 on potential GDP will depend a lot on policy responses. So far, these policy responses have been appropriate, trying to minimise negative effects. But political doubts remain whether they can be continued long enough to avoid damage.”
Finally, several panel members argued that the euro area should not be viewed as a single economy and that there will be large differences across countries in the pace of recovery. Jagjit Chadha (National Institute of Economic and Social Research), for example, points to “considerable heterogeneity across EA countries because of their respective reliance on socially intensive activities, the scope for available fiscal responses and the effectiveness of the health and social care infrastructure.”
Question 2: How much lower will the potential growth rate of GDP in the euro area in 2025 be due to Covid-19 relative to pre-Covid forecasts?
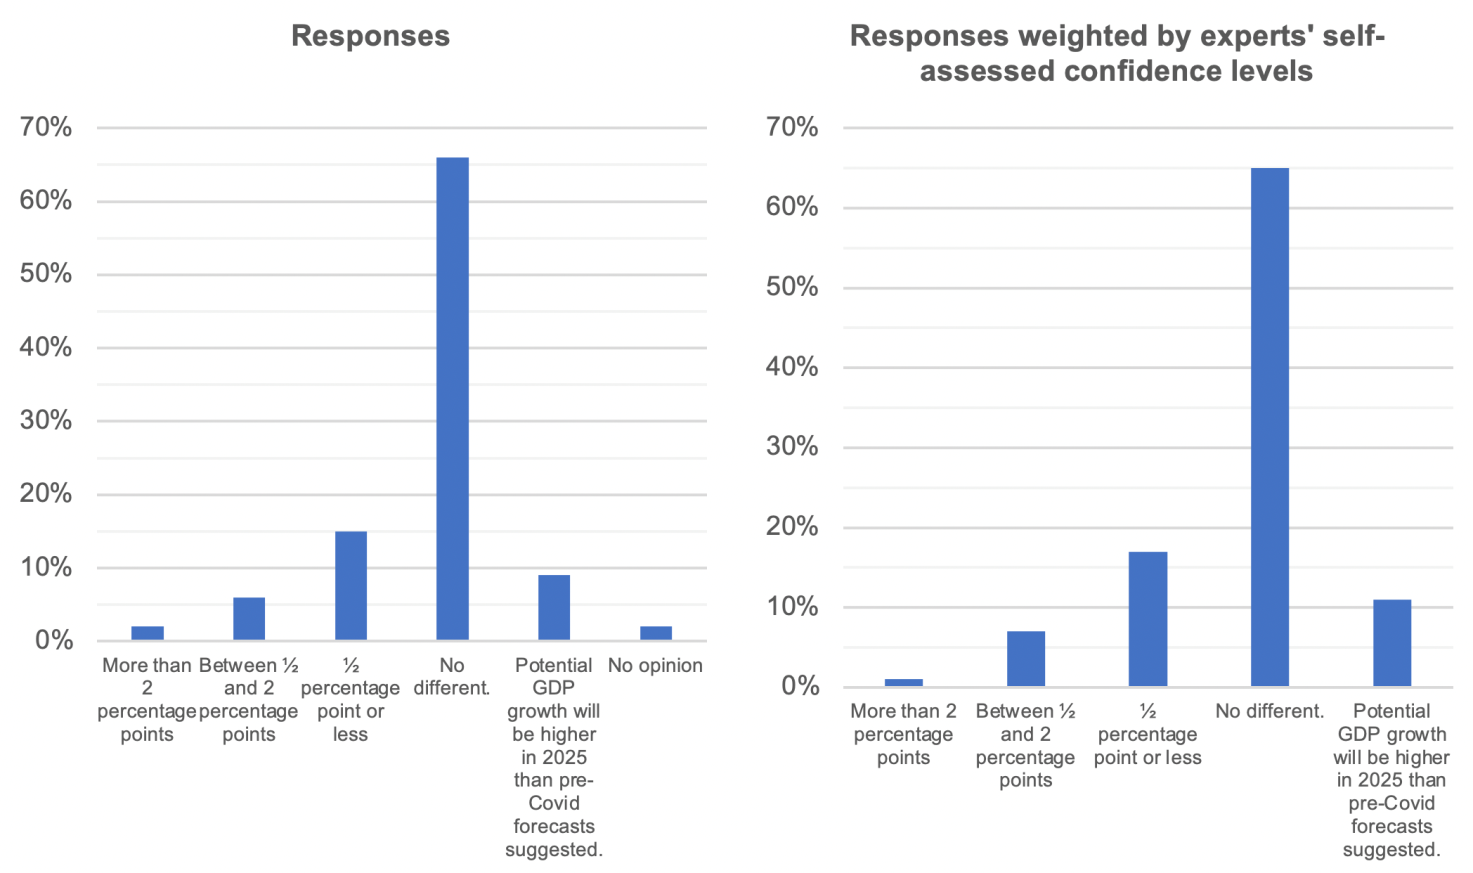
Forty-seven members of the panel responded to this question. The vast majority (81%) predicted that the euro area’s potential growth rate will be unaffected by Covid-19 or forecasted small losses of half a percentage point or less.
Some panellists based their responses on past recessions. Jumana Saleheen (CRU Group) reminds us that “[i]n previous crisis we have seen an impact on the level of potential GDP but not on its growth.” Other panellists argued that none of the long-run drivers of economic growth have been adversely affected. As Jordi Galí (CREI, Universitat Pompeu Fabra and Barcelona GSE) puts it, “I do not see any reason to believe the forces behind innovation and, hence, potential growth, will be much different after the pandemic, one way or another.” John Hassler adds: “It is hard to see that the fundamental causes of growth, namely the creation of new ideas and the ability to adopt and exploit these for commercial and social use, are affected in the long-run by the corona crisis.”
A couple of participants were even more optimistic. Fabrizio Coricelli (Paris School of Economics) argues that Covid-19 will end up being good for economic growth: “Covid-19 may induce much needed infrastructural public investments, speed up productivity-enhancing technological innovation, also driven by environmental concerns.” Maria Demertzis (Bruegel) adds: “There are important reasons to [feel] that new technology adaption has been accelerated as a result of Covid-19.”
However, several participants warned that these optimistic forecasts depend on the policy response. Etienne Wasmer conditions that “if we are in the middle of [a] public finance crisis, it will be a -2 to -3% [hit to GDP growth], but [it’s] hard to tell whether this is in 2025, 2024 or 2023.”
21 dicembre 2020
BARBARA BAARSMA, ELINE VAN DEN BROEK-ALTENBURG, ROBIN FRANSMAN, BAS JACOBS, CARL KOOPMANS, COEN TEULINGS
Is the current COVID-19 strategy effective?
(synthesis; full article -04 December 2020 – : https://voxeu.org/article/current-covid-19-strategy-effective)
Abstract: The aim of the Dutch government’s current policy to combat COVID-19, as in many other countries, is to reduce the number of infections as much as possible. This column argues that recent data show that societies can handle a much larger number of infections during this second wave without excessive social costs, and that the Dutch policy should therefore move away from almost eliminating infections towards creating herd immunity by letting the COVID-19-virus circulate more freely among the non-vulnerable groups, while strictly protecting the vulnerable groups.
Keywords: COVID-19 pandemic, number of infections, virus circulation, vulnerable groups
The current policy to combat COVID-19 in the Netherlands aims at reducing the number of infections as much as possible, like in many other OECD countries. The government states as its objective to reduce the number of infected persons from its peak of 10,000 per day around 25 October beyond the current 5,000 per day to much lower numbers. In this column, we question the wisdom of this policy.
When the first wave of COVID-19 hit, policymakers all over the world had to take far-reaching decisions based on limited information, mainly from China. Across the EU, countries have been quite effective in simultaneously containing the spread of the virus with lockdowns, while providing liquidity support to firms and social assistance to workers that were hit hardest by these lockdowns. Since we are now in the middle of the second wave, we have to consider the best way to move forward from our current state, which is entirely different than in East Asia.1
There are essentially three strategies in responses to contain the pandemic:
- The first strategy is to attempt to eradicate the virus altogether, as China successfully did in response to 2002-2003 outbreak of SARS. This virus eventually became extinct by strictly isolating all infected persons.
- The second strategy is the exact opposite of the first – let the virus roam freely in the population to achieve herd immunity as quickly as possible and accept the casualties as the inevitable cost. This strategy is used routinely in response to the annual waves of the flu virus.
- The third strategy is to strictly contain the spread of the virus among vulnerable subgroups of the population whose health is severely affected by a COVID-19 infection, thereby avoiding excess casualties and overburdening the healthcare system, while waiting for either a vaccine or herd immunity to end the pandemic.
Since the second strategy is not considered an option by Dutch policy makers for the COVID-19 crisis, we focus on the first and third. Reducing the number of infections is consistent with the first strategy, while it is a waste when pursuing the third. The third strategy limits the number of susceptible persons by achieving herd immunity. As long as vulnerable subgroups can be isolated, infections for the remaining population aren’t a problem. Infections accelerate achieving herd immunity, thereby reducing the time that the vulnerable subgroups are exposed.
The difference in the role of infections in both strategies can be phrased in terms of externalities. In the first strategy, an infected person imposes a negative externality on the rest of the population by being a source of further infections. This negative externality justifies government-imposed lockdown policies to internalise the externality. In the second strategy, an infected person imposes a positive externality on the population, by being immune after infection and hence contributing to a protective wall against further contagion. Counterintuitively, the government may even have to stimulate infections among the less vulnerable subgroups of the population. Ignoring this third strategy of a selective lockdown explains why Alveda et al. (2020) conclude that a strict lockdown is the only way forward for Europe and the US.
Four parameters are critical for the choice between both strategies:
1)The number of infected persons– the higher this number, the further the first strategy gets out of reach
2)The ratio of casualties to infected persons– the lower the infection fatality rate, the lower the number of casualties during the transition-period towards herd immunity
3)Heterogeneity in vulnerability by age and pre-existing medical conditions– the sharper the distinction, the better the prospects of isolating the vulnerable subgroups
4)The likelihood that there will be a working vaccine and the expected time lag until a sufficient supply will be available– the higher the likelihood, the lower the benefits of achieving herd immunity.
…
The current experience suggests that it is becoming increasingly difficult to contain the number of new infections. A new package of restrictions (closing down bars and restaurants and tighter constraints on group sizes at family events) announced in the Netherlands in mid-October have reduced the number of new infections from 10,000 to fewer than 5,000 per day by mid-November. However, in the meantime, the number of infections is rising again. If the current policy of containing the number of infections is continued, stricter measures will be required.
The rise in infections is partly due to policy fatigue among the population. However, it is also an endogenous response, since infection rates among subgroups are heterogeneous. Initially, the majority of COVID-19-infections came from a broad middle group with moderate infection rates. Mild policy measures have reduced their infection rate such that their reproduction rate R got below one. However, as time goes by, infections in subgroups with high infection rates, which are less likely to strictly follow lockdown restrictions (for example, due to language barriers or because they don’t follow the news), start dominating the total number of infections if the exponential growth rate of infections in these subgroups outpaces that in the broad middle group. It requires increasingly costly measures to bring the R of these high infection-rate groups below unity. Therefore, heterogeneity in infection rates provide another argument to strive for herd immunity. Indeed, Britton et al. (2020) show that herd immunity might even be reached when just 40% of the population is immune to the virus due to this heterogeneity.
This evidence casts serious doubts on the efficacy of the Dutch government’s current policy. The government states as its objective that it wants to reduce the number of infections from its peak of 10,000 persons per day around 25 October 25, beyond its current value of 5,000 persons per day, to much lower numbers. The question is: what goal is served by this policy objective? On the one hand, the soaring number of infections and the relatively mild impact on the number of casualties suggest that herd immunity can be achieved within a reasonable amount of time. On the other hand, the increasing difficulty in keeping the number of new infections down by further restrictions suggests that there is no alternative to herd immunity until a vaccine becomes available in sufficiently large numbers.
Our ambition is not to provide a full-fledged social cost-benefit analysis. Such an analysis would require a proper, well-defined baseline scenario for what would have happened without policy interventions. We simply have no realistic way of addressing this question. Instead, we provide some numbers to put the cost of the current policy strategy into perspective.
First, the impact of COVID-19 on life expectancy is small. For the age group between 75 and 85, whose life expectancy has been most affected, the effect on the life expectancy at birth is only one to two weeks.4 The secular increase in our life expectancy at birth, enabled by the unprecedented improvement in our prosperity since WWII, is about five weeks per year. COVID-19 costs the most severely affected generations therefore one third of the annual improvement in life expectancy.
Second, the risk of prolonged recessions due to a second or even third wave of lockdown policies is substantial. The cost of such recessions can be large and long lasting (De Long and Summers 2012). Moreover, recessions also generate substantial long-term health costs. Sullivan and Von Wachter (2009) and Schwandt et al. (2020) have shown this for the US. For example, people who entered the labour market during the deep recession in 1982 were less likely to marry and to have children and more likely to divorce. They suffer from ‘illnesses of despair’ – lung cancer, liver disease, and drug addiction. Their life expectancy was negatively affected by between six and nine months, much larger than the effect of COVID-19 for the age group between 75 and 85. One might presume that these costs are smaller in the EU than in the US, due to the more extensive European welfare state. However, these number are instructive to put the cost of COVID-19 into perspective. COVID-19 turns out to yield a similar cost in terms of lost life years as a recession with an increase in the unemployment rate of between 1.5 and 2% percentage points.
Third, the importance of education for almost all aspects in life – wellbeing, life expectancy, earnings capacity, crime, social behaviour – has been well documented. The cost of interruptions in the education process are therefore substantial. …
Fourth, the healthcare system is currently operating under severe stress. One wonders what the most important explanation for this stress is – COVID-19 itself or the lockdown policies to counter it? Since the number of casualties at the peak of second wave was about half that of the first wave, casualties alone can hardly offer a full explanation for the stress on the system. There is substantial sick-leave among nurses and doctors due to the lockdown restrictions and isolation rules. The economic costs of the lockdown are measured not only in lost profit, but also in a lower capacity of the healthcare system.
Finally, Table 5 compares the worldwide number of casualties, both in absolute numbers and relative to total population, of the COVID-19 pandemic, the Spanish flu pandemic in 1918 and the Hong Kong flu in 1968. The numbers for COVID-19 are comparable to the Hong Kong flu, but much lower than the Spanish flu. Nevertheless, the policy response to the latest pandemic has been unprecedented.
Table 5 Casualties of Spanish flu (1918), Hong Kong flu (1968) and COVID-19 pandemics (2020)
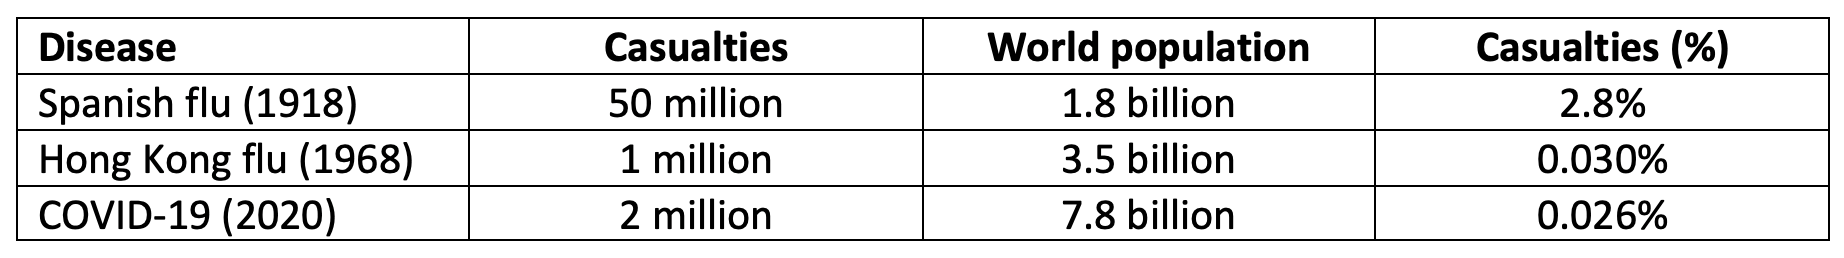
As a final note, government policy should be evaluated not only on its direct impact, but also on the broader effect of government communication of COVID-19-policy. One lesson of the Great Recession was that austerity was not expansionary and that announcements of more austerity did not inspire confidence, but rather destroyed it. Although exaggerating the dangers of an uncontrolled pandemic might help to raise the social acceptance of lockdowns and to improve the following of regulations, creating an atmosphere of imminent doom may do severe harm to consumer and business confidence and thereby kill economic activity in the long run.
In conclusion, since COVID-19 has spread widely across Europe and the US, we no longer have any chance to eradicate it; we shall have to live with it. The good news is that recent data have shown that we can handle a much larger number of infections without excessive social cost. Dutch COVID-19 policy should therefore move away from controlling infections towards creating herd immunity by letting the COVID-19-virus roam freely among the non-vulnerable groups, while strictly protecting the vulnerable groups. Currently, a daily number of infections of 8,000 (about 0.05% of the population) would seem to strike a proper balance between keeping the cost of lockdown policies manageable and speeding up the process of achieving herd immunity.
30 novembre 2020
GORDON BETCHERMAN, MAURO TESTAVERDE
How to protect jobs during Covid-19: Lessons from the Greek experience
(synthesis; full article – VoxEu CEPR 18 November 2020 – : https://voxeu.org/article/how-protect-jobs-during-covid-19-lessons-greece)
Abstract: The Covid-19 crisis has profoundly affected employment everywhere, but countries have adopted different strategies to try to mitigate the worst of the effects. This column compares the Greek experience to the rest of Europe, as well as to North America. The authors conclude that given the nature of the pandemic, models for managing labour market shocks will need to offer extended support where the shock persists or reoccurs. Crucially, successful policy approaches will need to be well suited for enabling job creation once conditions are in place for a restart.
Keywords: COVID-19 crisis, unemployment, employment levels, Eupean policies, labour market, Greece’s experience.
The Covid-19 crisis has profoundly affected employment everywhere. The evidence is now available on the impacts seen during the first few months of the pandemic (ILO 2020). In some countries, like the US and Canada, unemployment quickly skyrocketed to levels not seen in living memory. In others, including several in Europe, the labour market response looked very different, with few layoffs and workers remaining attached to their employer (even if they were working little, or not at all). Various factors explain these differences in how labour markets adjusted. For example, the severity of the pandemic, the structure of the economy, and the implicit social contract between employers and employees all played an important part in determining the effect of the pandemic on labour markets.
Another key factor – and perhaps the most important one – has been the different policy choices countries have taken to mitigate the economic costs of the virus and lockdowns and to protect workers (e.g. Juranek et al. 2020). Broadly speaking, countries have followed two models: one emphasising income support for those losing their jobs or livelihoods through expanded unemployment insurance and other cash transfers; the other emphasising job retention through wage subsidies, layoff restrictions, and short-term compensation schemes (OECD 2020). How successful these models were in the initial months of the crisis will offer important lessons for policymakers in dealing with the immediate consequences of future shocks. But equally important for a full assessment is how countries using different approaches respond to second (and subsequent) waves, and eventually to fully restarting their economies in a ‘post-pandemic’ world.
We have recently been able to put together a detailed picture of the early months in one country, Greece, which has followed the job retention model. More specifically, we have analysed the short-run labour market impacts of the pandemic and lockdown using survey, administrative, and online job postings data (Betcherman et al. 2020). What we found was that Greece’s job retention approach successfully mitigated the possibility of large-scale unemployment. However, the consequences of the lockdown were manifested in other ways, specifically in terms of job creation. We plan to carry out an updated analysis in the coming months to see how the labour market responded to the relaxation of the lockdown and a partial reopening of the economy.
Greece’s experience provides an interesting case study, albeit an unfortunate one (since the pandemic arrived at a time when the economy finally seemed to be recovering from the decade-long economic crisis). Especially in the early months, Greece managed the virus well, through a rapidly imposed and strict lockdown. But the cost has been a severe economic downturn (among the worst in Europe). GDP declined by 14% in the second quarter and the IMF projects that GDP will decline by 9.5% in 2020 (IMF 2020). In early November, the government announced a second lockdown which may result a further decline in the GDP numbers.
Mobility data show that, beginning in early March with the initial lockdown, Greeks stayed home. This only gradually started to change after early May (when many restrictions were lifted). But unemployment did not increase. In fact, we found that the number of separations in those months was actually lower than separations in the same months in previous years. This does not mean that the labour market was not significantly affected by the pandemic and lockdown. It was – virtually no jobs were created in these months. That is particularly noteworthy when the heavily seasonal nature of the Greek economy is taken into account. The late winter and spring are typically months when the very important tourism sector is hiring for its busy summer season. In fact, our analysis found that employment by the end of June was 12% lower than it would have been had there not been a pandemic, with the majority of these ‘missing’ jobs related to tourism.
Figure 1 ‘Missing jobs’: Actual daily employment levels in the first half of 2020 compared to expected trends based on 2018 and 2019
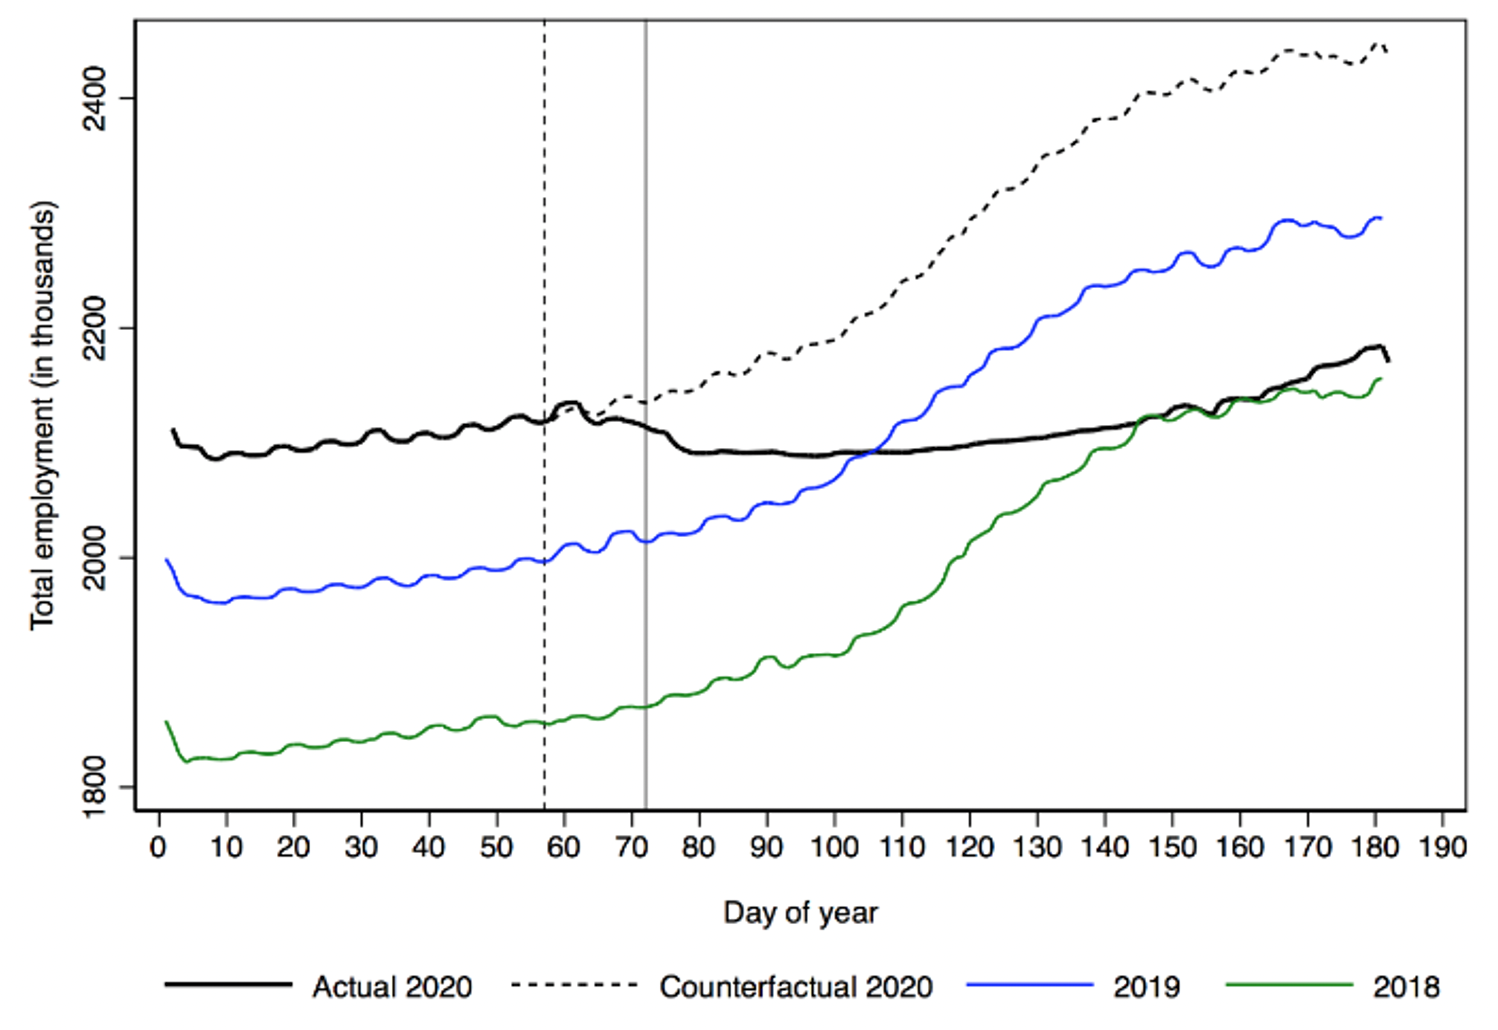
Source: Betcherman et al. (2020), based on ERGANI data.
Notes: Vertical lines are set in the days when the first COVID-19 case was identified (26 February 2020) and when workplace restrictions were implemented (12 March 2020).
What explains these patterns in the first months after the pandemic started – a major economic slowdown, but no increase in layoffs and all of the impact coming from a virtual halt on hiring? The answer lies in the job-retention policies that the Greek government adopted to mitigate the costs of the lockdown and protect workers. Cash transfers were available to workers on the condition they were not laid off from their employers (whose operations had been harmed by the lockdown). Moreover, layoffs were prohibited in sectors designated as affected by the crisis. So, this strategy ensured that large numbers of layoffs would not be a consequence of the shock.
Greece was one of several countries in Europe adopting job-retention approaches that experienced similar trends in the early months of the crisis. In France, the unemployment rate actually fell from 7.7% in February to 6.6% in June. Germany, in some ways the original architect of the job protection strategy (with its Kurzarbeit short-term compensation scheme), had only a slight uptick in the unemployment rate over these months, from 3.6% in February to 4.3% in June. Compare these trends to those in North America, where the emphasis was on income support more than job retention: between February and June, the unemployment rate increased by almost seven percentage points in Canada and by almost eight percentage points in the US. A similar picture emerges when we look at the job numbers in the early months. Total employment in the second quarter fell by 11% in Canada and 13% in the US, compared to just 3% in Greece and 2.5% across the EU.
Table 1 Employment and unemployment trends during the first months of the crisis in different countries
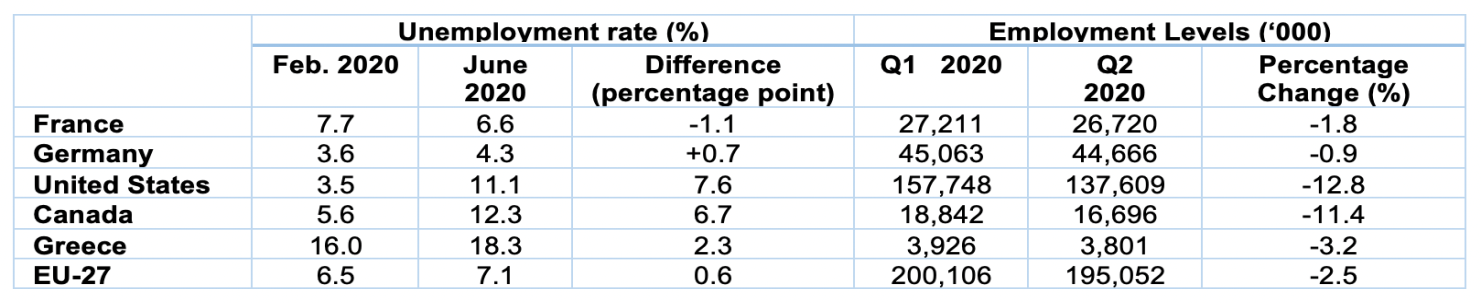
Source: OECD statistics; German Federal Statistical Office
The evidence from the early months of the crisis seems to highlight the advantages of policies that protected jobs rather than supported workers who lost them. This was also observed in the global financial crisis (Giupponi and Landais 2020, Scarpetta et al. 2020). However, some caution is needed in interpreting these trends because of the challenges in measuring labour market states like employment and unemployment during the pandemic. Many furloughed workers in Greece and other European countries may have continued to be counted as ‘employed’ but were, in fact, not working – even though measured employment in Greece fell by only 3% in the second quarter, hours worked declined by 19%.
The job-retention model offers the advantage that firms looking to ‘gear up’ again will not have to search for new employees in the labour market. However, if they will not be recalled, furloughed workers may be less likely to search for a new job than an unemployed worker, perhaps because they don’t realise their job will only exist as long as the subsidy exists. Income support models, instead, seem better suited for speedier labour market recoveries since they force the relocation of workers from firms and sectors that may no longer be viable to those with better long-term prospects (OECD 2020). Again, there was evidence of this in the financial crisis (Rothwell 2020), and initial evidence suggests this may be the case with the pandemic as well. Employment rebounded strongly in Canada and the US in the third quarter, growing at 8.6% and 6.2% respectively. With this job growth, the unemployment rates in those countries fell by 3-4 percentage points in the quarter, while the rate across the EU rose.
Given the ‘halting’ nature of the economic recovery almost everywhere, the emphasis on protecting livelihoods will need to remain a focus for some time. However, as conditions permit, strategies will need to shift toward proactive policies that enhance employment possibilities for unemployed and otherwise vulnerable workers. It is important that the pool of workers without jobs now does not become a pool of long-term unemployed workers down the road. The pandemic is accelerating technological and structural changes, so these workers will need to be prepared for the occupations and skills that will be in demand in the ‘post-Covid’ labour market (Chernoff and Warman 2020). When financing to protect workers’ incomes can be scaled back, countries will need to be prepared to reallocate funding to activation programmes that improve the efficiency of job search and job matching, and that offer relevant skills training for the new job openings. One way to meet this challenge will be to learn from the experiences gained during the pandemic with using technology to deliver programmes and services.
In summary, given the nature of this crisis, models for managing labour market shocks will not only need to provide effective protection in the short run but also offer extended support where the shock persists or reoccurs (as seems to be the case with Covid-19). Moreover, successful policy approaches will need to be well suited for enabling job creation once conditions are in place for a restart.
23 novembre 2020
ALEXANDER CHUDIK, KAMIAR MOHADDES, M. HASHEM PESARAN, MEHDI RAISSI, ALESSANDRO REBUCCI
Economic consequences of Covid-19: A counterfactual multi-country analysis
(full article – VoxEu CEPR 19 October 2020 – : https://voxeu.org/article/economic-consequences-covid-19-multi-country-analysis)
Abstract: The Covid-19 pandemic is unprecedented in its global reach and impact, posing formidable challenges to policymakers and to the empirical analysis of its direct and indirect effects within the interconnected global economy. This column uses a ‘threshold-augmented multi-country econometric model’ to help quantify the impact of the Covid-19 shock along several dimensions. The results of the analysis show that the global recession will be long lasting, with no country escaping its impact regardless of their mitigation strategy. These findings call for a coordinated multi-country policy response to the pandemic.
Keywords: Covid-19 pandemic, Interconnected Global Economy, global recession, supply and demand.
The Covid-19 pandemic is a global shock ‘like no other’, involving simultaneous disruptions to both supply and demand in an interconnected world economy. On the supply side, infections reduce labour supply and productivity, while lockdowns, business closures, and social distancing also cause supply disruptions. On the demand side, layoffs and the loss of income (from morbidity, quarantines, and unemployment) and worsened economic prospects reduce household consumption and firms’ investment. The extreme uncertainty about the path, duration, magnitude, and impact of the pandemic could pose a vicious cycle of dampening business and consumer confidence and tightening financial conditions, which could lead to job losses and investment. Key challenges for any empirical economic analysis of Covid-19 are how to identify this unprecedented shock, how to account for its non-linear effects, how to consider its cross-country spillovers (and other observed and unobserved global factors), and how to quantify the uncertainty surrounding forecasts, given its unprecedented nature.
A rapidly growing body of research investigates the heterogeneous, non-linear, and uncertain macroeconomic effects of Covid-19 across countries, sectors in individual countries, as well as on a global scale. Pagano et al. (2020) and Capelle-Blancard and Desroziers (2020) consider the effects of the pandemic on the US stock market and highlight its differential impact on various sectors of the economy. Ludvigson et al. (2020) quantify the macroeconomic impact of Covid-19 in the US using a VAR framework and a gauge of the magnitude of the Covid-19 shock in relation to past costly disasters. Baqaee and Farhi (2020) consider possible non-linearities in response to the pandemic in a multi-sectoral model. They demonstrate how these shocks are amplified or mitigated by nonlinearities, and quantify their effects using disaggregated data from the US. McKibbin and Fernando (2020) explore the global macroeconomic effects of alternative scenarios of how Covid-19 might evolve in the year ahead, highlighting the role of spillovers. Our framework embeds the salient features of these quantitative analyses.
Covid-19 studied in a multi-country model with threshold effects
In a recent paper (Chudik et al. 2020), we depart from single-country analyses and develop a multi-country econometric model that is augmented with global volatility threshold variables. These are intended to capture the effects of rare events such as Covid-19, and account for spillovers and interconnections of countries and markets. We first document that excessive global volatility can affect output growth in many advanced economies and several emerging markets. The novelty of our work compared to the standard threshold-regression models is that non-linearity is triggered by a measure of global uncertainty rather than country-specific shocks or volatility episodes.
Next, we estimate a multi-country model (including 33 economies) augmented with these threshold effects from January 1979 through to December 2019. Our framework (which we call a threshold-augmented GVAR, or ‘TGVAR’) is an extension of the standard GVAR model surveyed in Chudik and Pesaran (2016). Our updated model takes into account both the temporal and cross-sectional dimensions of the data, real and financial drivers of economic activity, and common factors such as oil prices and global volatility. It also distinguishes between common latent factors and regional trade linkages. Country-specific models include output growth, the real exchange rate, as well as real equity prices and long-term interest rates when available.
The Covid-19 shock is identified using the IMF’s GDP growth forecast revisions between January and April 2020, under the assumption that Covid-19 was the main driver of these forecast revisions. We then quantify the economic impact of the shock by comparing the forecast of the world economy from January 2020 to December 2021 with and without the Covid-19 shock, employing ‘generalised impulse response functions’. We account for sample uncertainty and report a range of likely outcomes by ‘bootstrapping’ the conditional forecasts based on the constellation of common, regional, and country-specific disturbances that the world economy had experienced in the past.
The impact of Covid-19 on economic activity and long-term interest rates
There are several channels through which excessive global volatility can affect economic growth. They include higher precautionary savings, lower or delayed investment (owing to increased uncertainty and weaker demand prospects), and a higher cost of raising capital (owing to higher funding costs in a volatile environment) (Cesa-Bianchi et al. 2020). Following the widespread outbreak of Covid-19, as in previous episodes of financial stress, global volatility spiked. Our country-by-country analysis establishes the importance of global volatility (whenever it exceeds an estimated threshold level) for driving subsequent output growth. For simplicity, the econometric specification only allows for intercept shifts in output growth, with threshold level (and corresponding probabilities of crossing it) estimated by maximum likelihood method for advanced and emerging economies separately.
The estimated threshold level for advanced economies is 0.156 per quarter, slightly higher than the estimate of 0.129 obtained for emerging markets (Figure 1). Note that the global volatility surpassed the 0.156 level in four quarters over the period 1979Q2 to 2019Q4 (i.e. the probability of such an event occurring is very low: about 2%). The global volatility threshold variable is statistically significant in 15 out of 19 advanced economies in our sample (80% of cases) and four out of 14 emerging economies (Figure 2). Nevertheless, threshold effects are negative in all advanced economies and all but three emerging markets. Moreover, these results become stronger when we re-run the analysis with a shorter sample from 1990.
Figure 1 Global volatility and GDP growth, 1979Q1-2020Q1
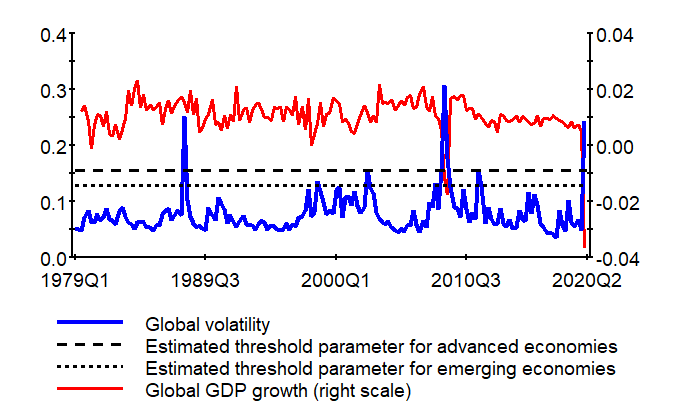
Figure 2 Estimated country-specific threshold effects, 1979Q2-2019Q4
(a) Advanced economies
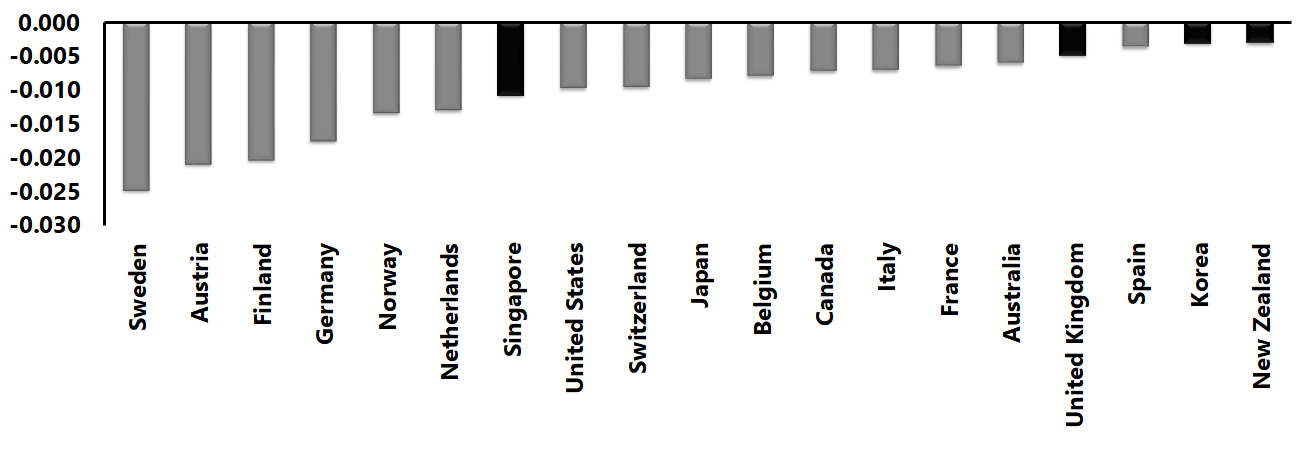
(b) Emerging economies
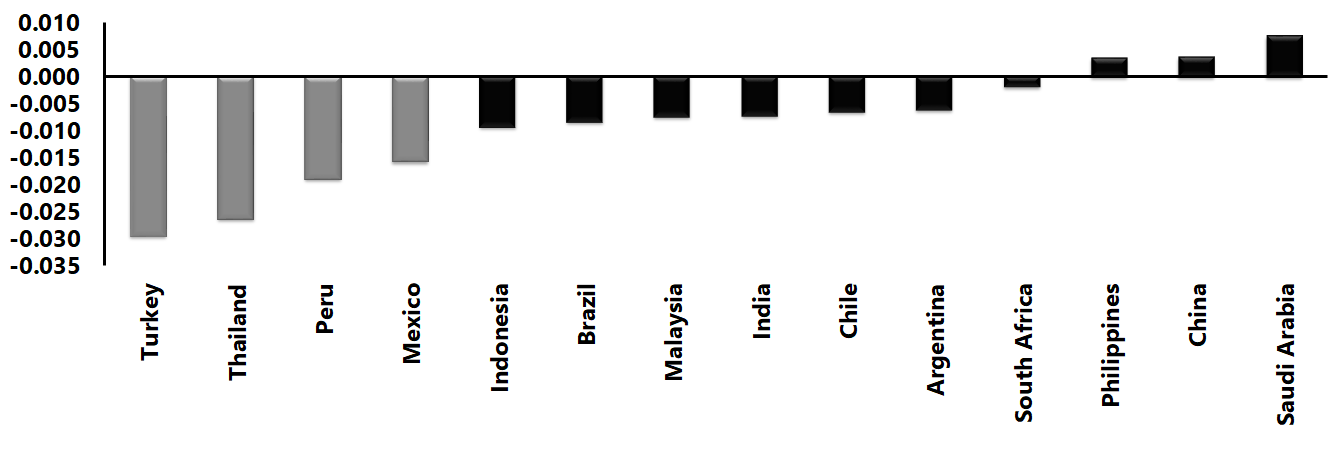
Note: Only the gray bars are statistically significant at the 5% level.
Having shown the importance of the global volatility threshold effects for subsequent output growth, we present the estimation results of our more general ‘TGVAR’ model below. Our counterfactual analysis with this model suggests that the pandemic will likely knock three percentage points off real world GDP relative to the level of global economic activity that would have materialised in the absence of the shock (Figure 3).
The US and the UK are quite likely to experience deeper and longer-lasting effects, while China’s outcome has more than a 50% chance of being much better. The odds for the euro area are skewed negatively, but there is some probability mass that it recovers faster than the US by the end of 2021.
Figure 3 Counterfactual real GDP projections, 2020Q1-2021Q4
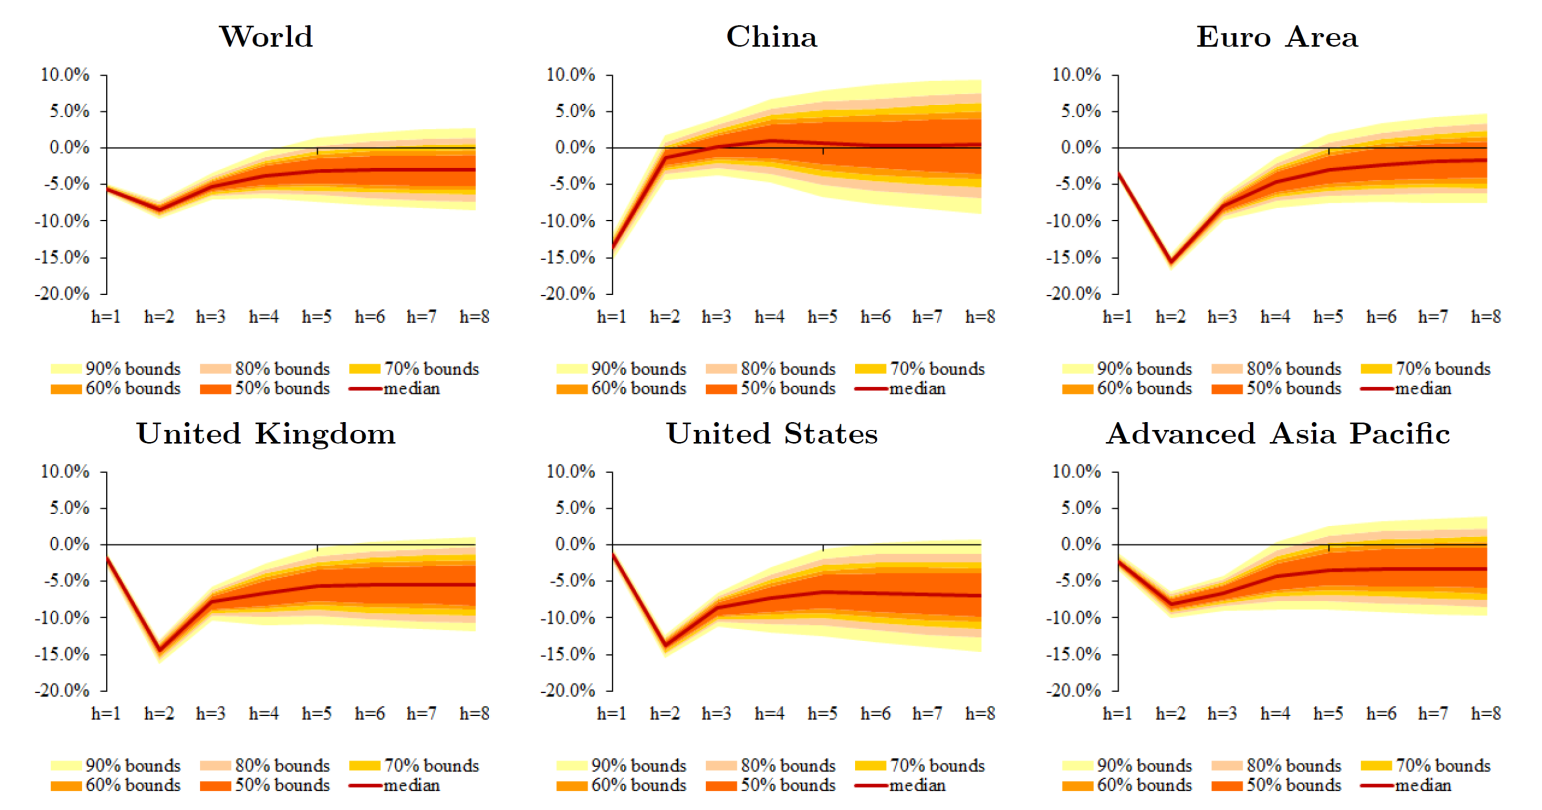
Note: The impact is in percent and the horizon is quarterly.
Pulled by China, the rest of “Emerging Asia” has a higher chance of performing better than the global average. Non-Asian emerging markets stand out for their vulnerability (Figure 4). They will likely suffer from a significant output collapse in the first and second quarter of 2020 and have a less than 20-30% percent chance of not experiencing an output loss by the end of 2021. Turkey, South Africa, and Saudi Arabia (grouped together as “Other Emerging Markets”) will almost certainly see at least eight quarters of severely depressed economic activity.
Figure 4 Counterfactual real GDP projections for emerging markets, 2020Q1-2021Q4
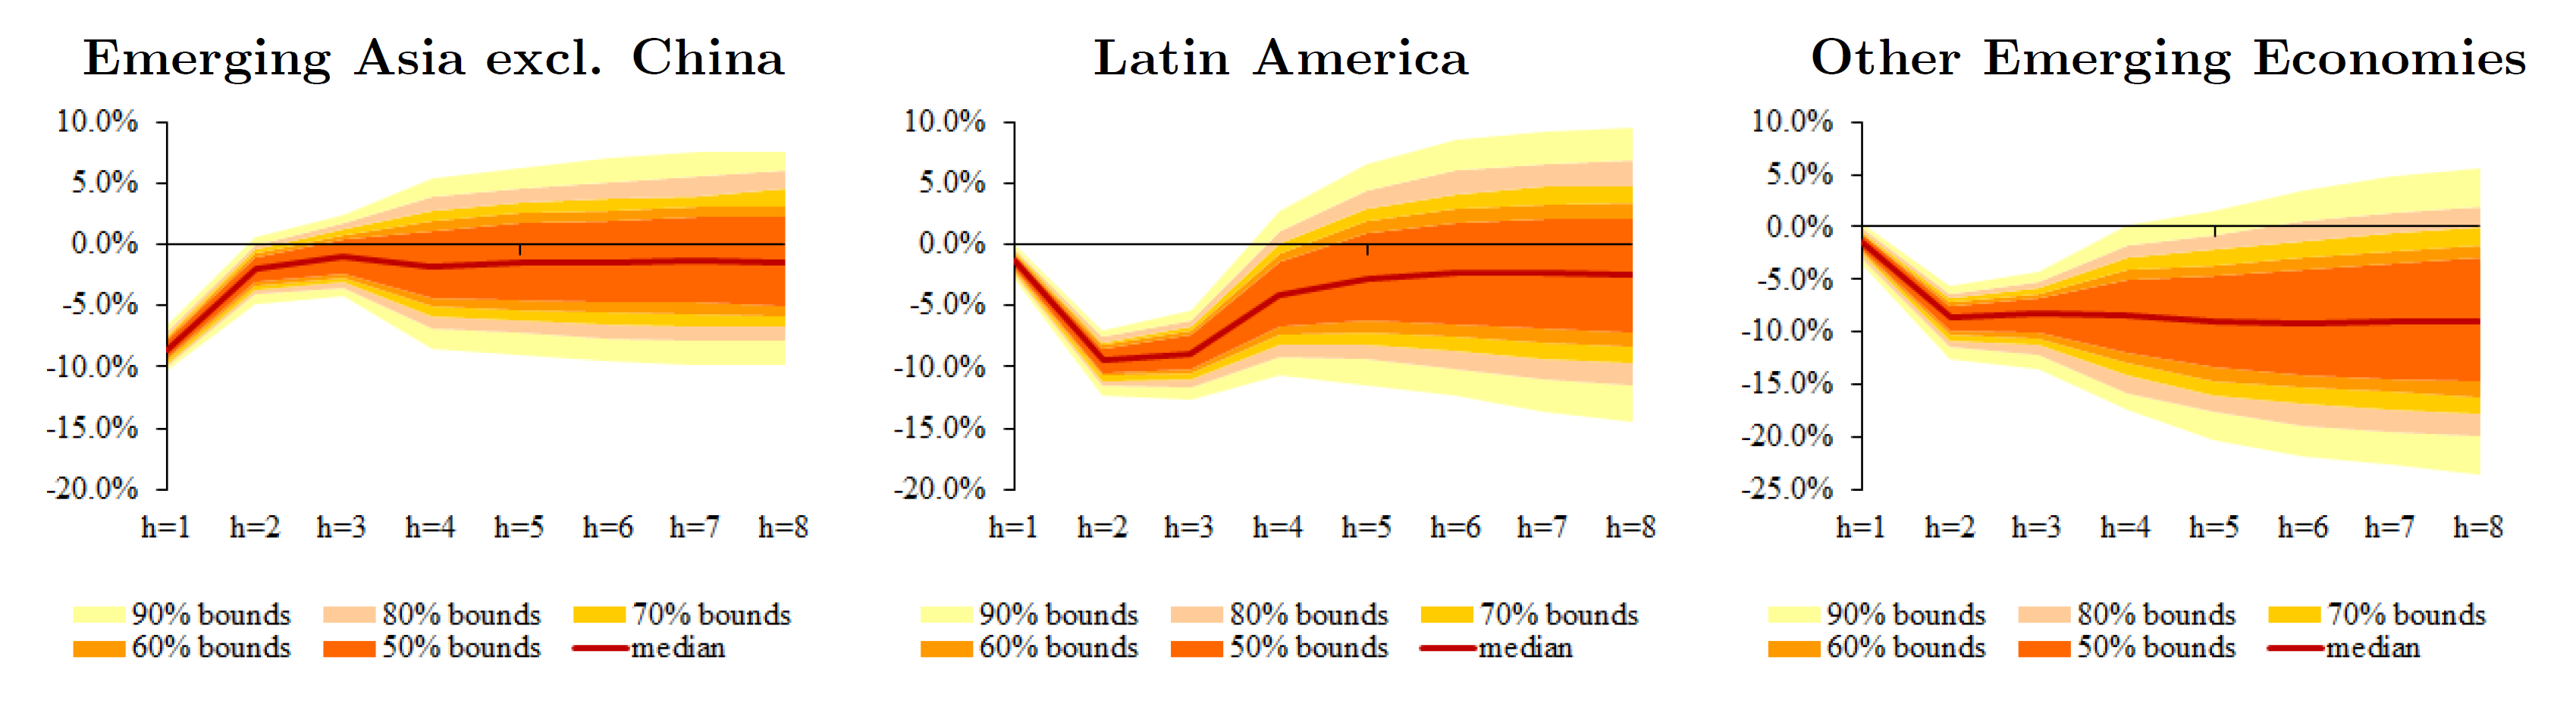
Notes: The impact is in percent and the horizon is quarterly.
Importantly, our findings underscore the role of spillovers, which we quantify for the case of Sweden, considering its distinctly different policy approach toward the pandemic. The Swedish case illustrates that no country is immune to the economic fallout of the pandemic because of interconnections and the global nature of the shock (Figure 5).
Figure 5 Counterfactual real GDP projections for Sweden, 2020Q1-2021Q4
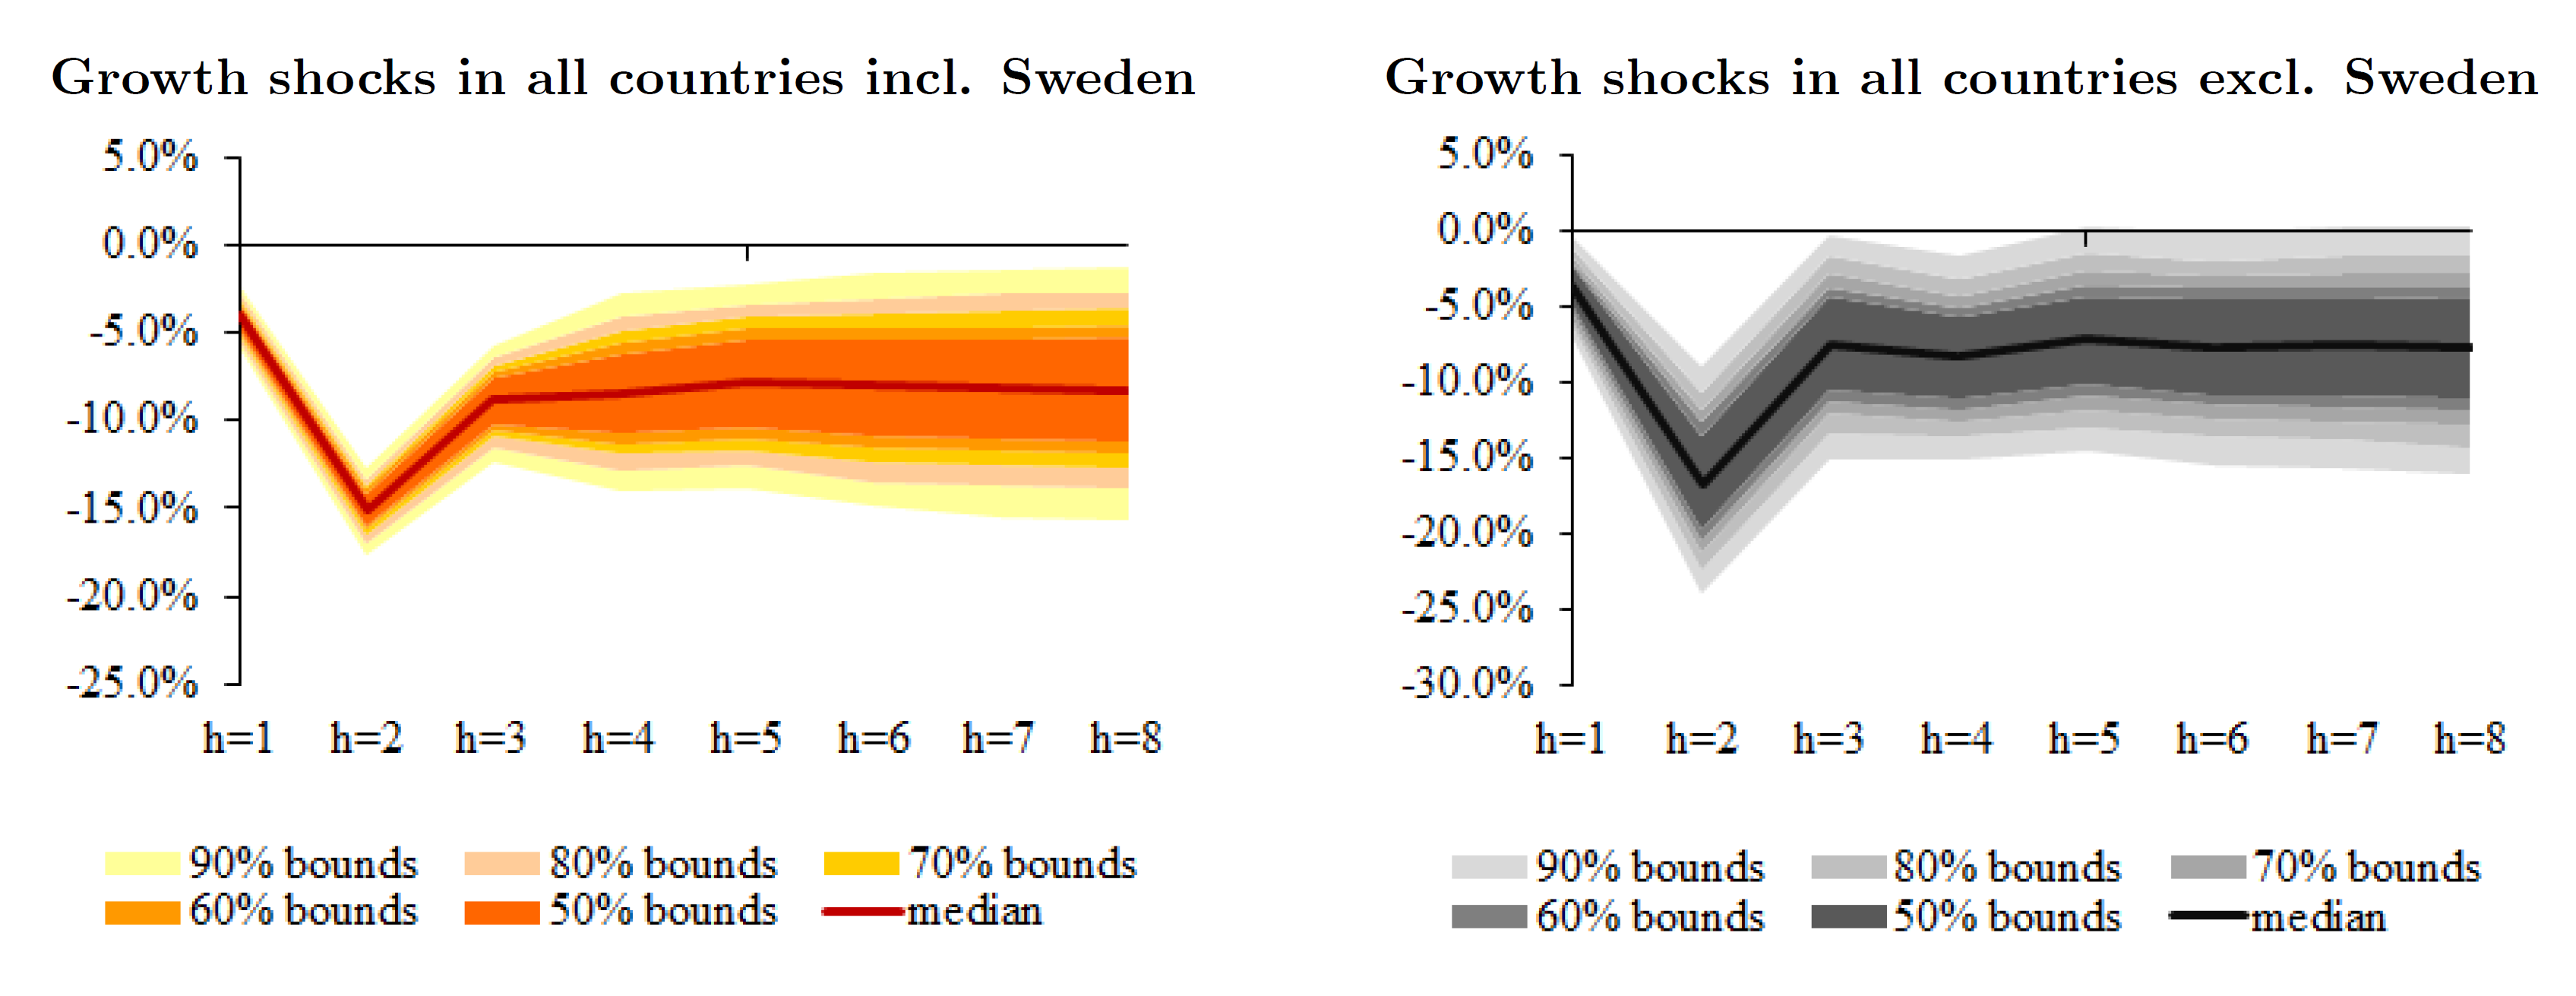
Notes: The impact is in percent and the horizon is quarterly.
We also estimate that the pandemic will likely lower long-term interest rates in the advanced economies by about 100 basis points below their pre-Covid-19 lows (Figure 6). This is because the crisis raises precautionary savings and dampens investment demand. However, the same cannot be said with certainty about emerging market economies where borrowing rates can increase rapidly (as shown by the upper range of our counterfactual exercise).
Figure 6 Counterfactual projections for long-term interest rates, 2020Q1-2021Q4
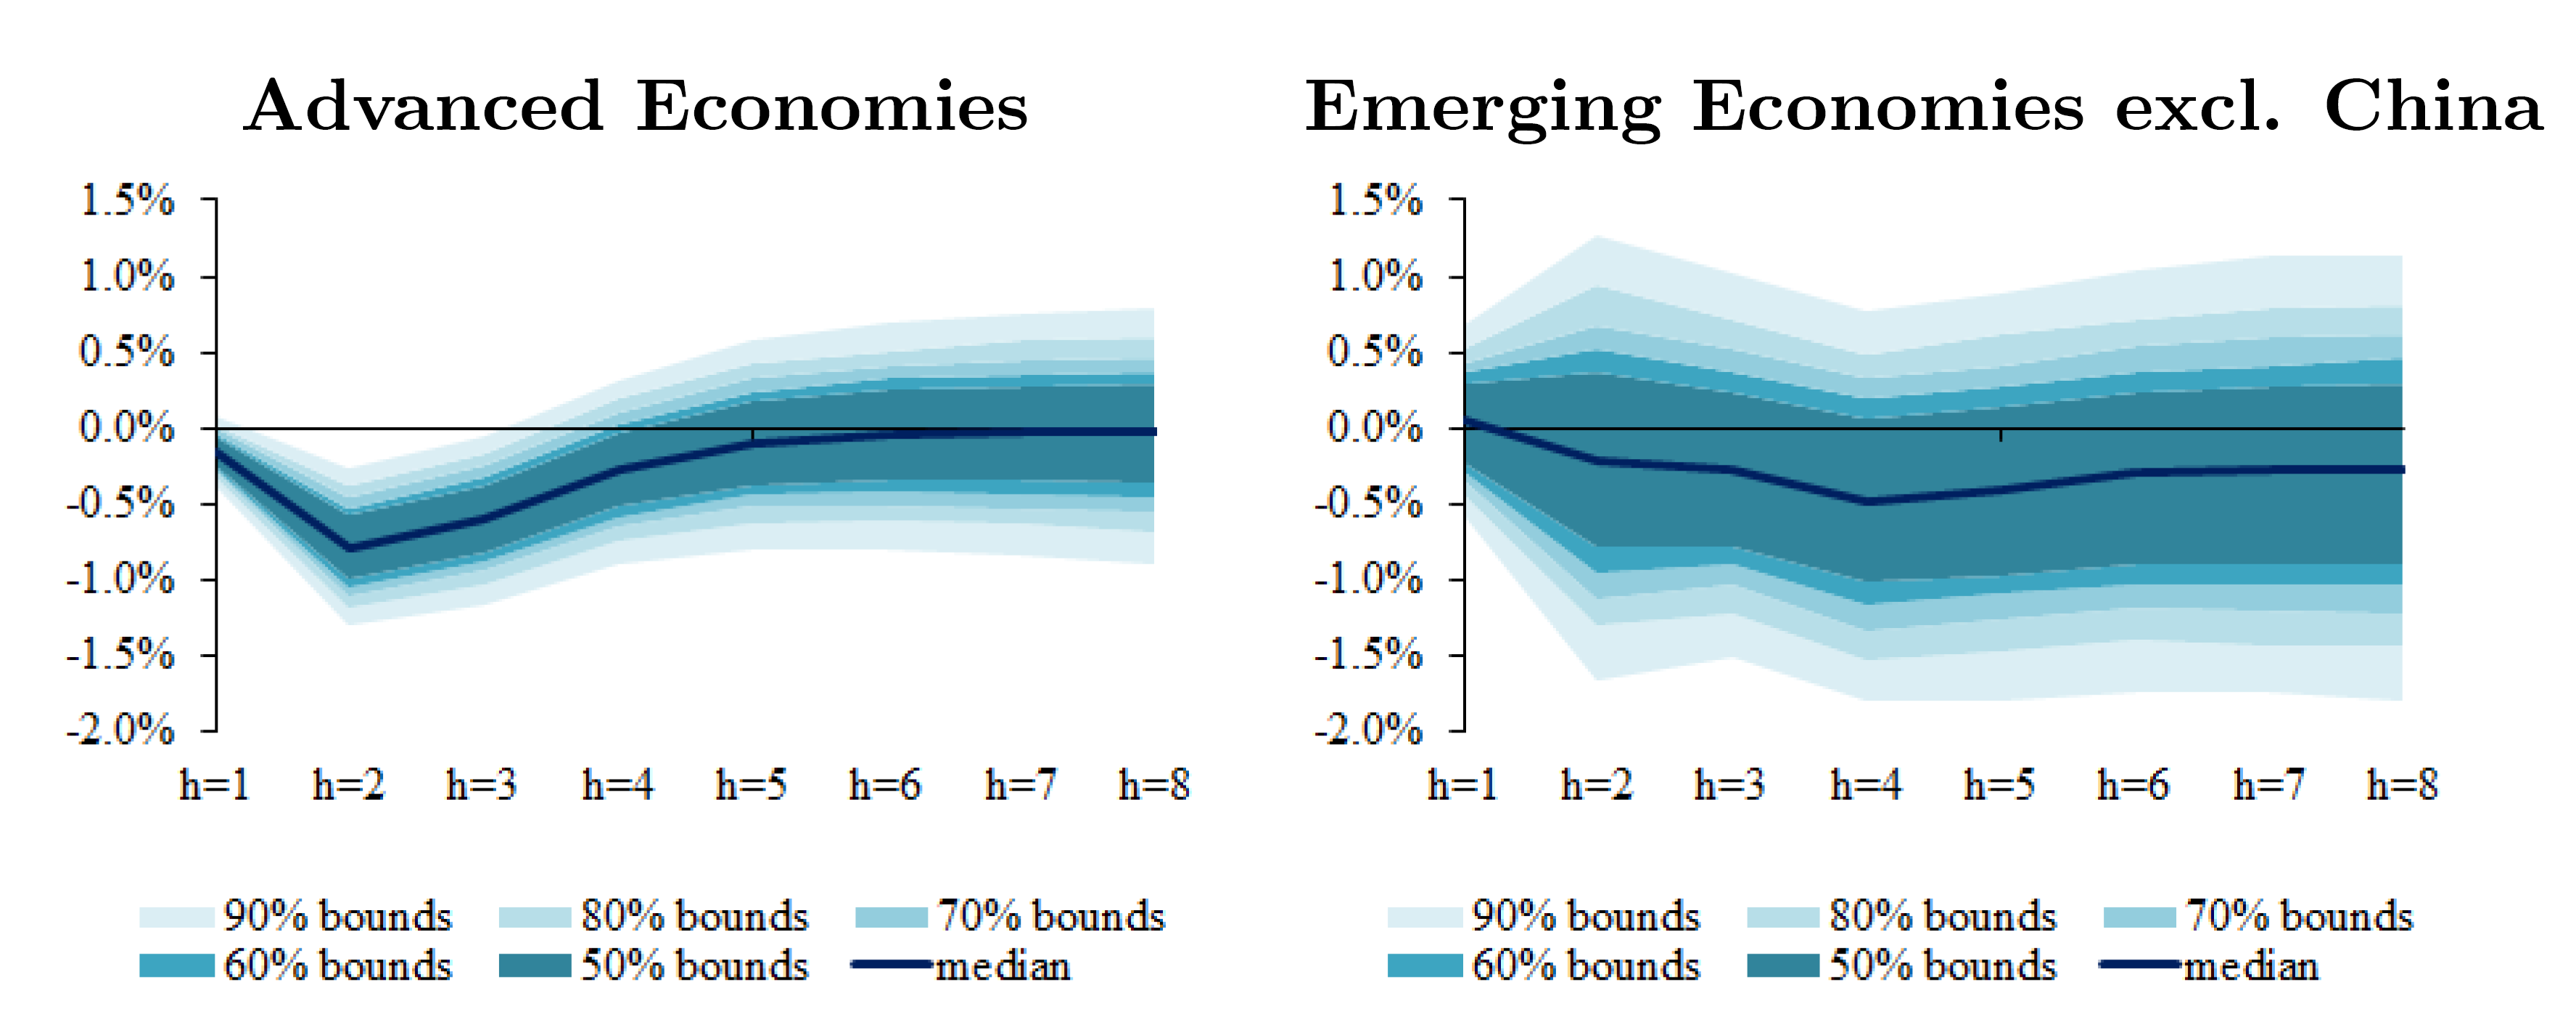
Notes: The impact is in percentage points and the horizon is quarterly.
Concluding remarks
Our counterfactual analysis points to large and persistent negative effects of the pandemic on the world economy, with no country escaping unscathed. China and the ‘Emerging Asia’ group will fare better in the near term. The Swedish example, however, serves as a warning that no economy is immune from the negative consequences of Covid-19 in an interconnected global economy. Non-Asian emerging markets are particularly vulnerable.
These findings highlight the importance of a comprehensive and a coordinated cross-country policy response to the pandemic. This includes global efforts to ensure swift deployments of medical resources (including vaccines when available), policy interventions that can restore the normal functioning of financial markets, as well as other measures that can support firms and households. Finally, a risk management approach to policymaking would call for activism to buy insurance against the tail events that are depicted by the distribution of likely outcomes. These efforts would likely limit the amount of scarring.
16 novembre 2020
JOSHUA AIZENMAN, HIRO ITO
Post-Covid-19 exit strategies and economic challenges for emerging markets
(synthesis; full article: https://voxeu.org/article/post-covid-19-exit-strategies-and-economic-challenges-emerging-markets)
Abstract: The economic policies of the US in the post-COVID era will have important implications for the global economy. This column outlines two different exit strategies for the US from the COVID-related debt-overhang and analyses their implications for emerging markets and global stability. A strategy of continuing loose fiscal policies and accommodating monetary policies may spur short-term growth but would also increase the risks a deeper crisis in the future. Alternatively, the US could adopt a two-pronged approach of shifting fiscal priorities towards expenses with high social payoffs and then promoting fiscal adjustments aimed at a primary surplus and debt resilience. The post-WWII success story illustrates the feasibility of, and gains from, a two-pronged fiscal strategy.
Keywords: COVID-19 pandemic, post-COVID, COVID-related debt, global economy, recession.
The COVID-19 pandemic has wreaked havoc on the global economy in 2020. To contain the spread of the virus, many countries shut down their economies by halting the movement of people and goods in the spring of 2020, leading about one-third of the world’s population to experience constrained life conditions due to these lockdowns. Consequently, the world economy contracted significantly. The fact that it hit China first induced significant supply chain contagion, intensifying the decline in manufacturing trade and output (Baldwin and Weder di Mauro 2020). To calm financial markets and avoid a possible free fall into a Great Depression, many countries, especially advanced economies (AEs), mobilised policy resources. According to the Manhattan Institute, the US alone will run a budget deficit of $4.2 trillion, or 19% of its GDP – the largest share since the deficit peak during WWII (Figure 1). That would push the US national debt held by the public to $41 trillion, or 128% of GDP, by 2030. This level of the national debt would exceed the level that occurred in 1946 (Figures 2 and 3).
Figure 1 US budget deficit
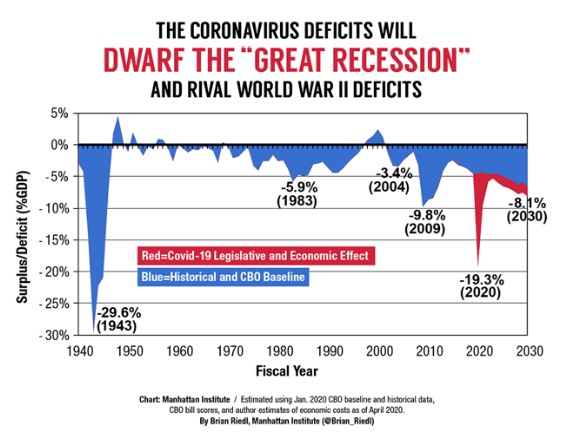
Source: Manhattan Institute (https://www.manhattan-institute.org/coronavirus-cbo-budget-deficit-projection)
Figure 2 US national debt
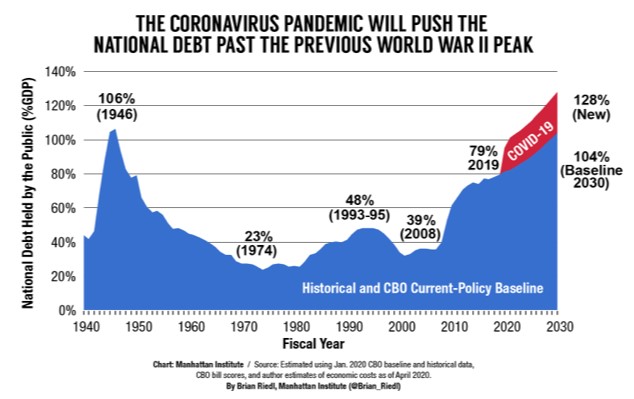
Source: Manhattan Institute (https://www.manhattan-institute.org/coronavirus-cbo-budget-deficit-projection)
Figure 3 US national debt projection, September 2020
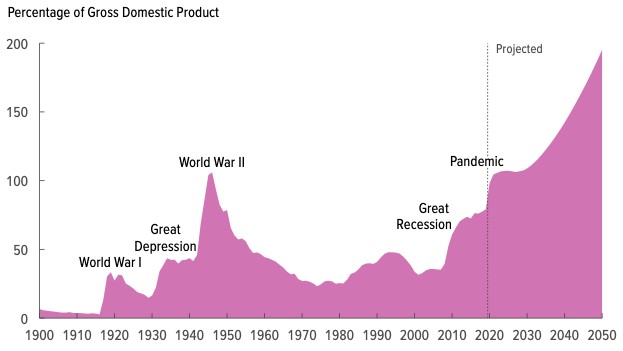
Source: Congressional Budget Office report, September 2020
With vaccinations for the virus possibly in sight, it is time to ponder an effective economic exit strategy into the post-COVID era. The road the US will take will have overarching repercussions on the global economy, given the size and the pivotal role of the US dollar as the anchor of the global financial system. To gain more insight on the road ahead, in Aizenman and Ito (2020) we compare two divergent US post-COVID economic strategies. The first is just ‘kicking the can down the road’ – that is, the US government could delay implementing needed macroeconomic adjustments and gamble for a resurrection of the economy while continuing to run lax monetary and expansionary fiscal policies. This choice may bring about short-term buoyancy to the US economy but will more likely come with growing exposure to the risk of a future global crisis, possibly worse than the 2008-2011 crisis.
Alternatively, the administration could adopt a two-pronged policy of reallocating the fiscal efforts first, while aiming at reaching a primary surplus over time. Specifically, it could retrench from expenditures oriented towards COVID-related challenges, and move towards expenses with a high social payoff (upgrading K-12 education, investing in medical infrastructures, etc.). With a lag, the restructured fiscal policy, together with a rise in tax collection, may reduce primary budget deficits, aiming to reach surpluses.
…
Specifically, we examine the interest-rate-growth differentials in the post-WWII period. In the period of 1946-1956, the post-WWII US fiscal policy facilitated global growth where the US, Western European countries, and Japan successfully grew while repressing the interest rate. Their snowball effect, r – g, was often negative during that period. This helped to load-off the public debt overhang associated with the war and reconstruction efforts. In contrast, during 1974-1984, the snowball effect became unsustainably high for many emerging market economies (EMEs), triggering a series of financial crises. Next, we investigate whether and to what extent the cost of serving the public debt affected real output growth. The flow cost of serving debt is estimated by the snowball effect times the public debt as a share of GDP. A higher flow cost of serving the debt may lead investors to question debt sustainability, raising the interest rate, reducing the growth rate, and further increasing the snowball effect. This negative feedback may induce costly market corrections, financial instability, and crisis. The emerging markets’ lost growth decade during the 1980s, and the euro area sovereign debt crisis affecting mostly the Southern euro area states illustrate these dynamics vividly.
Figure 4 shows that the median interest rate growth differential, r – g, is mostly low and in the negative territory during the 1940s and 1950s. Thereby, the US, Japan, and Western European countries benefited from low costs of serving their public debt during the post-WWII recovery decades. The snowball differential continued to be in the negative territory during the 1970s. In the early 1980s, the differential rose up rapidly to the positive territory and mostly remains there until 2000. The 75th percentile (dotted blue) line hovers at high levels in the 1980s and 1990s, indicating that the top 25% of countries in the interest-rate-growth differentials faced very high costs of serving their public debt. These countries include mostly Latin American states, experiencing debt crises and hyperinflation spells during the 1980s. In the mid-2000s, the differential dropped towards negative figures, but rose up again to the positive territory in the 2010s.
Figure 4 The interest-rate-growth differential (percentage points)
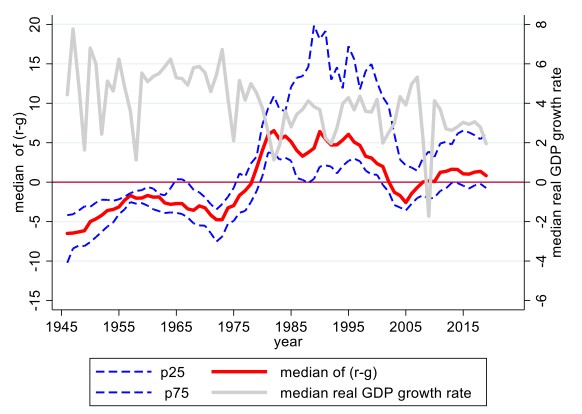
The grey solid line in in Figure 4 is the median growth rate of real GDP (in local currency), measured by the right scale. A casual observation is that there is a negative correlation between real output growth and the interest-rate-growth differential. Our empirical work validates that a rise in the cost of external debt would lead (with lags of two to three years) to output growth slowdown, and these effects add up, explaining the lost growth effects of Latin America and other emerging markets during 1980s. A faster rise in the flow cost of serving external debt has a negative impact on output growth, and this effect is dampened if the country experiences real appreciation. Consequently, US post-COVID exit policies reducing the odds of rapid increase in snowball effects may reduce future volatility, stabilizing and increasing the global growth rate.
The history of the US after WWII provides a vivid example of the success of a two-pronged approach in facilitating the exit from a public debt overhang, stabilising the global economy, and solidifying the global role of the dollar. The rapid decline in public debt/GDP from 1946 to 1955, exhibited in Figures 2 and 3, was accommodated by financial repression inducing lower r, mild inflation (~ 4.2%), higher taxes, and robust GDP growth (Aizenman and Marion 2011, Reinhart and Kirkegaard 2012, Reinhart and Sbrancia 2015, Reinhart et al. 2015). Figure 5 vividly shows the sharp drop of WWII US fiscal revenue mobilisation from 50% GDP points in 1944 towards 20% by 1946. Starting in 1947, this large revenue contraction was followed by an upwards trend, increasing the fiscal revenue/GDP to 35% in the 1970s. Remarkably, the US government was running mostly primary surpluses during that period (Figure 6). These policies supported solid economic growth, reducing the public debt/GDP from 106% in 1946 to 23% in 1974.
Figure 5 Total government spending and revenues as a % of GDP
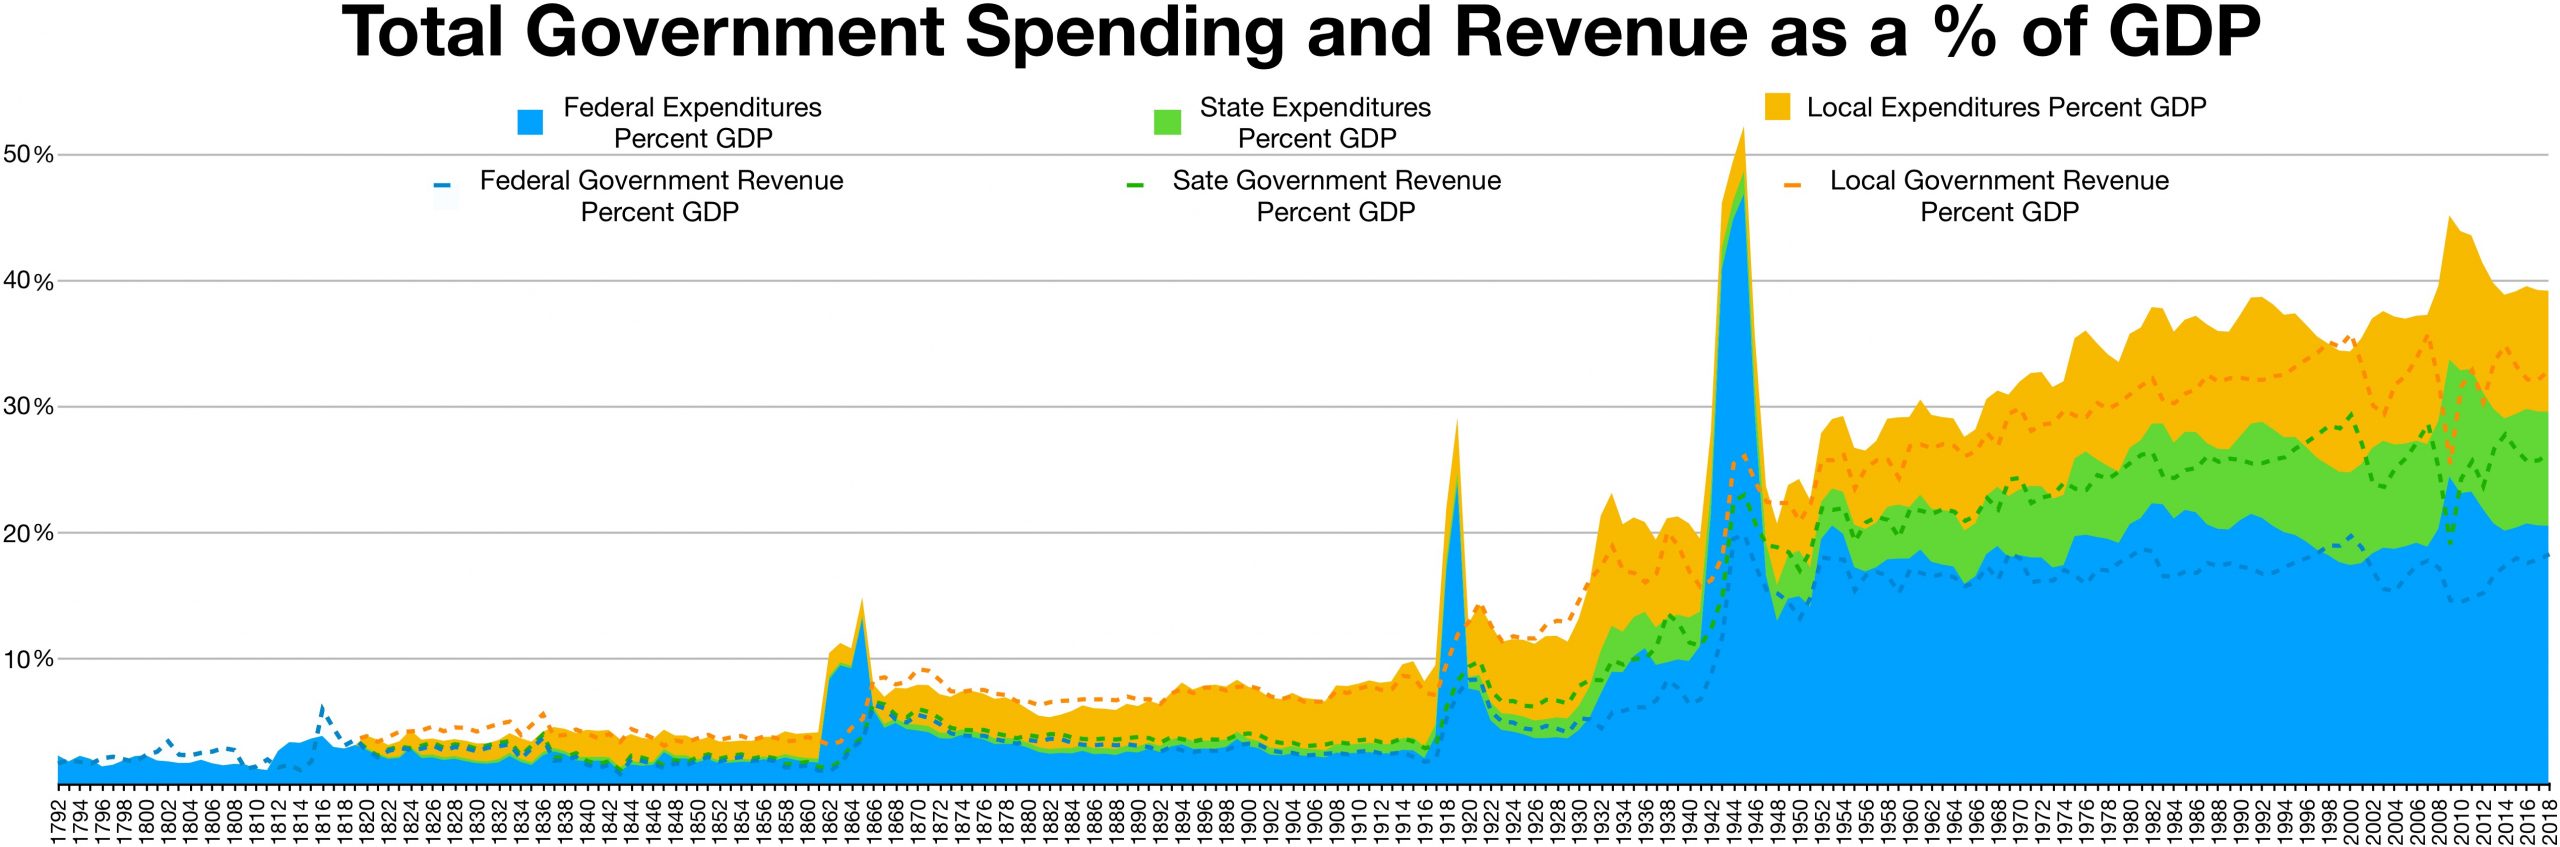
Figure 6 US fiscal surpluses/GDP after WWII
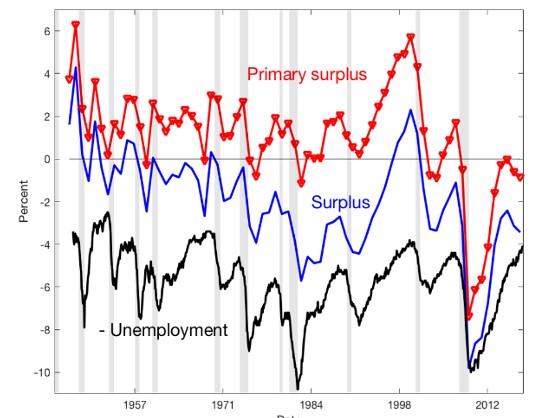
Source: Cochrane (2020)
This post-WWII success story illustrates the feasibility and gains from a two-pronged fiscal strategy. Looking forward, reallocation of fiscal spending from fighting COVID’s medical and economic challenges towards physical, medical, and social infrastructures may provide a welcome boost to future growth. With a lag, following the resumption of robust growth, increasing taxes and reaching a primary surplus may stabilize the US and the global economy. Such a trajectory may solidify the viability and credibility of the US dollar as a global anchor, thereby stabilizing emerging market economies and global growth.
9 novembre 2020
DANIELE SCHILIRÒ
COVID-19 Crisis and the Public Debt Issue: The Case of Italy.
Abstract: The COVID-19 pandemic has left the global economy with severe health damage, losses of life and a sharp recession. In addition, it has resulted in a rise of public debts, heightening the tension between meeting major policy goals, growth, employment, health system, environment and containing debt vulnerabilities. This paper examines the literature regarding the debt–growth nexus and the issue of debt sustainability. In particular, it highlights the evidence of some empirical literature showing that high public debt hampers growth, and that countries with high public debt are vulnerable to adverse shocks. In addition, the paper focuses on the case of Italy, a country characterized by a high public debt, low growth and other economic weaknesses, with the purpose to claim a strategy and indicate policy measures.
Keywords: COVID-19, crisis, public debt, growth, debt sustainability, Italian economy.
The COVID-19 epidemic has caused unprecedented global economic and financial turmoil, a significant recession in the global economy, an increase in healthcare spending, and continued uncertainty about the duration and depth of the crisis, which is reflected in its economic and financial management. Unfortunately, the pandemic is not over, and recovery is fragile and uneven among countries.
The COVID-19 pandemic marks a new paradigm. It is characterized by government borrowing, money-printing and intervention in capital markets in a low-inflation environment. By focusing on the increase in debt occurring in most countries, the article reviews the literature regarding the debt–growth-nexus and debt sustainability. The empirical literature produced non-conclusive results regarding a debt threshold above which growth is jeopardised by public debt. Some studies stressed the relevance of country-specific characteristics, contingencies and events that play a prominent role and significantly affect the the debt-growth relationship and its determinants. Also, a warning emerges from the analysis of the literature regarding the risks that a high debt entails. In fact, once the crisis is over and the recovery firmly sets in, keeping debt at high levels over the medium term is a source of vulnerability in itself.
In addition, the article explores the issue of debt sustainability and the extraordinary actions taken in the Eurozone by the European Commission and the European Central Bank (ECB) to counter the crisis. Then, it discusses the case of Italy, since a high public debt and low growth characterize the country.
Regarding the Italian public debt, the COVID-19 epidemic has further precipitated the precarious situations. “In May 2020, the debt peaked at € 2,530604 billion. Most likely, Italy will have around € 150 billion of new debt by the end of the year. As a result, per capita debt in 2020 will be € 42,000. However, the debt situation in the whole Eurozone is not good at all either. According to the European Commission, in the Eurozone, the debt-to-GDP ratio is projected to rise substantially, reaching a new peak of approximately 103% in 2020, before decreasing to below 100% in 2021. In Italy, in particular, the debt-to-GDP ratio will increase from 134.8% in 2019 to 158.0% at the end of 2020 and should decrease at the end of 2021. This is because the deficit in Italy should reach 10.8% in 2020, and then reduce to 5.6% in 2021, well above the threshold of 3%, thanks to the suspension of the SGP by the European Commission. In addition, Italy will receive an endowment from SURE of € 27.4 billion. Whereas, starting from 2021, Italy should receive from Next generation EU € 81.4 billion in non-repayable funds and € 127.6 billion in loans at almost zero interest and repayable in thirty years: € 209 billion in all.” (p.1855).
The article underlines that the main road to manage a high public debt is to boost growth. Therefore, it highlights several critical aspects of the Italian economy such as unproductive public spending, high tax evasion, a slow and complex bureaucracy, an aging population coupled with low birth rates, insufficient digitization, lack of skills in human capital, the economic gap between the Northern and Southern regions.
Although the ECB and the EU budget provide a policy response to the pandemic crisis avoiding financial instability and limiting any risk of sovereign default, also supporting the economy, the real crucial issue regarding growth and high public debt is that the Italian government should have a strategy to address the recovery and relaunch the economy in the medium to long term. In addition to the necessary strategy, the country must have the capability to manage efficiently all the factors that enable to make that strategy.
Among the possible actions to relaunch growth of Italian economy: focus on investments of capital goods with a high technological content, green investments, and investments in digitization; improve the efficiency of the public administration and simplify bureaucracy; reforme of the judicial system to speed up the resolution of disputes between companies and between public administration and businesses; strengthen the health system with investments in new technologies, adequate infrastructures and human capital; in the face of the problems related to structural change and the crisis of some sectors, seek solutions that tend to facilitate the reorganization of industrial sectors and, at the same time, by partly bearing the social costs of these processes; working on the debt component, because it is necessary to have the room for maneuver in the future that other countries have had.
Public spending can be positive for growth, especially when it is well spent, in targeted projects that improve the productivity of the country system and develop the skills among the new generations, and when it is complementary to private spending, particularly investments in R&D, innovation, and human resources. On top of that, Italy needs a challenging and bold plan that sees companies as protagonists with investments in strategic supply chain projects and that provide training of new skills.
Therefore, public debt sustainability, currently mainly ensured by the ECB through the PEPP, will largely depends on the ability to implement long-needed reforms and stimulate growth through a clear strategy. The opportunity of the EU Next Generation funds is unique. Getting out of the crisis depends on Italy’s ability to develop credible projects and reforms aimed at growth and at consolidating its debt to prevent the country from likely decline.
3 novembre 2020
JAY HYUN, DAISOON KIM, SEUNG-RYONG SHIN
Global connectedness and market power make firms more resilient to domestic COVID-19 shocks
(synthesis; full article: https://voxeu.org/article/income-inequality-and-welfare-state-during-covid-19)
Abstract: During periods of turmoil such as the Covid-19 pandemic, firms with more resilient business models tend to survive and expand more than others. This column presents evidence that firms with higher global connectedness and market power are more resilient to domestic pandemic shocks. While global production and export networks expose firms to foreign pandemic shocks, they potentially make firms less susceptible to domestic pandemic shocks through diversification of suppliers and markets. In addition, higher market power could provide buffers by allowing bigger margins of adjustment.
Keywords: COVID-19, domestic pandemic, border closures, lockdown policies, social distancing, business models, firm’s market value.
The recent COVID-19 pandemic has influenced our society in various ways. In particular, changes in business environments induced by border closures, lockdown policies, social distancing, and preference changes have generated a spike in uncertainty, significant disruptions in business, and a reallocation across firms (e.g. Baker et al. 2020, Barrero et al. 2020, Ding et al. 2020). During periods of such turmoil, firms with more resilient business models tend to survive and expand more than others, which leads to an important question of what characteristics of firms are vital in managing crises.
Our recent paper (Hyun et al. 2020) attempts to answer this question with particular emphasis on two firm characteristics — global connectedness and market power — which play central roles in the economics and finance literature, and have attracted a great deal of attention in the last decade.
Global integration: Necessarily bad during the pandemic?
The global economy has so far evolved toward integration through global value chains, trade, and migration, and there is now a consensus in the media and policy circles that global integration has exacerbated the negative impact of the pandemic crisis, both through the direct spread of the disease and through the disruption in foreign supply and demand.1 From a theoretical point of view, however, more globally connected firms via supply chains and exports could enjoy a more diversified portfolio of suppliers and markets, which would potentially allow them to buffer negative domestic shocks by making more flexible decisions in production and market management. Another firm characteristic, market power (which we measure through markup), could also make firms more resilient to negative shocks by providing bigger margins of adjustment and flexibility, as a large degree of markup implies that the firms’ products are not easily substituted for others, allowing the firms to adjust prices without a significant decline in demand.
Descriptive evidence: Firms with higher global connectedness and market power performed better in stock markets
Using a weekly global stock market dataset of covering 8,000 listed firms in 71 countries for the first five months of 2020, we investigate how pre-pandemic firm characteristics, including global connectedness and market power, affect firms’ stock market performances in response to the COVID-19 pandemic shock. We primarily focus on a firm’s market value, which equates to the present value of the expected future stream of profits (or dividends).2 Thus, changes in stock market value reflect investors’ information about firms’ current and future performances.
Figure 1 shows the evolution of the average market value of the US firms as a function of their degree of global connectedness (measured by foreign supplier share and export share) and market power (measured by markups).3 Specifically, we group firms separately across those in the top and bottom quantiles of markup, foreign supplier share, and export share distributions. Firms with higher markups and who are more globally integrated through supply chains and exports, differentially performed better compared to those with lower markups and who are less globally integrated. This descriptive exercise suggests that global production and export networks as well as markups potentially allow firms to be more resilient during crisis periods.
Figure 1 Changes in market values of different groups of firms
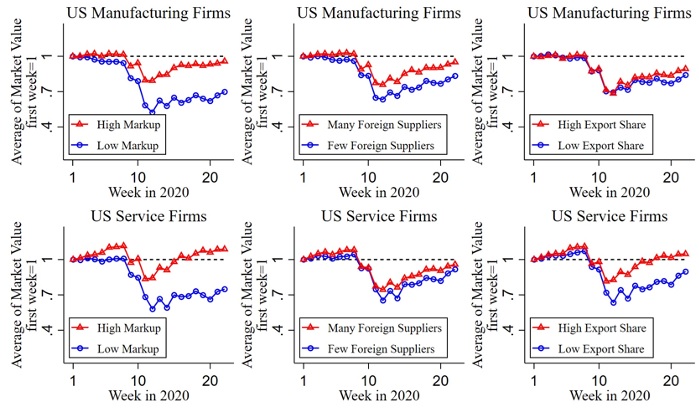
Notes. The figures plot the average market values of each group of firms over time, which are rebased to one for the first week. The manufacturing and service firms are classified by the Standard Industry Classification (SIC) codes 2000 – 3999 and 7000 – 8999, respectively. In each column, the red square and blue circle lines are the average market values of top and bottom quantile firms of each measurement of markups, foreign supply, and export networks, respectively.
Source. Hyun et al. (2020)
Regression analysis: Global connectedness and market power make firms more resilient to the domestic pandemic shock
We confirm our result using a formal regression analysis. Specifically, we regress a firm’s weekly market value growth on various explanatory variables, including the domestic pandemic shock measured by weekly growth rate in domestic total confirmed cases and its interaction with various pre-pandemic firm characteristics, including measures of global connectedness through global supply chains and exports, markups as a measure of market power, employment, and various financial conditions. We also control for measures of foreign pandemic shocks, any time-varying and time-invariant industry and/or country differences that might influence stock market reactions to the pandemic, as well as time-invariant unobserved firm characteristics.
Figure 2 visualises our main findings. We plot the estimated coefficients and their 95% confidence intervals of our main coefficients of interest by moving the terminal period from the tenth week (5 March) of 2020 to the 22nd week (28 May).4 First, consistent with widely accepted views, global supply chain and exports negatively affect firms’ market value by transmitting foreign pandemic shocks (the first row in Figure 2). However, we find a significant heterogeneous response to the domestic pandemic shock: firms with larger foreign supplier share, export share, and markup experience smaller decrease of weekly market value growth in reacting to the domestic pandemic shock. This result is consistent with the view that global connectedness and market power make firms more resilient to domestic shocks by diversifying the markets and suppliers and by providing more flexibility and margins of adjustment in response to negative shocks.5
Figure 2 Impacts of domestic and foreign COVID-19 shocks on firms’ market value
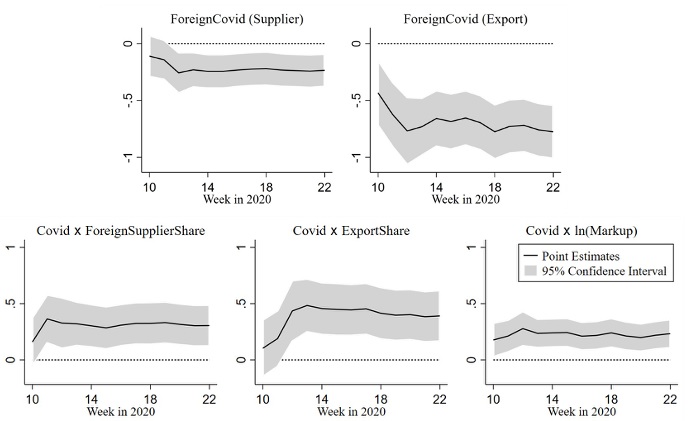
Notes. The figures plot the estimated coefficients and their 95% confidence interval with clustered standard errors at the firm level. The dependent variable is weekly growth rate of market value (in percent) of each firm. In the figure, ForeignCovid (Supplier) and ForeignCovid (Export) measure the foreign pandemic shocks exposed through foreign suppliers and exports, respectively. Covid is the domestic pandemic shock, ForeignSupplierShare and ExportShare measure the share of foreign suppliers among total number of suppliers and the share of revenue generated from foreign countries among total revenue, respectively, Markup is constructed from the firm’s cost minimisation.
Source. Hyun et al. (2020)
Concluding remarks
Using stock market data, we analyse which characteristics of firms allow them to be more resilient during the pandemic, highlighting the role of global networks and markups. This gives guidance to policymakers, investors, businesses, and workers to make optimal decisions facing large short-run and long-run changes and uncertainties during periods of crises.
A firm’s market value is the present value of the expected future stream of profits. Thus, our findings illuminate stock market investors’ information about the post-pandemic world.6 As a result of the pandemic, the cross-sectional distribution would be tilted toward high markup and more globally connected firms.
26 ottobre 2020
BARTHÉLÉMY BONADIO, ZHEN HUO, ANDREI LEVCHENKO, NITYA PANDALAI-NAYAR
The role of global supply chains in the COVID-19 pandemic and beyond
(synthesis; full article: https://voxeu.org/article/role-global-supply-chains-covid-19-pandemic-and-beyond)
Abstract: Lockdown disruptions to manufacturing and shipping transmit shocks across countries through global supply chains. This column uses a simulation analysis to quantify these impacts and finds that the transmission of foreign lockdowns accounted for one-third of the total Covid-19-related GDP contractions. However, renationalisation of global supply chains is unlikely to help insulate economies from future pandemic-driven lockdowns. The reason is that eliminating reliance on foreign inputs would increase the reliance on domestic inputs. Since a pandemic-related lockdown would also affect domestic input suppliers, there is generally no resilience benefit from renationalising international supply chains.
Keywords: COVID-19 pandemic, foreign lockdown, world economy, global supply chains
Global supply chains are a central feature of the world economy. As most countries enter Covid-19 related lockdowns, there are concerns about both the present and the future of global supply chains. In the present, global supply chains are widely believed to transmit the crisis across countries (Baldwin and Freeman 2020). The future is forecasted to bring about at least some renationalisation of the supply chains (Javorcik 2020). This retrenchment of supply chains could be given an impetus by protectionist and nationalist policies that may come in the wake of the pandemic (Baldwin and Evenett 2020).
Our recent paper (Bonadio et al. 2020) performs a quantitative assessment of the role of global supply chains in the pandemic. We address two questions.
- First, how much did foreign lockdowns contribute to coronavirus-related GDP contractions?
- Second, would renationalising global supply chains insulate countries from future epidemic-related contractions in labour supply?
The quantification model
We use a quantitative model of world production and trade covering 64 countries on six continents and 33 sectors spanning all economic activities. We parameterise the model using the OECD Inter-Country Input-Output (ICIO) Tables that provide matrices of domestic and international intermediate input and final use trade. We start by simulating a global lockdown as a contraction in labour supply. To discipline the size of the labour contraction, we use the Dingel and Neiman (2020) measure of the fraction of the work of different occupations that can be done at home. Variation across sectors in their usage of different occupations and of countries in their sectoral employment composition then results in heterogeneous incidence of the shock across countries. Countries also vary in the stringency of lockdown measures. To capture this, we interact the work from home intensity by occupation with an index capturing the country-level stringency from the Oxford Blavatnik School of Government Coronavirus Government Response Tracker (Hale et al. 2020).
Results
The blue-white combination bars in Figure 1 display the GDP drops across all countries predicted by our baseline model following the labour supply shock. The four panels group countries into geographical regions. The GDP reductions are dramatic, at -31.5% on average. There is a significant amount of dispersion, with GDP reductions ranging from -21% in Taiwan and Sweden (which famously imposed one of the most lenient lockdown policies) to -40% in Vietnam.
Figure 1 GDP responses to the pandemic-related labour supply shock
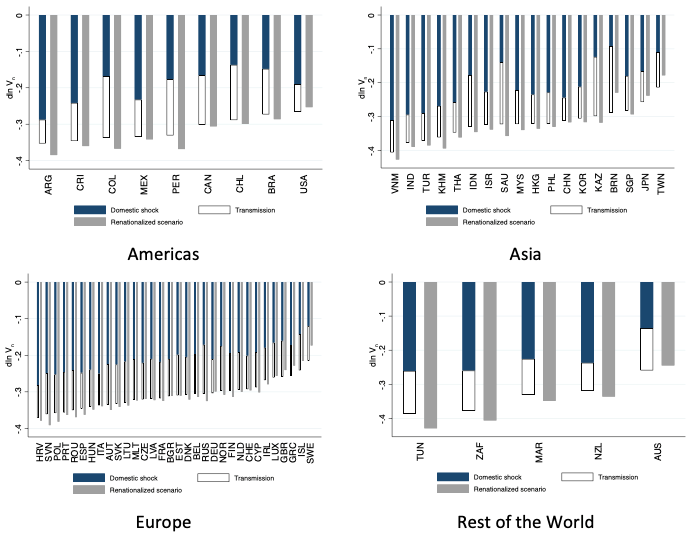
Our focus is on the role of the global supply chains in particular. Using the tools from Huo et al. (2020), we compute the share of each country’s GDP contraction that is due to foreign, rather than domestic, shocks. The white parts of the bars denote the contribution of foreign shocks. Foreign shocks transmitted through the global supply chains are responsible for a sizeable minority of the overall GDP contraction. The mean contribution of foreign shocks to the fall in GDP is about one third of the total. That is, an average country would experience an 11% GDP contraction purely due to the foreign lockdowns, even if it did not impose any lockdown on its own economy.
The economies with the largest foreign shock contributions (in proportional terms) are among those most tightly integrated into the global supply chains: Brunei, Kazakhstan, Saudi Arabia, Chile, and Colombia. Among these five countries, foreign shocks account for 57% of the total contraction on average.
Would supply chain repatriation have made a difference?
We next tackle the more substantive question of whether participation in global supply chains exacerbated or alleviated the pandemic-induced contraction in labour supply. It is not clear whether supply chain renationalisation will actually make GDP more resilient to future pandemic-type shocks. Figuring this out requires comparing the pandemic-induced GDP change in the baseline model to the pandemic-induced GDP change in an alternative world without international trade, where supply chains have adjusted to use only domestic inputs. Naturally, renationalisation of global supply chains would change the relative size of domestic sectors, as input users shift from foreign to domestic intermediates.
The answer is that by and large, severing global supply chains will not make countries more resilient to pandemic-style labour supply shocks. The grey bars in Figure 1 plot counterfactual declines in GDP for the same shock in a world where supply chains are domestic. It turns out that on average in our 64 countries, the downturn would actually be slightly worse with renationalised supply chains (-32.3% on average) than under current levels of trade. The intuition for this finding is simple: eliminating reliance on foreign inputs increases the reliance on domestic inputs. Since any national pandemic-related lockdown also affects domestic sectors, there is generally no resilience benefit from renationalising the international supply chains.
There is a modest distribution of differences around the average. In some countries, GDP would drop by four percentage points more if supply chains were renationalised, whereas in others GDP would fall by about four to six percentage points less. The cross-country variation is well-explained by differences in lockdown severity across countries. Some countries – most prominently Japan, Taiwan, Sweden, and Greece – imposed less stringent lockdowns in response to the pandemic shock. The domestic pandemic-induced shock is therefore smaller in these countries than the shock in their trading partners with more severe lockdowns. Separating from the global supply chains would make these countries more resilient to lockdowns by eliminating the transmission of the relatively larger shock from other countries. By contrast, a country with the most severe lockdown will reduce its own domestic labour supply by more than its average trading partner. In that case, the supply of the domestic intermediate inputs falls by more than the supply of foreign ones, and thus the GDP contraction is larger when supply chains are renationalised.
Another potential channel that may affect the benefits of supply chain renationalisation is a shift of the relative size of sectors within a country. All else equal, a country would be better off if renationalisation leads to expansion of sectors that are less exposed to negative labour supply shocks. A sector is less exposed to the pandemic-related lockdown if much of its labour input can be provided from home. Though plausible, we found that this channel is quantitatively less important compared to the aforementioned effect of shifting from foreign to domestic inputs.
Concluding remarks
All in all, our results show that global supply chains clearly transmit the economic effects of the lockdowns across borders. However, that does not mean that the presence of global supply chains uniformly exacerbates the downturn. Whether renationalising supply chains insulates a country from the pandemic depends on whether it plans to impose a more or less severe lockdown than its trading partners.
19 ottobre 2020
JAY HYUN, DAISOON KIM, SEUNG-RYONG SHIN
Global connectedness and market power make firms more resilient to domestic COVID-19 shocks
(synthesis; full article: https://voxeu.org/article/global-connectedness-market-power-and-firms-resilience-domestic-covid-19-shocks)
Abstract: During periods of turmoil such as the Covid-19 pandemic, firms with more resilient business models tend to survive and expand more than others.This column presents evidence that firms with higher global connectedness and market power are more resilient to domestic pandemic shocks. While global production and export networks expose firms to foreign pandemic shocks, they potentially make firms less susceptible to domestic pandemic shocks through diversification of suppliers and markets. In addition, higher market power could provide buffers by allowing bigger margins of adjustment.
Keywords: COVID-19 pandemic, global lockdown, business models, firms, markets.
The recent COVID-19 pandemic has influenced our society in various ways. In particular, changes in business environments induced by border closures, lockdown policies, social distancing, and preference changes have generated a spike in uncertainty, significant disruptions in business, and a reallocation across firms (e.g. Baker et al. 2020, Barrero et al. 2020, Ding et al. 2020). During periods of such turmoil, firms with more resilient business models tend to survive and expand more than others, which leads to an important question of what characteristics of firms are vital in managing crises.
Our recent paper (Hyun et al. 2020) attempts to answer this question with particular emphasis on two firm characteristics — global connectedness and market power — which play central roles in the economics and finance literature, and have attracted a great deal of attention in the last decade.
Global integration: Necessarily bad during the pandemic?
The global economy has so far evolved toward integration through global value chains, trade, and migration, and there is now a consensus in the media and policy circles that global integration has exacerbated the negative impact of the pandemic crisis, both through the direct spread of the disease and through the disruption in foreign supply and demand. From a theoretical point of view, however, more globally connected firms via supply chains and exports could enjoy a more diversified portfolio of suppliers and markets, which would potentially allow them to buffer negative domestic shocks by making more flexible decisions in production and market management. Another firm characteristic, market power (which we measure through markup), could also make firms more resilient to negative shocks by providing bigger margins of adjustment and flexibility, as a large degree of markup implies that the firms’ products are not easily substituted for others, allowing the firms to adjust prices without a significant decline in demand.
Descriptive evidence: Firms with higher global connectedness and market power performed better in stock markets
Using a weekly global stock market dataset of covering 8,000 listed firms in 71 countries for the first five months of 2020, we investigate how pre-pandemic firm characteristics, including global connectedness and market power, affect firms’ stock market performances in response to the COVID-19 pandemic shock. We primarily focus on a firm’s market value, which equates to the present value of the expected future stream of profits (or dividends). Thus, changes in stock market value reflect investors’ information about firms’ current and future performances.
Figure 1 shows the evolution of the average market value of the US firms as a function of their degree of global connectedness (measured by foreign supplier share and export share) and market power (measured by markups). Specifically, we group firms separately across those in the top and bottom quantiles of markup, foreign supplier share, and export share distributions. Firms with higher markups and who are more globally integrated through supply chains and exports, differentially performed better compared to those with lower markups and who are less globally integrated. This descriptive exercise suggests that global production and export networks as well as markups potentially allow firms to be more resilient during crisis periods.
Figure 1 Changes in market values of different groups of firms
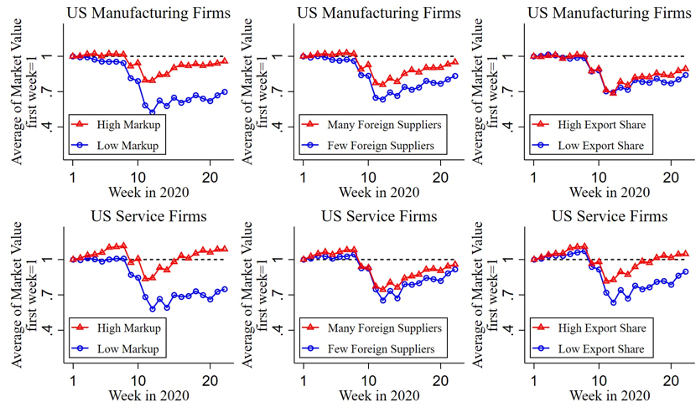
Notes. The figures plot the average market values of each group of firms over time, which are rebased to one for the first week. The manufacturing and service firms are classified by the Standard Industry Classification (SIC) codes 2000 – 3999 and 7000 – 8999, respectively. In each column, the red square and blue circle lines are the average market values of top and bottom quantile firms of each measurement of markups, foreign supply, and export networks, respectively.
Source. Hyun et al. (2020)
Regression analysis: Global connectedness and market power make firms more resilient to the domestic pandemic shock
We confirm our result using a formal regression analysis. Specifically, we regress a firm’s weekly market value growth on various explanatory variables, including the domestic pandemic shock measured by weekly growth rate in domestic total confirmed cases and its interaction with various pre-pandemic firm characteristics, including measures of global connectedness through global supply chains and exports, markups as a measure of market power, employment, and various financial conditions. We also control for measures of foreign pandemic shocks, any time-varying and time-invariant industry and/or country differences that might influence stock market reactions to the pandemic, as well as time-invariant unobserved firm characteristics.
Figure 2 visualises our main findings. We plot the estimated coefficients and their 95% confidence intervals of our main coefficients of interest by moving the terminal period from the tenth week (5 March) of 2020 to the 22nd week (28 May). First, consistent with widely accepted views, global supply chain and exports negatively affect firms’ market value by transmitting foreign pandemic shocks (the first row in Figure 2). However, we find a significant heterogeneous response to the domestic pandemic shock: firms with larger foreign supplier share, export share, and markup experience smaller decrease of weekly market value growth in reacting to the domestic pandemic shock. This result is consistent with the view that global connectedness and market power make firms more resilient to domestic shocks by diversifying the markets and suppliers and by providing more flexibility and margins of adjustment in response to negative shocks.
Figure 2 Impacts of domestic and foreign COVID-19 shocks on firms’ market value
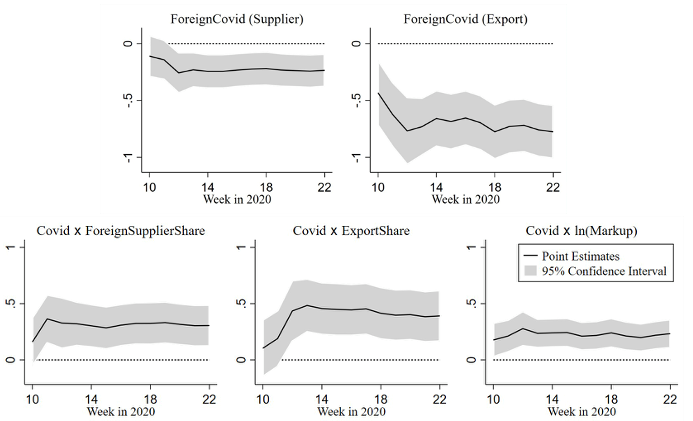
Notes. The figures plot the estimated coefficients and their 95% confidence interval with clustered standard errors at the firm level. The dependent variable is weekly growth rate of market value (in percent) of each firm. In the figure, ForeignCovid (Supplier) and ForeignCovid (Export) measure the foreign pandemic shocks exposed through foreign suppliers and exports, respectively. Covid is the domestic pandemic shock, ForeignSupplierShare and ExportShare measure the share of foreign suppliers among total number of suppliers and the share of revenue generated from foreign countries among total revenue, respectively, Markup is constructed from the firm’s cost minimisation.
Source. Hyun et al. (2020)
Concluding remarks
Using stock market data, we analyse which characteristics of firms allow them to be more resilient during the pandemic, highlighting the role of global networks and markups. This gives guidance to policymakers, investors, businesses, and workers to make optimal decisions facing large short-run and long-run changes and uncertainties during periods of crises.
A firm’s market value is the present value of the expected future stream of profits. Thus, our findings illuminate stock market investors’ information about the post-pandemic world. As a result of the pandemic, the cross-sectional distribution would be tilted toward high markup and more globally connected firms.
12 ottobre 2020
SIMON BURGESS, HANS HENRIK SIEVERTSEN
Schools, skills, and learning: The impact of COVID-19 on education
(synthesis; full article: https://voxeu.org/article/impact-covid-19-education)
Abstract: The global lockdown of education institutions is going to cause major (and likely unequal) interruption in students’ learning; disruptions in internal assessments; and the cancellation of public assessments for qualifications or their replacement by an inferior alternative. This column discusses what can be done to mitigate these negative impacts.
Keywords: COVID-19 pandemic, global lockdown, impacts on education, school, higher education.
The COVID-19 pandemic is first and foremost a health crisis. Many countries have (rightly) decided to close schools, colleges and universities. The crisis crystallises the dilemma policymakers are facing between closing schools (reducing contact and saving lives) and keeping them open (allowing workers to work and maintaining the economy). The severe short-term disruption is felt by many families around the world: home schooling is not only a massive shock to parents’ productivity, but also to children’s social life and learning. Teaching is moving online, on an untested and unprecedented scale. Student assessments are also moving online, with a lot of trial and error and uncertainty for everyone. Many assessments have simply been cancelled. Importantly, these interruptions will not just be a short-term issue, but can also have long-term consequences for the affected cohorts and are likely to increase inequality.
Impacts on education: Schools
Going to school is the best public policy tool available to raise skills. While school time can be fun and can raise social skills and social awareness, from an economic point of view the primary point of being in school is that it increases a child’s ability. Even a relatively short time in school does this; even a relatively short period of missed school will have consequences for skill growth. But can we estimate how much the COVID-19 interruption will affect learning? Not very precisely, as we are in a new world; but we can use other studies to get an order of magnitude.
Two pieces of evidence are useful. Carlsson et al. (2015) consider a situation in which young men in Sweden have differing number of days to prepare for important tests. These differences are conditionally random allowing the authors to estimate a causal effect of schooling on skills. The authors show that even just ten days of extra schooling significantly raises scores on tests of the use of knowledge (‘crystallized intelligence’) by 1% of a standard deviation. As an extremely rough measure of the impact of the current school closures, if we were to simply extrapolate those numbers, twelve weeks less schooling (i.e. 60 school days) implies a loss of 6% of a standard deviation, which is non-trivial. They do not find a significant impact on problem-solving skills (an example of ‘fluid intelligence’).
A different way into this question comes from Lavy (2015), who estimates the impact on learning of differences in instructional time across countries. Perhaps surprisingly, there are very substantial differences between countries in hours of teaching. For example, Lavy shows that total weekly hours of instruction in mathematics, language and science is 55% higher in Denmark than in Austria. These differences matter, causing significant differences in test score outcomes: one more hour per week over the school year in the main subjects increases test scores by around 6% of a standard deviation. In our case, the loss of perhaps 3-4 hours per week teaching in maths for 12 weeks may be similar in magnitude to the loss of an hour per week for 30 weeks. So, rather bizarrely and surely coincidentally, we end up with an estimated loss of around 6% of a standard deviation again. Leaving the close similarity aside, these studies possibly suggest a likely effect no greater than 10% of a standard deviation but definitely above zero.
Impacts on education: Families
Perhaps to the disappointment of some, children have not generally been sent home to play. The idea is that they continue their education at home, in the hope of not missing out too much.
Families are central to education and are widely agreed to provide major inputs into a child’s learning, as described by Bjorklund and Salvanes (2011). The current global-scale expansion in home schooling might at first thought be seen quite positively, as likely to be effective. But typically, this role is seen as a complement to the input from school. Parents supplement a child’s maths learning by practising counting or highlighting simple maths problems in everyday life; or they illuminate history lessons with trips to important monuments or museums. Being the prime driver of learning, even in conjunction with online materials, is a different question; and while many parents round the world do successfully school their children at home, this seems unlikely to generalise over the whole population.
So while global home schooling will surely produce some inspirational moments, some angry moments, some fun moments and some frustrated moments, it seems very unlikely that it will on average replace the learning lost from school. But the bigger point is this: there will likely be substantial disparities between families in the extent to which they can help their children learn. Key differences include (Oreopoulos et al. 2006) the amount of time available to devote to teaching, the non-cognitive skills of the parents, resources (for example, not everyone will have the kit to access the best online material), and also the amount of knowledge – it’s hard to help your child learn something that you may not understand yourself. Consequently, this episode will lead to an increase in the inequality of human capital growth for the affected cohorts.
Assessments
The closure of schools, colleges and universities not only interrupts the teaching for students around the world; the closure also coincides with a key assessment period and many exams have been postponed or cancelled.
Internal assessments are perhaps thought to be less important and many have been simply cancelled. But their point is to give information about the child’s progress for families and teachers. The loss of this information delays the recognition of both high potential and learning difficulties and can have harmful long-term consequences for the child. Andersen and Nielsen (2019) look at the consequence of a major IT crash in the testing system in Denmark. As a result of this, some children could not take the test. The authors find that participating in the test increased the score in a reading test two years later by 9% of a standard deviation , with similar effects in mathematics. These effects are largest for children from disadvantaged backgrounds.
Importantly, the lockdown of institutions not only affects internal assessments. In the UK, for example, all exams for the main public qualifications – GCSEs and A levels – have been cancelled for the entire cohort. Depending on the duration of the lockdown, we will likely observe similar actions around the world. One potential alternative for the cancelled assessments is to use ‘predicted grades’, but Murphy and Wyness (2020) show that these are often inaccurate, and that among high achieving students, the predicted grades for those from disadvantaged backgrounds are lower than those from more advantaged backgrounds. Another solution is to replace blind exams with teacher assessments. Evidence from various settings show systematic deviations between unblind and blind examinations, where the direction of the bias typically depends on whether the child belongs to a group that usually performs well (Burgess and Greaves 2013, Rangvid 2015). For example, if girls usually perform better in a subject, an unblind evaluation of a boy’s performance is likely to be downward biased. Because such assessments are used as a key qualification to enter higher education, the move to unblind subjective assessments can have potential long-term consequences for the equality of opportunity.
It is also possible that some students’ careers might benefit from the interruptions. For example, in Norway it has been decided that all 10th grade students will be awarded a high-school degree. And Maurin and McNally (2008) show that the 1968 abandoning of the normal examination procedures in France (following the student riots) led to positive long-term labour market consequences for the affected cohort.
In higher education many universities and colleges are replacing traditional exams with online assessment tools. This is a new area for both teachers and students, and assessments will likely have larger measurement error than usual. Research shows that employers use educational credentials such as degree classifications and grade point averages to sort applicants (Piopiunik et al. 2020). The increase in the noise of the applicants’ signals will therefore potentially reduce the matching efficiency for new graduates on the labour market, who might experience slower earnings growth and higher job separation rates. This is costly both to the individual and also to society as a whole (Fredriksson et al. 2018).
Graduates
The careers of this year’s university graduates may be severely affected by the COVID-19 pandemic. They have experienced major teaching interruptions in the final part of their studies, they are experiencing major interruptions in their assessments, and finally they are likely to graduate at the beginning of a major global recession. Evidence suggests that poor market conditions at labour market entry cause workers to accept lower paid jobs, and that this has permanent effects for the careers of some. Oreopoulos et al. (2012) show that graduates from programmes with high predicted earnings can compensate for their poor starting point through both within- and across-firm earnings gains, but graduates from other programmes have been found to experience permanent earnings losses from graduating in a recession.
Solutions?
The global lockdown of education institutions is going to cause major (and likely unequal) interruption in students’ learning; disruptions in internal assessments; and the cancellation of public assessments for qualifications or their replacement by an inferior alternative.
What can be done to mitigate these negative impacts? Schools need resources to rebuild the loss in learning, once they open again. How these resources are used, and how to target the children who were especially hard hit, is an open question. Given the evidence of the importance of assessments for learning, schools should also consider postponing rather than skipping internal assessments. For new graduates, policies should support their entry to the labour market to avoid longer unemployment periods.
5 ottobre 2020
ORIOL ASPACHS, RUBEN DURANTE, JOSÉ GARCÍA-MONTALVO, ALBERTO GRAZIANO, JOSEP MESTRES, MARTA REYNAL-QUEROL
Measuring income inequality and the impact of the welfare state during COVID-19: Evidence from bank data
(synthesis; full article: https://voxeu.org/article/income-inequality-and-welfare-state-during-covid-19)
Abstract: The economic crisis from the COVID-19 pandemic may disproportionately affect the most vulnerable segments of the population, creating serious challenges for social cohesion and political stability. This column constructs a high-frequency measure of income inequality using anonymised data from bank records on the wages and public transfers of over three million account holders in Spain. Wage inequality increased by almost 30% during the COVID-19 crisis, mainly due to job losses and wage cuts for low-income workers. However, public transfers were very effective at offsetting most, though not all, of this increase.
Keywords: COVID-19 pandemic, economic crisis, bank data, European economy, Wage Structure Survey
COVID-19 has taken a heavy toll on the European economy, particularly in southern countries like Italy and Spain, where GDP is expected to shrink by over 10% in 2020 (IMF 2020a, Bank of Spain 2020). A crucial concern is that the economic impact of the pandemic may disproportionately hit the most vulnerable segments of the population, leading to a surge in economic inequality with potential risks for social cohesion and political stability (Inglehart and Norris 2016). To mitigate the economic consequences of the pandemic, governments are investing vast resources to support families’ incomes and provide credit to firms (IMF 2020b, ILO 2020). Yet, how appropriate and effective these policies are remains unclear, mainly due to a lack of reliable indicators allowing the tracking of economic inequality at a high frequency. Indeed, most official statistics on income inequality are available only at a yearly frequency and often with long delays, limiting the ability of policymakers to rapidly adjust their responses.1
In a recent working paper (Aspachs et al. 2020), we propose a new methodology to track the evolution of income inequality at a high frequency using anonymised data from bank records including information on wages and subsidies paid to account holders. Our analysis focuses on Spain and uses data from CaixaBank – Spain’s second-largest bank by total assets and first by direct payroll deposits – which cover over three million retail depositors. Our sample includes all active account holders receiving payroll payments from a private or public employer and/or any government subsidy.2,3,4
The sample is highly representative of the Spanish working population. Figure 1 depicts the distribution of wages in our sample and the distribution of salaries (net of taxes and social security contributions) from the 2014 wave of the Wage Structure Survey (ESS), conducted by the Spanish National Institute of Statistics (INE).5 The similarity between the two distributions is remarkable.
Figure 1 Distribution of wages from bank records and of net salaries from the 2014 Wage Structure Survey
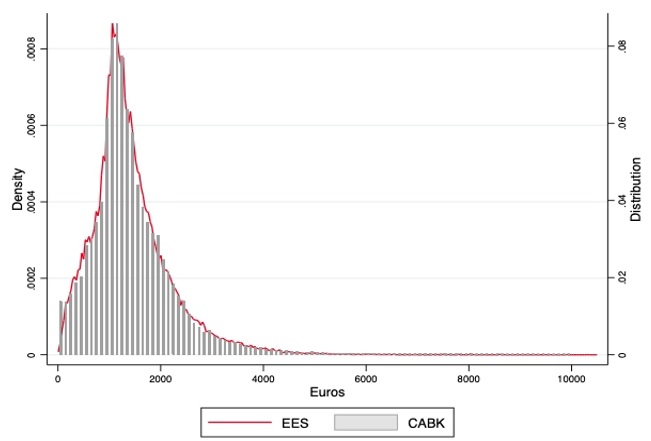
We first examine how wages changed for individuals with different pre-pandemic wage levels following the spread of the virus and the associated lockdown measures (enacted in mid-March). Figure 2 reports the distribution of individuals by the change in wages they experienced between February 2020 and April 2020, that is, between the last full pre-COVID month and the first full post-COVID month. Crucially, to separate the effect of the pandemic from normal wage fluctuations due to seasonality, we net out the difference recorded for people in the same wage level between April and February 2019.6 Hence, moving from left to right on the horizontal axis, we go from people who lost the most to people who gained the most between February and April 2020, relative to 2019. The top panels consider only the wages paid by employers, while the bottom panels consider both wages and government subsidies. The left panels report the distribution for the entire sample, while the right panels depicts the distribution separately for four different wage groups (as of February 2020): (i) people earning between €900 and €1,000 (25th percentile), (ii) between €1,200 and €1,300 (median), (iii) between €1,700 and €1,800 (75th percentile), and (iv) between €2,900 and €3,000 (95th percentile).
Figure 2 Distribution of income changes between February and April 2020 (relative to 2019) by income group
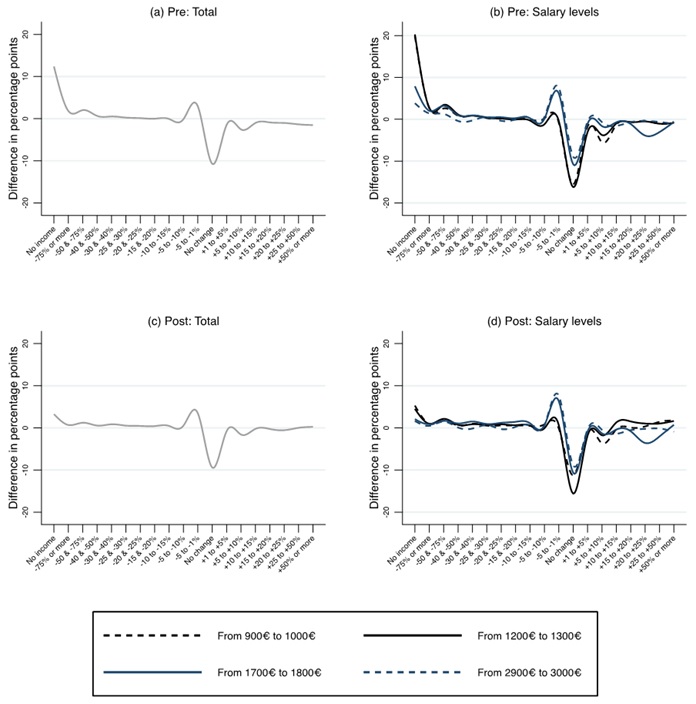
Several clear patterns emerge. First, a much higher share of individuals in the sample lost all of their wages between February and April 2020 than during the same period of 2019. This pattern is more pronounced for people in the lower wage brackets (+20%) than for those in the higher brackets (+8% and +3%). Second, a higher share of people experienced partial wage losses, either large (i.e. -50% to -75%) or small (-1% to -5%), with the latter situation being more frequent among people in the higher wage groups (+8% and +9%). Third, a much lower share of people, particularly in the lower wage groups, experienced wage increases between February and April of 2020 relative to the same period of 2019. Hence, the crisis was detrimental for the vast majority of wage earners but affected lower-income workers disproportionately.
To what extent did government intervention mitigate these dynamics? Looking at the bottom panels, it is clear that public transfers considerably reduced the share of people with no income. This is the case for all groups but especially for those with lower wages. Government intervention also alleviated the situation of those having lost a large part of their income, but not of those having experienced small losses, whose share remains remarkably stable between the pre-transfer and the post-transfer distribution. Finally, public transfers reduced the share of people having foregone wage increases relative to 2019, and, for some groups, even increased the share of those who experienced a moderate or large net increase in wage relative to the previous year.
We then analyse how income inequality evolved over the course of the crisis. To this end, in Figure 3, we plot the Gini index for each month between February and May 2020 (right panel) and for the same months of 2019 (left), for both the pre-transfer (blue line) and the post-transfer distribution (red). While the Gini index in February 2020 was virtually the same as in February 2019 (both pre-transfer and post-transfer), income inequality increased sharply in March, and even more so in April and May when the Gini index was about ten points higher than in February. This represents an unprecedented increase of about 25% in just two months, roughly corresponding to the difference between Germany and the US as of 2016 (World Bank 2020).
Government intervention was quite effective at containing the spike in inequality. Indeed, while the post-transfer Gini index is usually lower than pre-transfer Gini index by about five points, this difference reached 13 points in both April and May 2020, offsetting most, though not all, of the increase in pre-transfer inequality. Government action was somewhat less effective in March, when the post-transfer Gini index reached its peak, about three points higher than in the same month of 2019. This was arguably due to the delay in the disbursement of subsidy and unemployment benefit pay-outs in the early stage of the crisis, which temporarily left some of the most vulnerable workers without a safety net.7
Figure 3 Evolution of the Gini index for pre-transfer and post-transfer incomes (February-May 2019 and 2020)
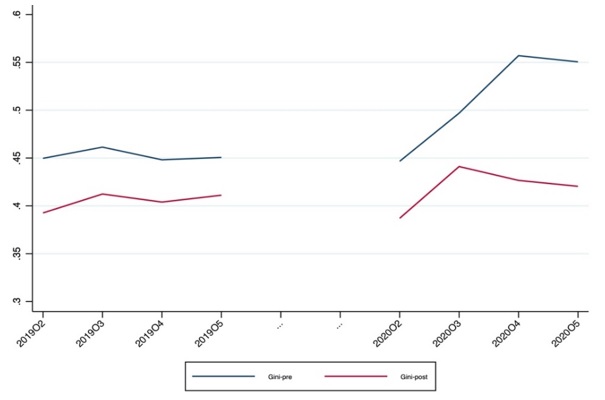
Finally, we examine how the effect of the crisis on income inequality varied across different areas of the country. To this end, in Figure 4 we report the change in the Gini index between February and April 2020 separately for the sixteen regions of Spain. The results suggest that, though income inequality increased considerably in all regions, the rise was especially strong in regions – such as Balearic and Canary Islands – that rely heavily on tourism, one of the sectors most affected by the pandemic and the lockdown.
Figure 4 Change in the Gini index between February and May 2020 by region
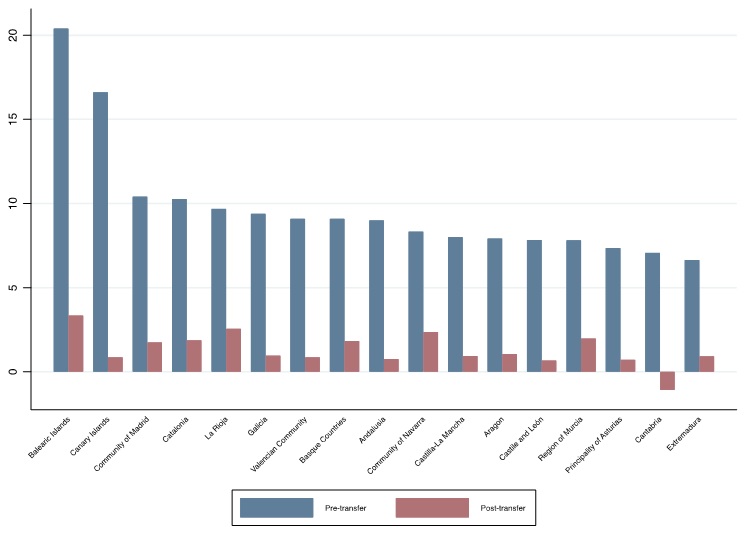
Concluding remarks
Our results document that the COVID-19 pandemic, and the measures adopted to face it, led to a massive increase in income inequality in Spain, primarily driven by job losses and wage cuts for low-income workers. They also indicate that, despite an initial delay, government transfers were effective at containing this increase, reducing inequality to levels not too distant from the pre-pandemic ones. Though reassuring of the ability of the welfare state to cope with such extreme situations, this finding generates some concerns for how things may evolve should the intensity of government intervention decline due to budgetary reasons before the health emergency has ceased. From a methodological perspective, our analysis provides the first example of how banking data can be used to track income inequality at a high frequency. More generally, and in line with other recent experiences (Bick and Blandin 2020, Chetty et al. 2020, Cicala 2020), it illustrates how big data from private sources can be harnessed to better understand the fast changes the economy is undergoing and to inform effective policymaking.
29 settembre 2020
JUAN C. PALOMINO, JUAN GABRIEL RODRÍGUEZ, RAQUEL SEBASTIAN
Inequality and poverty effects of the lockdown in Europe
(synthesis; full article: https://voxeu.org/article/inequality-and-poverty-effects-lockdown-europe)
Abstract: Enforced social distancing and lockdown measures to contain COVID-19 restrict economic activity, especially among workers in non-essential jobs who cannot ‘telework’. These have implications for inequality and poverty. This column analyses the capacity of individuals in 29 European countries to work under lockdown and the potential impact of a two-month lockdown on wages and inequality levels. There will be substantial and uneven wage losses across the board and poverty will rise. Inequality within countries will worsen, as it will between countries although to a lesser extent.
Keywords: COVID-19, lockdown, inequality, poverty, telework
The economic impact of COVID-19 is dramatic. The global economy is expected to shrink by 3% this year. Asia will not have economic growth for the first time in 60 years, the US and European economies are projected to contract between 6% and 8% (International Monetary Fund 2020), and global job losses are estimated to be over 200 million (International Labour Organization 2020).
The economic effects of the pandemic, however, will not be equally distributed (Dorn et al. 2020, McKibbin and Fernando 2020) and are likely to have distributional implications (Furceri et al. 2020, Lustig and Mariscal 2020).
Our findings strongly support this statement (Palomino et al. 2020). We estimate that the burden of the pandemic will be disproportionately borne by low-wage earners which, in the absence of compensating policies, will significantly increase poverty and inequality across Europe.
The lockdown and partial closure of economic activities were crucial to stop the pandemic and save lives, but their economic effects are likely to diminish economic cohesion between and within European countries.
Teleworking and lockdown ability to work in Europe
Even without considering the subsequent effects that may occur on the demand side (del Rio-Chanona et al. 2020), the lockdown and social distancing imposed by governments to limit the spread of COVID-19 have direct asymmetric effects on the labour market: in principle, only the jobs that can be done from home (‘teleworkable’) are unimpeded by the lockdown. Some occupations like health services and food sales are considered essential, so workers are not affected by their capacity to work from home. Meanwhile, certain economic activities like hospitality are closed under a lockdown and working is not at all possible.
To measure the capability of each worker to keep active under the lockdown, we calculate a ‘lockdown working ability’ index of workers (see Palomino et al. 2020). This measure takes into account the level of teleworking for each occupation (Dingel and Neiman 2020) and whether the occupation is considered essential or closed.
As shown in Figure 1, the average lockdown working ability index varies significantly across European countries with the Netherlands (0.61) the best prepared and Bulgaria (0.37) the worst prepared.
Figure 1 Lockdown working ability index across Europe
In Table 1 we highlight that our index varies significantly not only by country but also by: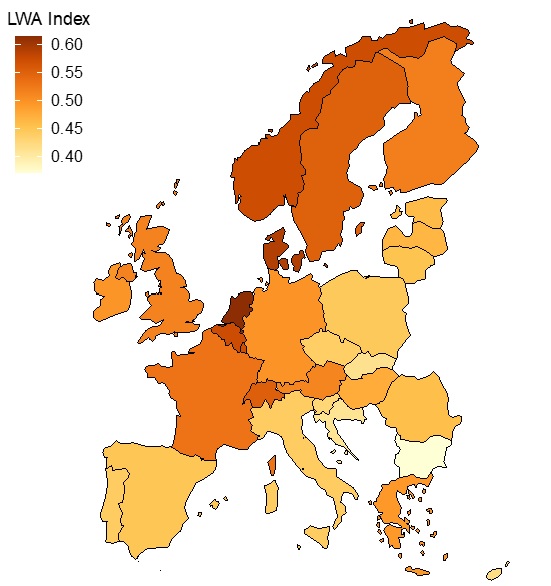
- Gender: Women are less affected by social distancing than men.
- Type of job: Temporary and part-time workers are in general worse-prepared than their permanent and full-time counterparts.
- Education: There is a strong positive relationship between the level of education and the capacity to work under a lockdown in all European countries.
Teleworking capability is strongly correlated with higher wages both across occupations and across average levels by country (r = 0.76). However, the correlation between the lockdown working ability index and the average annual salary in a country is positive but very small (0.06).
Once essential and closed occupations are taken into consideration, the changes in wage inequality caused by the lockdown are difficult to foresee based only on the average level of ability to work under lockdown, and one needs to look at how potential wage losses are distributed.
Table 1 Lockdown working ability in Europe
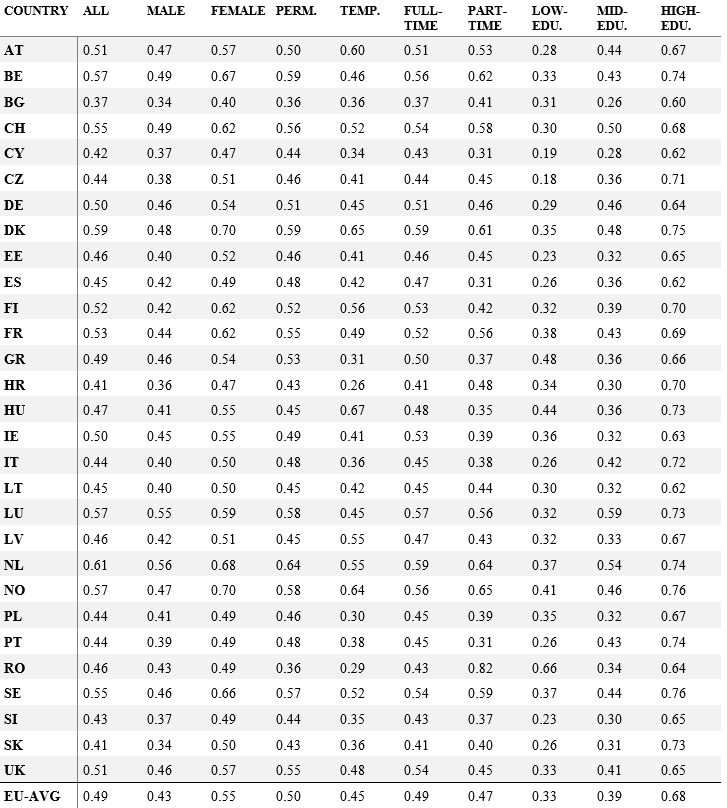
Wage losses and lockdown incidence curves
Because not all workers are able to perform their job at home and some activities are closed, there will be potential wage losses for a significant part of the labour force that cannot fully work during the lockdown.
To simulate these wage losses, we consider several possible scenarios. Here, we show the results for (i) two months of lockdown and (ii) two months of lockdown plus six additional months of de-escalation with only partial functioning of the closed activities (80% of capacity).
Although each European country may have followed slightly different lockdown and de-escalation strategies, we simulate the same scenarios for all countries to ensure that differences across countries are exclusively due to their productive structure.
After ordering workers by wage centiles, we represent the relative change in their wage in ‘lockdown incidence curves’ (Figure 2), which makes it easy to appreciate which part of the wage distribution (low, middle, high) suffers the largest relative wage losses.
For a lockdown of two months, wage losses are sizeable across the wage distribution but vary significantly with the centile, being above 10% (of the annual salary) at certain percentiles in some countries.
Figure 2 Lockdown incidence curves in Europe (two months of lockdown)
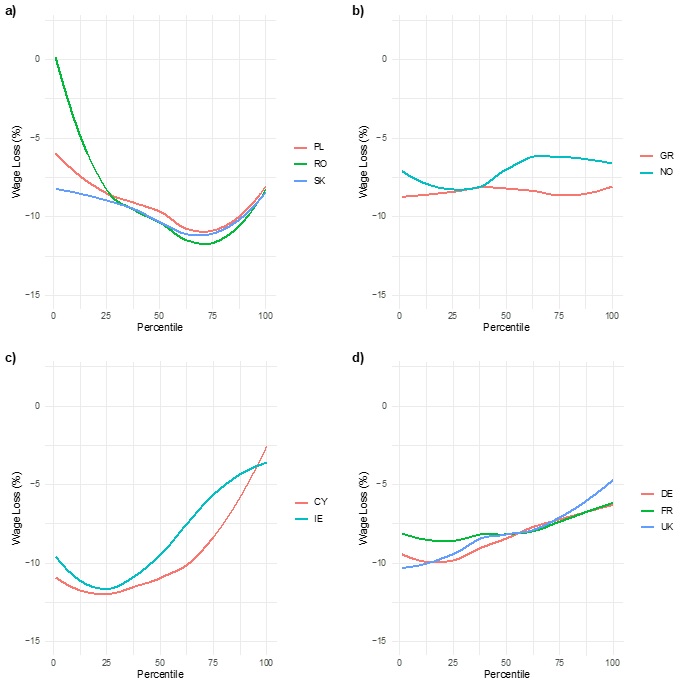
Notes: The four panels show lockdown incidence curves (wage distribution versus wage loss, two-month lockdown scenario) for different groups of countries with similar curves.
As noted above, there is no straightforward relationship between the average wage of a country and its distribution of wage losses. Thus, we observe that the distribution of wage losses is similar for Norway and Greece (panel b), and Ireland and Cyprus (panel c), despite the fact that these countries have significantly different average wages.
Changes in poverty and wage inequality
The lockdown increases poverty in all countries. First, we find a 10.0% mean loss rate (P) for poor workers − those below 60% of the median wage − for the average of European countries under a lockdown of two months. This mean loss rate for poor workers goes up to 22.5% when an additional 6-month period with partial functioning of closed activities is considered. The mean loss rates are also sizeable by country (Table 2).
Second, the proportion of poor workers (headcount index, H) increases significantly for all European countries. The average increase is 4.9 percentage points under two months of lockdown and 14.5 percentage points with an additional partial closure period of six months.
These values imply that − in the absence of counteracting government measures − the percentage of poor people in Europe may substantially increase, even if lockdown does not last long.
By country, under the two-month lockdown scenario, we find the highest increase in poverty in Croatia by the headcount index, and the smallest increase in Switzerland.
When comparing wage inequality after the lockdown with the baseline, we observe that inequality increases in all European countries (Table 2). The countries with the lowest increases in the Gini coefficient under a two-month lockdown are the Netherlands (2.2%), Norway (2.3%), France (2.3%), Switzerland (2.6%), and Germany (2.6%). On the other extreme of the spectrum, we find Cyprus (4.9%), Czechia (4.8%), Hungary (4.7%), Slovenia (4.7%), and Slovakia (4.6%).
With an additional six-month period during which closed activities are functioning at 80%, the countries with the lowest increases in the Gini coefficient are Denmark (9.5%), France (9.9%), the Netherlands (10.5%), the UK (10.8%), and Germany (10.9%). Countries with the highest increases are Slovakia (21.2%), Cyprus (20.0%), Hungary (19.6%), Czechia (16.0%), and Slovenia (15.9%).
Table 2 Poverty and inequality changes in Europe
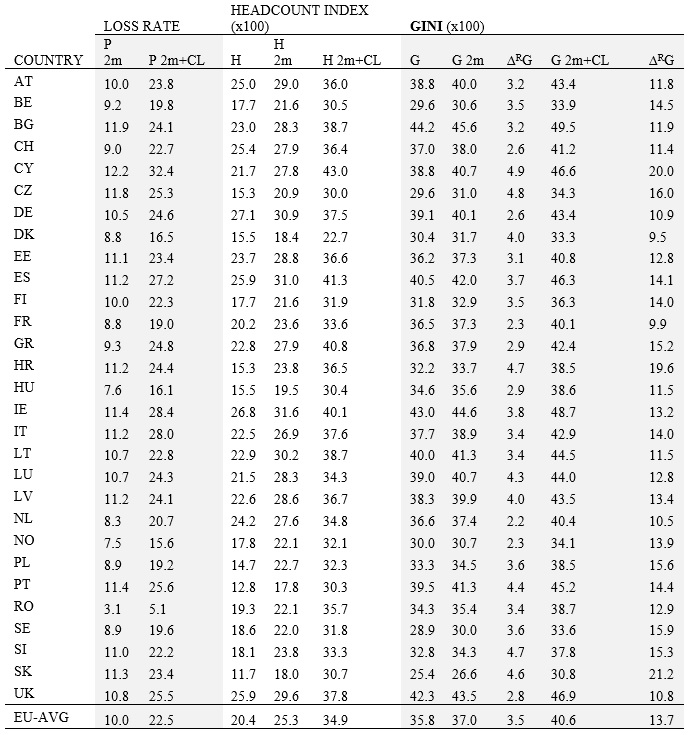
Notes: P is the mean loss rate for the poor, H is the headcount index, and G is the Gini inequality index. CL is partial closure, while 2m refers to 2 months. ∆RG is the relative change in the Gini index.
Finally, wage inequality both within and between European countries increase under a two-month lockdown, but inequality of wages inside countries increases more (5.04%) than inequality between countries (2.44%). Countries’ average wages diverge with the lockdown, although the main change in wage inequality happens within (not between) European countries.
In sum, our analysis reveals that the lockdown and de-escalation periods will potentially increase poverty and inequality sizeably in all European countries, even without accounting for second-round effects. Given that early relaxation of containment measures could have devastating effects for the health of citizens, we advocate for public policies that alleviate the distributional consequences that the lockdown may otherwise have.
21 settembre 2020
CHRISTOPHER ADAM, MARK HENSTRIDGE, STEVAN LEE
The impact of global economic disruption is as big a threat to low-income countries as the direct effects of COVID-19
(full article – VoxEu CEPR 08 September 2020 – : https://voxeu.org/article/impact-global-economic-disruption-big-threat-low-income-countries-direct-effects-covid-19)
Abstract: The small open economies of sub-Saharan Africa are substantially constrained in their ability to respond to the COVID-19 shock through fiscal adjustment. The scale of contraction in external demand, combined with limited fiscal space, means that without substantial external support, feasible policy packages in many of these countries translate to austerity programmes. This column uses a dynamic general equilibrium model calibrated to data from Uganda to characterise the macroeconomics of the pandemic and its aftermath in sub-Saharan Africa. It finds that the recovery depends significantly on how the public finances are restored to sustainability, and may be accelerated with external support.
Keywords: Covid-19, Development, Global Economy, Low-income countries
The COVID-19 pandemic has not erupted across Africa with the ferocity it has elsewhere, at least not yet. Recorded COVID-19 deaths across the continent stood at around 25,000 by mid-August 2020, with approximately half of these recorded in South Africa. This is around 3% of global fatalities while Africa accounts for 17% of global population – although there are concerns about underreporting of cases and fatalities.
But the economic effects of the pandemic are already widespread and disproportionate to the public health impact. This reflects the rapid and aggressive implementation of lock-down measures across most of sub Saharan Africa, from as early as the second week in March (Hale et al. 2020). These have had a direct impact on economies, curtailing economic activity, forcing businesses to operate at inefficient scale: lockdowns are a significant supply shock (Brinca et al. 2020). Subsequently, they reduce domestic demand and further squeeze tax revenues just when governments are seeking to increase spending on health and social protection.
The bigger part of the economic hit, however, comes from the effects of the sharp contraction in global economic activity. The collapse in key commodity prices, most notably oil and minerals (although not gold); the effective closure of key export service sectors, including tourism; the sudden stops to new debt and FDI flows; and the drying-up of remittance flows constitute an external demand shock that is both unprecedented in scale (at least outside situations of outright conflict) and is highly correlated across countries. As many commentators have noted, without a significant and coordinated international response the depth and likely duration of this shock puts at risk the development gains achieved by many African countries over the last 20 years.
The small open economies of sub-Saharan Africa cannot ‘do whatever it takes’: their capacity for fiscal adjustment – to support private absorption and welfare while still delivering critical public services and sustaining public investment – is highly constrained. And the scope for monetary policy to offset the domestic demand shock is limited and ineffective in the face of the international demand shock. In advanced economies, governments and central banks have used their balance sheets to support unprecedented stimulus programmes, which by early June 2020 were estimated by the IMF to be approaching US$ 10 trillion (Battersby et al. 2020). In addition to meeting the direct costs of tackling the pandemic, fiscal deficits have increased very sharply to provide transfers to firms and household, labour furlough schemes, debt forbearance, tax holidays, and other forms of relief.
In contrast, for countries where domestic borrowing capacity is highly limited and access to external markets is either impossible or prohibitively expensive, the fiscal tide flows in the opposite direction. While governments and central banks have moved decisively to ring-fence direct public health expenditures, to offer tax relief and to loosen monetary policy where possible, these measures are modest at best and funded in part by cuts elsewhere in public expenditures, most notably in public investment. The scale of the contraction in external demand combined with limited fiscal space means that without substantial external support, feasible policy packages in many sub-Saharan countries look much more like austerity programmes than the Keynesian stimulus seen elsewhere in the world.
Our recent paper (Adam et al. 2020) uses a dynamic general equilibrium numerical simulation model to characterise the macroeconomics of the pandemic and its aftermath in sub-Saharan Africa. Calibrating the model to baseline data from Uganda and using emerging evidence on the severity of the global economic recession, we simulate the economic impact of the pandemic (the vertical bars) and how these paths are affected under alternative national and international policy responses (the lines).
Figure 1 The impact of the pandemic and paths to recovery
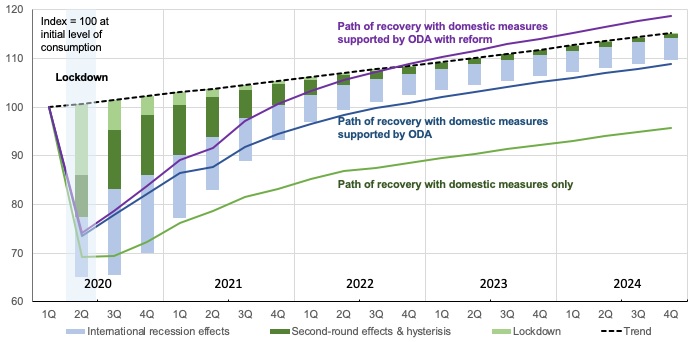
Source: Adam et al. (2020). DOI: 10.1093/oxrep/graa023
With so much of the impact coming from the effect of the global slowdown on countries’ import capacity, the hit on consumption is substantially larger and more persistent than the effect of lockdown on domestic production and spending (Figure 1). Recovery depends on how the public finances are restored to sustainability. Even if politically feasible, raising taxes and cutting spending makes for a slow private sector recovery, especially if spending cuts fall on public investment and the maintenance of the public capital stock. This is particularly so in environments where tax systems are narrowly based and plagued by ‘leakages’ and exemptions. In such circumstances there are no easy public policy options.
If Official Development Assistance (ODA) supports domestic fiscal adjustment, the recovery may be accelerated. External finance widens fiscal space, so that domestic policy choices are less awful; it relieves the need to raise distorting taxes and cut productive spending. We calculate that a net increase in ODA of US$40-50bn would substantially ease the domestic adjustment challenge, even if this level of support cannot fully protect private incomes and expenditures, which matches recent estimates from the Director of the African Department at the IMF (Selassie 2020). Recovery would be further hastened if governments are able to take advantage of disruptive economic conditions to accelerate reforms designed to strengthen systems for tax collection and public spending.
External finance at this scale is significant but not unprecedented, either in the context of sub-Saharan Africa, being comparable to the HIPC (heavily indebted poor countries) debt relief programme in the mid-2000s, or in comparison to the approximately US$10 trillion that advanced economy governments have deployed to protect their own economies. To date, however, even though the IMF and World Bank have moved quickly to support many low-income countries, the response of the advanced economies remains muted.
There appears to be little appetite for a sustained coordinated effort amongst the leading economies to support adjustment in the LICs (McKibben and Vines 2020). This is short-sighted and contrary to appeals for action to the G20 (Berglof et al. 2020). The case for increased support can be based as much on national self-interest as on the moral and developmental arguments that hinge on growth and poverty reduction, especially at the bottom of the income distribution. There is a clear imperative to conquer the COVID-19 pandemic at a global scale so that it does not rip through the OECD again. Moreover, there is potential scope to ‘build back better’ with public investment that contributes to reduced carbon emissions, and supports economies to make the most of the potential demographic dividend offered by a youthful labour force across sub-Saharan Africa.
14 settembre 2020
GIOVANNI BUSETTA, MARIA GABRIELLA CAMPOLO, DEMETRIO PANARELLO
COVID-19 lethality in Italian regions: underestimation of positive cases or lack of sanitary structures?
Abstract The lethality rate associated with the new Coronavirus SARS-CoV-2 in Italy is currently one of the highest in the world. Lethality rate that many analyses claim is unreal. While the verification of the positive effects could lower the lethality rate, analyzing the way in which the pandemic has been tackled at hospital level could give a more complete view of the phenomenon.
Key words: COVID-19, intensive care, lethality rate, SARS-CoV-2, swabs.
The lethality rate obtained from Italian data was, at the 30th of March, the highest in the world (11.4%). However, the apparent lethality rate (Case Fatality Rate, CFR) is very different from the real one (Infection Fatality Rate, IFR), which an analysis performed in February (Verity et al., 2020) estimated for China at 0.66%. It can be argued that the CFR, calculated by dividing the cases confirmed by the swabs over the number of deaths caused by the SARS-CoV-2 virus, is an unrealistic index of the lethality of the new Coronavirus, which is therefore overestimated. The Imperial College COVID-19 Response Team (Flaxman et al., 2020) estimated that the real number of people infected by the virus in Italy, at March 28th, was as many as 5.9 million (9.8% of the national population). Even if we consider that the real number of deaths is plausibly higher than the declared one, the real lethality rate could thus approach a more truthful threshold compared to the official rate. It is not realistic, however, to believe the real Italian lethality rate to be similar to the one estimated for China: the disease is lethal especially for older people who, in Italy, represent a much more substantial strand of the population than the Chinese one.
When an infected person is found, a good practice would be to buffer all the people with whom the infected individual has recently been in contact, even if they apparently do not show any symptoms attributable to COVID-19. Starting from this assumption, we would expect that in the most efficient regions (id est, the regions that adopt a more accurate plan for the administration of the swabs) the number of positive cases “tracked down”, following the swabs, is not particularly high. On the contrary, in the less efficient regions, only the most serious cases are expected to undergo swabs and, therefore, a very high number of swabs should give positive results.
Low-lethality regions are found in all the macroareas of the country (see Figure 1).
Figure 1 – Average lethality by region
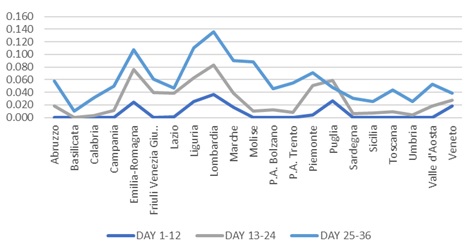
Reports on positive cases and deaths are published on a daily basis. In the ideal case, from the moment of the onset of symptoms, people should be immediately subjected to a swab and be included in the calculation of positive cases, at most, within the report of the following day. The median time that goes from the onset of symptoms to hospitalization has been estimated by the “Istituto Superiore di Sanità” in 4 days; from hospitalization to death, the median is also 4 days. Therefore, we estimate that the deaths of a certain day are attributable to the positive cases confirmed 7 days before. Looking at the following graph (Figure 2), we can see that some regions (Lombardy, Lazio, Liguria, Marche) had to face the emergency with an excessive number of serious cases, which required not only the hospitalization of the positive patient, but even intensive care, bringing hospitals to the limit. By crossing these data with the lethality rates shown in the previous graph (Figure 1), it can be observed that, in the initial period, the lethality of the regions initially affected does not seem to differ much from the one observed in the rest of the country in the two subsequent periods.
Figure 2 – Positive cases in Intensive Care over Positive cases
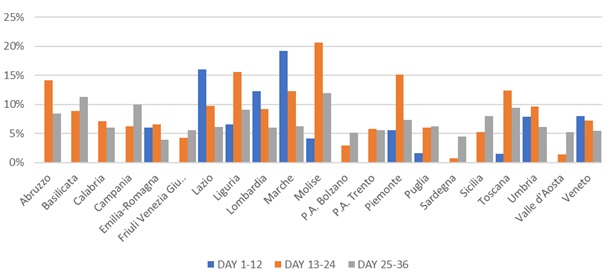
At any time, the reported lethality rate should ideally be lower than the real one, as the share of new positives cases should be updated about 7 days later. In the central-northern regions, where the first cases of COVID-19 emerged many days earlier than in the South and which show a higher daily increase in positive cases, the lethality rate should therefore be lower.
However, the trend in the lethality rate shows a growing drift in all Italian regions, indicating that the contagions are estimated with less accuracy day by day, as the contagion becomes more widespread: this is an effect of sampling, given that, when there are fewer infected subjects, it is easier to trace them more precisely, considering the maximum limit of swabs that can be made daily.
Figure 3 – Intensive care over total cases
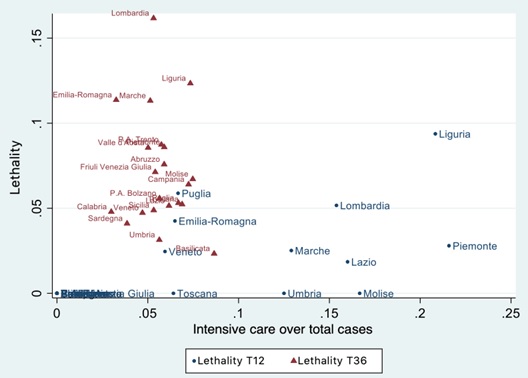
The Intensive care beds needed by each region are calculated from the estimated number of infected people in the region. As can be seen from the previous graph (Figure 3), the lethality rate seems to be relatively low in the first 12 days from the onset of the pandemic crisis, while in the last 12 days (T36 = starting from the 25th day and up to the 36th) the relationship between the lethality rate and the share of patients admitted to intensive care over the amount of positive cases is inversely proportional. On the one hand, at this point one might wonder whether the high lethality rate in some regions may depend on the high number of patients who may need intensive care but are not able to access it, or on an incorrect estimate of the real number of infected people. On the other hand, the lethality rate depends on the number of infected people. As it is not possible to have a real estimate of COVID-19 positive patients, it seems that the estimated lethality rate is higher than the real one. For this reason, we are going to check one last relationship: the one between the lethality rate and the number of positive patients calculated over the number of swabs performed (Figure 4).
Figure 4 – Positive cases over number of swabs
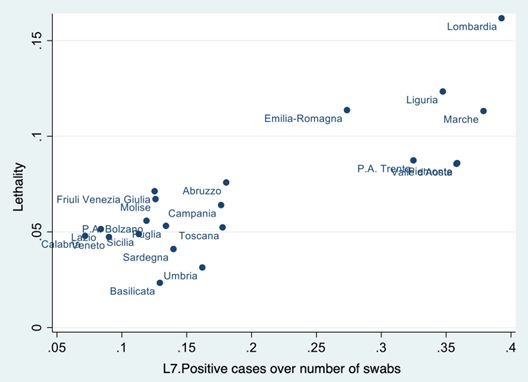
As the ratio between positive cases and number of swabs increases, the lethality rate should increase about 7 days after the publication of the result of the swab (Figure 4). Since a low number of positive cases with respect to the swabs carried out denotes a sunburst investigation around each positive case detected, the correlation between this and low lethality levels indicates an estimate of the infected people that does not deviate excessively from the real one.
If the number of real positive cases is massively greater than the official number, the intensive care beds will be insufficient and not all symptomatic patients will be able to receive adequate care. It would therefore be desirable, in order to quickly identify as many positive cases as possible, to use structures and staff of private analysis centers, in order to increase the number of swabs analyzed daily, which is currently absolutely insufficient.
References
Flaxman, S., et al. (2020). Estimating the number of infections and the impact of nonpharmaceutical interventions on COVID-19 in 11 European countries. Available at https://www.imperial.ac.uk/media/imperial-college/medicine/sph/ide/gida-fellowships/Imperial-College-COVID19-Europe-estimates-and-NPI-impact-30-03-2020.pdf.
Verity, R., Okell, L. C., Dorigatti, I., Winskill, P., Whittaker, C., Imai, N., … & Dighe, A. (2020). Estimates of the severity of COVID-19 disease. medRxiv.
7 settembre 2020
MICHELE VALSECCHI, RUBEN DURANTE
Internal migration and the spread of COVID-19
(full article – VoxEu CEPR 02 September 2020 -:
https://voxeu.org/article/internal-migration-and-spread-covid-19)
Abstract: Many internal migrants returned to their place of origin after the initial outbreaks of COVID-19 and before national lockdowns were in place. Has this behaviour contributed to the further spread of the pandemic and to its heavy death toll? Looking at the case of Italy and using data on the place of origin and destination of internal migrants, this column finds that provinces more exposed to return migration from areas hit by the pandemic earlier on experienced considerably more COVID-19 deaths in the ensuing months.
Keywords: coronavirus, COVID-19, Italy, migration, mortality
COVID-19 has claimed over 600,000 lives worldwide and has imposed unprecedented economic damage (World Health Organization 2020). Though virtually no country was spared by the pandemic, its impact has varied considerably across countries, with some managing to respond much more effectively than others. Some studies have investigated what factors may explain these differences, from the adoption of different policies (Hsiang et al. 2020, Fang et al. 2020 and references therein) to cultural factors that may have contributed to the success of social-distancing measures (Barrios et al. 2020, Durante et al. 2020a, 2020b, Giuliano and Rasul 2020).
One aspect that remains relatively unexplored concerns how the virus spread across space from the first limited outbreaks to entire countries, and, in particular, the role that internal migration may have played in this context. Extensive anecdotal evidence and news reports indicate that, following the early outbreaks and the subsequent economic slowdown, many internal migrants decided to return to their place of origin. This was especially true for recent migrants who maintain strong ties with their place of origin but have a limited support network in the destination place. In some cases, the decision to ‘return home’ was prompted by the announcement by local authorities of the imposition of ‘red zones’ and other mobility restrictions (Giuffrida and Tondo 2020).
In principle, the return of migrants to their hometowns from places heavily hit by the pandemic may have contributed to the spread of the virus since these individuals could have been asymptomatic carriers or may have contracted the disease while travelling. This could ultimately result in places with more returning migrants experiencing more COVID-19 cases and deaths. However, no systematic evidence exists about the plausibility and importance of this channel.
In a recent working paper (Valsecchi and Durante 2020), we attempt to fill this gap by investigating the relationship between internal migration and the spread of COVID-19. We focus on Italy, one of the countries most affected by the pandemic and traditionally characterised by considerable flows of internal migrants, most notably from southern to northern regions.
We exploit the fact that, after the first outbreak of COVID-19 in late February, most cases were concentrated in a small number of provinces in the regions of Lombardy, Veneto, and Emilia-Romagna. Using comprehensive data on the place of origin and destination of individuals having migrated over the previous years, we construct a measure of the potential for return migration from early-outbreak areas to each province. We then examine whether provinces with more migrants potentially returning from outbreak areas experienced a higher number of COVID-19-related deaths and higher total excess mortality over the ensuing months.
One key aspect of our analysis is that we use information on migration patterns that pre-date the COVID-19 pandemic and cannot therefore be affected by the latter. Another important element is that we exploit differences between provinces in the number of migrants to specific areas that were affected by the pandemic earlier on, controlling for total outmigration. This alleviates possible concerns that a particular characteristic of the province of origin (e.g. local institutions, health capacity, and civic capital) may drive both migration and COVID-19 mortality.
Furthermore, to rule out the possibility that our findings are driven by a generic North-South divide, we compare the evolution of COVID-19 mortality between provinces of the same region. Our main outcome of interest is the number of deaths due to COVID-19, which is available for each province in each month. However, to alleviate the concern that COVID-19 deaths may be misreported or underestimated, and that this bias may differ between provinces (Ciminelli and Garcia-Mandicó 2020a, 2020b), we also consider the evolution of total (excess) mortality. This allows us to test the effect of return migration on the total number of deaths relative to those recorded in the same month of previous years.
Finally, to shed light on the mechanism trough which return migration influences the spread of COVID-19 we exploit data on actual mobility between provinces in the monts before and after national lockdown . These high-frequency date are based on phone-tracking records and provide a clear picture of the total number of daily displacements between out.
…
The evidence emphasises the potential role played by internal migration in the context of a pandemic. Previous work has shown that, by reinforcing economic connections between different areas of a country, internal migration can boost aggregate productivity (Bryan and Morten 2019), help dissipate local negative economic shocks (Monras 2018), and let migrants’ households at origin diversify risks (Gröger and Zylberberg 2016). Our results indicate that the opposite may apply to the case of health shocks: they may propagate shocks and constitute an additional risk for households in migrants’ hometowns.
While the issue of international migration and the necessity to close the frontiers to prevent the further spread of the virus has attracted vast political debate, the discussion on how to deal with internal migration has been rather limited, arguably due to the difficulty, both logistical and political, of imposing long-lasting restrictions to mobility within a country.
An alternative and less invasive approach would be for governments to keep up-to-date databases of migrants, particularly recent ones, to be in the position, when a new outbreak occurs, to reach out to them to raise awareness of the risks of travelling for themselves, their families, and the community at large. Information on migration-related connections between provinces could also be used by policymakers to predict what areas of the countries a health emergency may likely extend to and to allocate public medical and economic resources accordingly break areas and any province from which migrants originate.
3 agosto 2020
MICHELE LIMOSANI
La “Green Economy”: un settore strategico per la città di Messina
Abstract: Con il progetto “Il sentiero dei parchi”, il Governo scommette sulla “green economy” e sull’economia dei parchi. In particolare, soffermandosi sul quadro messinese e siciliano, si rileva che, mentre i segnali di attenzione verso questo settore strategico restano deboli, si registra una cronica carenza di visione a lungo termine e a vasto raggio, sempre più necessaria data la crisi devastante determinata dalla contingenza epidemica, e di “grandi progetti”, nonostante le numerose potenzialità.
Keywords: “Sentiero dei parchi”, “green economy”, strategie di investimenti, rilancio economico, itinerari escursionistici, economia dei parchi.
Il Governo nazionale scommette sulla green economy e sull’economia dei parchi. Lo annuncia il ministro per l’ambiente Sergio Costa durante la Giornata Europea dei Parchi che si è celebrata nei giorni scorsi e nella quale è stato presentato il progetto “Il sentiero dei parchi” (un itinerario escursionistico che toccherà tutti i parchi nazionali del nostro paese) e richiamato lo stanziamento, già deliberato nella legge di bilancio, di 35 milioni di euro per il periodo 2020-2033 per la manutenzione ed il potenziamento delle reti sentieristiche. In Sicilia, e nella nostra città metropolitana in particolare, non si colgono invece segnali di attenzione verso questo settore strategico e si registra una cronica carenza di visione e di grandi progetti, soprattutto da parte di quei movimenti e associazioni che si impegnano a promuovere la realizzazione di un’economia più sostenibile.
Ora, non credo esista ombra di dubbio sul fatto che la green economy costituisca una grande opportunità di sviluppo per la nostra città; basti pensare che da un punto di vista territoriale la città metropolitana di Messina si qualifica come una grande area protetta dal polmone verde (i Peloritani, l’Alcantara e il parco dei Nebrodi) e un lungo affaccio sue due mari (i waterfront della città metropolitana). Tra il “polmone verde” e il waterfront si inseriscono poi i sistemi fluviali (le blue ways) e i loro bacini che rappresentano un trait d’union tra queste due tipologie di aree.
Un progetto di sviluppo della città metropolitana di Messina, quindi, non può prescindere dalla valorizzazione dei due parchi già esistenti (il parco naturale dei Nebrodi e il parco fluviale dell’Alcantara) e dalla auspicabile istituzione del Parco dei Peloritani. La realizzazione di quest’ultimo completerebbe -dal punto di vista delle aree protette- il vuoto solo in parte colmato dalla presenza della riserva di Fiumedinisi e Monte Scuderi e faciliterebbe l’integrazione, attraverso la valorizzazione del sistema fluviale, della rete dei comuni collinari con la rete dei comuni marinari. Una triade spesso caratterizzata dall’uso dello stesso toponimo per indicare, contemporaneamente, il nome del borgo collinare, il nome del borgo marinaro e il nome della fiumara (come, ad esempio, Alì).
Se si tiene conto anche dell’istituendo parco dei Peloritani, il 76% dei Comuni della città metropolitana di Messina risulta compreso dentro un parco. Nessun’altra città metropolitana italiana ha un numero così alto di Comuni che partecipano a questo tipo di aree protette, per cui Messina si potrebbe qualificare, come spesso il prof. Gambino ha sostenuto, “la città metropolitana dei parchi”.
La vera sfida quindi sarebbe quella di realizzare il Parco dei Peloritani, integrare la rete dei parchi e delle riserve (l’arcipelago eoliano, la laguna di Tindari a Patti, la riserva verde e la riserva Marina a Milazzo) con la rete formata dall’armatura culturale del territorio e quella agro-ecologica, rigenerando i borghi e promuovendo un turismo sostenibile. Dentro i parchi, infatti, ci sono patrimoni storici e culturali di inestimabile valore che tramite opportuni processi di riqualificazione e di proposizione di servizi al turista, possono rappresentare una possibilità di sviluppo economico dal valore aggiunto incalcolabile. “Riscopri la natura, il mare, i monti, gli antichi sapori, i borghi e i mestieri”. E’ ovviamente uno slogan; ma in questa prospettiva venire a Messina per “spendere” sul territorio potrebbe avere un senso del tutto diverso da quello un po’ riduttivo e miope che in questi giorni si è diffuso nelle nostre piazze.
27 luglio 2020
MICHELE LIMOSANI
L’Università al tempo del Corona Virus
Abstract: La riflessione riguardante gli effetti del Corona Virus coinvolge direttamente anche il sistema universitario nazionale, che sta attraversando una vera e propria ‘rivoluzione tecnologica’ che investe l’attività di formazione, le modalità di organizzazione dei servizi e della gestione delle risorse umane; una rivoluzione che produrrà trasformazioni destinate a protrarsi nel tempo.
Keywords: COVID-19, sistema universitario nazionale, rivoluzione tecnologica, formazione a distanza, strutture complesse, telelavoro, smart working.
Esiste un filone di pensiero in Sociologia che sostiene come i cambiamenti istituzionali non sono sempre il risultato di piani intenzionali o di una chiara volontà. I mutamenti, ovviamente, possono riguardare anche le trasformazione organizzative e le abitudini di lavoro dei soggetti che animano le “strutture complesse”, abitudini che si sono consolidate e cristallizzate nel tempo e che rappresentano, spesso, il principale ostacolo al cambiamento organizzativo.
Una teoria, quelle delle “conseguenze inintenzionali”, che è possibile applicare nell’ambito del sistema universitario nazionale ed, in modo particolare, dell’Università degli Studi di Messina; struttura che, per la responsabilità e le funzioni che mi sono assegnate, mi capita di osservare un pò più da vicino. Come sta cambiando il modo di fare Università a Messina ai tempi del Corona Virus? Non è certamente un passaggio facile e indolore ma in questo momento nella nostra università è in corso una vera e propria “rivoluzione tecnologica” che investe l’attività di formazione, le modalità di organizzazione dei servizi e della gestione delle risorse umane; una rivoluzione che produrrà trasformazioni destinate a durare nel tempo.
E’ stata, per esempio, predisposta in brevissimo tempo -grazie ad uno sforzo immane da parte del nostro personale tecnico informatico- l’infrastruttura hardware e software per la video-conferenza e la teledidattica. Siamo oggi pronti a portare in qualunque luogo ed in qualunque tempo la presenza virtuale di ogni professore. Obiettivo straordinario se pensiamo che le attività precedentemente svolte dal nostro Ateneo in modalità e-learning non raggiungevano la soglia del 20%.
La fruizione on line dei contenuti ha comportato un’accelerazione a livello amministrativo della riorganizzazione dei servizi a supporto dell’attività didattica e la digitalizzazione delle procedure ammnistrative. Abbiamo già svolto nei giorni precedenti i primi esami di laurea in modalità telematica così come ormai quasi tutte le commissioni concorsuali dei ricercatori e degli assegnisti sono svolte on line. Le attività amministrative a supporto di queste attività, nel rispetto della trasparenza, pubblicità e sicurezza dei dati, sono state tutte realizzate in remoto (back office) per via telematica.
La digitalizzazione dei procedimenti ammnistrativi ha reso possibile sperimentare lo smart working. In queste ore una buona parte dei compiti amministrativi relativi alle procedure e alle attività di routine (autorizzazioni, certificazioni, emanazione decreti, controlli amministrativi), che tanto tempo e personale assorbono nella vita quotidiana delle strutture dipartimentali, sono svolte dai tecnici ammnistrativi in “modalità agile”, ossia dalle proprie abitazioni attraverso il tele-lavoro.
Come risulta evidente dai questi pochi esempi si tratta di una profonda trasformazione che investe tutte le attività dell’Università; un cambiamento non pianificato ma che l’emergenza Corona Virus sta generando a tappe forzate e in modalità “learning by doing”. Certo questo cambiamento porrà delle nuove sfide: come valorizzare il patrimonio di conoscenza e di competenze acquisite? Cosa preservare del passato e come riposizionare il nostro Ateneo nel contesto regionale, nazionale ed internazionale? Sono le sfide che attendono la governance una volta passata la bufera del Corona Virus; rimane il fatto, comunque, che questo sciagurato evento, suo malgrado, lascerà la nostra Università tecnologicamente più avanzata, più produttività e quindi più competitiva.
http://www.letteraemme.it/luniversita-ai-tempi-del-coronavirus-il-contributo-di-michele-limosani/
20 luglio 2020
MICHELE LIMOSANI
Mes e sanità regionale. Quale modello per la fase post covid 19?
Abstract: La generale riflessione riguardante gli effetti del coronavirus sulla sanità mondiale apre l’ulteriore riflessione sulla sanità regionale e su come potrebbe cambiare la sanità in Sicilia utilizzando le risorse disponibili. Le strade percorribili sono diverse: è più efficace orientare tutte le future risorse finanziarie e gli sforzi organizzativi sulla gestione delle emergenze sanitarie, sulla terapie intensive e quindi sul potenziamento delle infrastrutture ospedaliere, o è preferibile mettere in atto una strategia più “community based”, che limiti al massimo l’ospedalizzazione e sia in grado di produrre una trasformazione profonda della gestione del sistema della prevenzione, del monitoraggio e dei servizi domiciliari alla persona? Il punto, adesso, è operare corrette scelte politiche.
Keywords: COVID-19, sanità mondiale, sanità regionale, strutture ospedaliere, strategia “community based”, MES, Pandemic Crisis Support.
La Commissione Europea ha dato il via libera alla nuova linea di credito Pandemic Crisis Support a valere sulle risorse del MES e tutti gli stati membri, da ora in poi, avranno la possibilità di finanziare a basso costo investimenti sanitari enormi senza alcuna condizionalità. Un risultato che rende giustizia di un assurdo e sterile dibattito che ha ammorbato il paese; una ghiotta opportunità per il governo nazionale per aumentare la spesa sanitaria che negli ultimi anni ha subito tagli consistenti. La questione, quindi, non è più tanto quella di prendere questi soldi (sono disponibili circa 37 miliardi per il nostro paese), quanto piuttosto quella di decidere cosa fare con queste risorse. Quali sono le strategie da adottare? Quali sono le priorità? Proviamo, sia pur in modo sintetico, ad affrontare tali questioni.
Il prof. Alberto Zangrillo, primario dell’Unità Operativa di Anestesia e Rianimazione del S. Raffaele di Milano, nel suo recentissimo e-book “In prima linea contro il Coronavirus” sostiene che “il ricorso alla terapia intensiva è stata la misura del fallimento del sistema di prevenzione e di cura sanitario”. E mentre tutto ciò poteva essere giustificato all’inizio della crisi quando il virus ci ha colto impreparati, tale atteggiamento non può essere tollerato nella fase post crisi della virus; perseverare, diabolicus est. Secondo il prof. Zangrillo, ma non è l’unico scienziato impegnato su questo fronte, gli ospedali non sono la prima linea di difesa contro l’epidemia e rimangono una extrema ratio.
Un messaggio in controtendenza nel dibattito pubblico che rischia, tuttavia, di finire su un binario morto anche per via del gran battage pubblicitario sostenuto dalle tv e dai quotidiani sulla decisione di potenziare le strutture ospedaliere in termini di nuovi posti letto, ordinari e di terapia intensiva -nella sola provincia di Messina sono previsti 569 posti di cui 446 ordinari e 115 di terapia intensiva. Una scelta, lo ripeto, opportuna e doverosa nella prima fase della crisi in cui il motto è stato “mettiamoci al sicuro”, ma che sembra essere una decisione da sottoporre quantomeno ad una riflessione critica se riproposta anche nella fase post-crisi.
E’ efficace ed efficiente, dal punto di vista economico e sociale, orientare tutte le future risorse finanziarie e gli sforzi organizzativi sulla gestione delle emergenze sanitarie, sulla terapie intensive e quindi sul potenziamento delle infrastrutture ospedaliere? O, piuttosto, si deve favorire una strategia più “community based”, che limiti al massimo l’ospedalizzazione e sia in grado di produrre una trasformazione profonda della gestione del sistema della prevenzione, del monitoraggio e dei servizi domiciliari alla persona? Una strategia in cui le ASL e la rete territoriale dei medici di base e dei pediatri, le funzioni loro assegnate, le competenze, la tecnologia a disposizione, i modelli di gestione e di organizzazione, diventano questioni rilevanti?
Io non credo che con le risorse future disponibili potremo fare tutto (potenziamento strutture ospedaliere e medicina territoriale); ma se la scelta del governo regionale fosse quella di riprendere i 270 progetti infrastrutturali rimasti incompiuti, allora la direzione sarebbe già segnata e non coglierebbe il nodo del problema, e cioè la necessità di investire in prevenzione. Una seria e approfondita analisi del modello di gestione della sanità regionale, scevra dalle “pressioni” -anche legittime- che provengono dagli interessi organizzati, si rende necessaria. In questa prospettiva ci aspettiamo dalla politica regionale un contributo che non può limitarsi alla discussione sulle mascherine e sui tamponi (cosa peraltro buona e giusta), soprattutto quando ad essere in gioco c’è la salute dei cittadini.
13 luglio 2020
MICHELE LIMOSANI
Il virus non conosce confini. In Italia sarà recessione o pitstop?
Abstract: La generale riflessione riguardante gli effetti del coronavirus sull’economia a livello non solo mondiale, ma locale, rileva come la pandemia aprirà le porte alla recessione, determinando un forte calo nei livelli di produzione e di benessere. Le sorti dell’economia italiana dipendono dalla capacità di non stare troppo tempo ai box
Keywords: COVID-19, economia mondiale, economia locale, recessione, “pit-stop”.
Il virus e la recessione
La crisi sanitaria, ormai è sotto gli occhi tutti, porterà in dote la recessione economica in tanti paesi dell’OECD, determinando un forte calo nei livelli di produzione e di benessere (l’economia reale dunque) che potrebbe, in assenza di interventi “illuminati” da parte delle autorità di politica economica, destabilizzare il sistema finanziario e quello bancario. Si tratta di una crisi che colpirà prevalentemente i paesi più ricchi e che, per la natura dello shock e per gli effetti da esso prodotti, non risulta paragonabile alla “grande recessione” del ’29.
Un virus senza confini
Il virus non conosce confini e, atteso l’elevato grado di integrazione e di interdipendenza tra i diversi paesi, risulta oltremodo impossibile arginare la propagazione degli effetti negativi della crisi economica. Siamo dunque in presenza di una recessione che impatta sul sistema economico mondiale e che necessita risposte di politica economica coordinate a livello globale ed, in primo luogo, tra quei paesi (Stati Uniti, Cina ed Europa) che insieme determinano l’80% circa della produzione mondiale. Questi grandi players hanno un comune interesse a cooperare per “salvare” i sistemi economici da cui -in buona parte- dipende la loro stessa ricchezza; ma allo stesso tempo può essere forte la tentazione di cogliere l’opportunità della crisi per modificare la distribuzione delle forze in campo e l’assetto geopolitico che ha caratterizzato, fino a questo momento, il contesto internazionale.
In Italia un “pit-stop”
L’economia mondiale e il nostro paese in particolare, quindi, subiranno -a causa del virus- un brusco “pit stop” la cui intensità è difficile da stimare e la cui durata dipenderà dalla nostra capacità di arrestare la pandemia. Fondamentale, tuttavia, sarà la ripartenza. Come la storia della formula uno insegna, anche una manciata di secondi in più nella ripartenza dai box può pregiudicare il raggiungimento di una posizione sul palco dei vincitori. Il tempo trascorso ai box, fuor di metafora, deve quindi essere ridotto al minimo ed impiegato per rimuovere tutte quelle criticità che influenzano negativamente la competitività del sistema produttivo; il motore della nostra economia deve, quanto prima possibile, ripartire.
Il ruolo dello Stato
La crisi economica, infine, ha riportato al centro del dibattito politico il ruolo dello Stato. Attenzione, tuttavia, a non buttare il bambino con tutta l’acqua sporca. “Il buon funzionamento del mercato dipende dal buon funzionamento dello Stato che non sono tra loro alternativi ma reciprocamente dipendenti”. Ed il ruolo dello Stato diventa essenziale ed insostituibile nel caso dei “beni pubblici” (salute, difesa, rispetto delle regole, istruzione), situazione nella quale il libero mercato è incapace di assicurare una distribuzione giusta e ottimale delle risorse.
La crisi un’opportunità
Certo, lo Stato è stato spesso carente e fonte di sprechi e di inefficienza. Ma questo tempo di crisi potrebbe essere il momento opportuno per intervenire e proporre quelle riforme tanto attese e a vantaggio di tutti (come quella della burocrazia) necessarie per far compiere un salto di qualità e consentire al paese di riprendere il posto che merita in Europa e nel contesto mondiale.
6 luglio 2020
MICHELE LIMOSANI
Covid e crisi. Ecco chi paga il conto più salato a Messina
Abstract: la crisi economica devasta sempre più la Città dello Stretto. Già nel 2018 (ultimi dati disponibili) il 43% dei residenti a Messina non ha dichiarato alcun tipo di reddito. Su questa fascia di popolazione il Corona Virus ha generato un impatto dagli effetti dirompenti. La pandemia, difatti, ha provocato e provocherà ingenti danni e non solo sul piano della salute: a pagare il conto più salato saranno i “piccoli” imprenditori ed alcuni soggetti in “nero”. E’ auspicabile pertanto che nella prossima manovra di bilancio sia previsto un congruo contributo a fondo perduto alle piccole imprese, così come si evidenzia la necessità di estendere le misure finalizzate a sostenere i redditi degli indigenti e di quei numerosi soggetti che non godono di alcuna garanzia e protezione perché nascosti al fisco e alla società.
Keywords: Messina, crisi economica, economia post- COVID, sostegni economici statali, piccole imprese, lavoro “autonomo”, lavoratori in “nero”.
Chi pagherà il conto a Messina?
Chi sono i soggetti economici più esposti alla crisi del Corona Virus? Chi pagherà alla fine il conto? Per rispondere a tale quesito rivolgiamo lo sguardo alla tipologia dei redditi percepiti in città partendo subito da un primo dato. Nel 2018 (ultima informazione disponibile) il 43% della popolazione residente in città (circa 100.000 persone) non ha dichiarato alcun tipo di reddito. Se teniamo fuori da questo conto i giovani, ossia i soggetti di età compresa tra 0 e 19 anni, circa 40 mila persone, questo segmento di popolazione includerà, in prevalenza, moltissime donne che hanno rinunziato da tempo a cercare lavoro ed una cospicua fetta di soggetti che popolano il folto bosco del mercato nero, alcuni dei quali “sopravvivono” di espedienti. Difficile misurare l’impatto che il Corona Virus ha generato su questa fascia di popolazione, ma non escludo che gli effetti siano stati dirompenti; soprattutto per coloro che vivono di lavori -se così si possono definire- retribuiti ad ore e a giornate.
Chi è garantito dallo Stato
Secondo elemento. E’ noto che i soggetti che dichiarano redditi da lavoro dipendente e da pensione costituiscono il 90% circa del totale delle dichiarazioni fiscali. Ora, i pensionati e i pubblici dipendenti hanno i redditi garantiti dallo Stato. Anche per i dipendenti regolarmente assunti dalle imprese private, tuttavia, lo Stato è intervenuto attraverso l’erogazione della cassa integrazione (anche quella in deroga). C’è stato in Sicilia, a causa di una inefficiente burocrazia regionale, un forte ritardo nell’erogazione di tale contributo. Ma ciò che conta è che anche la stragrande maggioranza di questi redditi è stata garantita dallo Stato. I percettori di redditi da immobili, inoltre, -specie quelli concessi in locazione alle attività commerciali- sembra si siano garantiti da soli. I commercianti hanno lamentato spesso la mancanza di sensibilità da parte dei proprietari degli immobili che, al di là delle oggettive difficoltà, hanno comunque preteso il pagamento del canone di locazione.
La strage degli autonomi
Terzo elemento. Nel caso dei redditi da lavoro autonomo la situazione è leggermente più articolata. In primo luogo coloro che dichiarano redditi da lavoro autonomo (artigiani, professionisti, agenti di commercio, etc…) sono poco più di 3.000. All’interno di tale categoria, inoltre, si trovano soggetti con fasce di reddito molto variegate; dal coloro che guadagnano 15.000 euro l’anno (piccoli artigiani) a riconosciuti professionisti con redditi superiori ai 100.000 euro. Una parte dei lavoratori autonomi (avvocati, notai, commercialisti), poi, lavora a “prestazione” e spesso può risultare difficile individuare quante prestazioni sono state interrotte in questo periodo. Il governo, comunque, è intervenuto in questo settore con un contributo destinato ai lavoratori autonomi di 600 euro. Si tratta di un modesto sussidio e tanti reclamano interventi più consistenti. E‘ pur vero, tuttavia, che in molte professioni, vedi quella degli avvocati per esempio, i problemi di natura economica vengono da lontano ed è ragionevole pensare che la crisi del corona virus li abbia soltanto fatti emergere nella loro cruda oggettività.
Le piccole imprese in agonia
Dulcis in fundo la tipologia sicuramente più colpita dalla crisi, i redditi da impresa e soprattutto quelli della piccola impresa, individuale e/o familiare, con un scarso numero di dipendenti, rimasta ferma in questo periodo. Come è noto il settore delle piccole imprese presentava già prima della pandemia enormi criticità. Nel 2018 erano più di 8.000 le imprese inattive e circa 5.000 le ditte individuali che, registrando perdite di esercizio nell’anno corrente, presentavano un imponibile pari a zero. Non è dato sapere quante di queste aziende riprenderanno le attività e se la crisi ha distrutto irreversibilmente quel poco di capitale umano e finanziario che consentiva loro di sopravvivere. Per le piccole imprese rimanenti (altre 5.000) la sfida è quella della ripartenza.
Quei 600 euro dal governo…..
Il governo è intervenuto anche a sostegno dei redditi dei piccoli imprenditori con l’erogazione delle 600 euro; una somma irrisoria, tuttavia, che non è stata nemmeno sufficiente per coprire quei costi che non è stato possibile rinviare per decreto. Il governo nazionale si è inoltre preoccupato di far pervenire liquidità alle imprese attraverso le garanzie prestate al sistema bancario; ma sempre di un debito si tratta, anche se a costi minimi, un debito che peserà nella fase di ripartenza dove serviranno inevitabilmente risorse aggiuntive. In estrema sintesi, quindi, perdite significative, mancato guadagno, maggiore debito, fatturato azzerato e per molte imprese (specialmente quelle che operano nel settore del commercio e della ristorazione) un futuro incerto. Cosa chieder di più?
Pagano i più “piccoli”
A pagare il conto più salato saranno quindi i “piccoli” imprenditori ed alcuni soggetti in “nero”. E’ auspicabile pertanto che nella prossima manovra di bilancio sia previsto un congruo contributo a fondo perduto alle piccole imprese, calibrato sul fatturato registrato nel corso dell’anno precedente, a parziale ristoro delle perdite subite e per sostenere la fase di ripartenza; così come si renderà necessario estendere le misure finalizzate a sostenere i redditi degli indigenti e di quei numerosi soggetti che non godono di alcuna garanzia e protezione perché nascosti al fisco e alla società.
18 giugno 2020
MICHELE LIMOSANI
Il futuro di Messina dipende anche da noi
Abstract: L’economia della nostra città necessita di uno shock, un disperato e, forse ultimo, tentativo per evitare che la città precipiti, anche per colpa del corona virus, in uno stato di coma irreversibile; una città fortemente ridimensionata nella sua capacità produttiva, nei livelli di occupazione e di ricchezza in possesso delle famiglie.
Keywords: Messina, New Green Deal, attraversamento dello Stretto, rinascita economica, interventi strutturali, European recovery Program
Due progetti
Dopo la proposta del “New green deal” (Messina la città dei parchi) -avanzata nei giorni scorsi- vorrei proporre al pubblico dibattito altri due progetti che sono in grado di produrre un impatto dirompente sul sistema economico locale. Sono interventi che necessitano di un cambio radicale del paradigma dominante nella gestione amministrativa delle risorse umane e finanziarie e delle regole che disciplinano l’affidamento dei lavori pubblici (codice degli appalti). Si escludono, inoltre, assegnazioni di sussidi diretti alle famiglie; aiuti alle imprese, piccole o grandi che siano; trasferimenti alle pubbliche amministrazioni per spese correnti ed erogazione di servizi. Parliamo, invece, di interventi infrastrutturali che mirano a generare opportunità di investimento per le imprese esistenti e quelle che verranno dall’esterno; aziende pronte a scommettere su un territorio che ha deciso di “svoltare”.
Messina-Reggio
Ecco, in estrema sintesi, le due linee progettuali. Il primo progetto è quello di realizzare l’attraversamento stabile dello Stretto e far diventare la conurbazione MESSINA-REGGIO un nodo del corridoio europeo scandinavo mediterraneo. La conurbazione dello stretto diventerebbe così il baricentro di una rete di nodi connessi dall’alta velocità che collega sei città metropolitane del mezzogiorno: NAPOLI e BARI a nord, CATANIA e PALERMO a Sud. Sarà necessario, inoltre, completare e potenziare tutte le connessioni, ferroviarie, stradali e marittime per rendere facilmente accessibili al corridoio europeo le aree portuali (Messina, Milazzo, Tremestieri, Porto storico), quelle aeroportuali (Catania-Reggio), le aree industriali della nostra ex-provincia (identificate nel piano ZES), i distretti turistici, i parchi e le riserve. Si tratta, infine, di realizzare un sistema della mobilità “sostenibile” che, a partire dal nodo ferroviario della riqualificata e/o realizzata ex-novo “stazione centrale” (nodo del corridoio europeo), si snoda lungo la città da nord a sud e si protende poi verso il continente per raggiungere Reggio Calabria, il porto e l’aeroporto dello Stretto; una rete infrastrutturale gestita con le nuove tecnologie che innerva la conurbazione MESSINA-REGGIO e che proietta lo stretto nel mediterraneo. Il secondo progetto riguarda un “grand programme de rénovation urbaine”, un progetto ambizioso di riqualificazione urbana della città. Riabilitare, rigenerare, ri-pensare le periferie ed eliminare alla radice il problema atavico delle “baracche”. E’ appena iniziato l’iter legislativo sul risanamento in commissione Ambiente alla Camera; è un tema sul quale la politica non può giocare di fioretto o contendersi il palcoscenico. Insieme dobbiamo chiudere una volta per sempre i conti con il passato, la città non può lasciarsi sfuggire questa occasione.
Il water front
Funzionale, poi, allo sviluppo della città, è la valorizzazione del porto di Messina e del water front, a partire dal polo culturale del Margherita, passando per la zona falcata e gran parte delle aree ancora oggi asservite al passaggio dei binari ferroviari. Per recuperare poi la simbiosi smarrita tra il porto e il limitrofo tessuto urbano di Messina si dovranno valorizzare a) i poli economici, che avranno un grande impulso dalla costituzione di una poliedricità di “centri commerciali naturali” da realizzare in aree strategiche della città; b) i poli culturali di grande prestigio (come il Duomo, Santa Maria Alemanna, la chiesa dei Catalani e il borgo degli antichi mestieri (Tirone), c) la stazione marittima, destinata così a diventare il gateway della città. Interventi che nel complesso dovranno essere pensati e progettati in chiave di sistema, coerentemente con una visione di città più green, più smart e che possano dare un grande impulso alla edilizia, cuore pulsante della nostra economia.
Le risorse
Dove troveremo le risorse per tutti questi grandi progetti? Non preoccupatevi, l’Europa metterà a disposizione del nostro paese (e la proposta della commissione che sarà discussa nel prossimo consiglio europeo) 170 miliardi attraverso l’European Recovery Program, di cui il 34% dovrebbe essere investito nel sud del paese. Quante risorse arriveranno in città e quali progetti saranno proposti in ambito europeo dipende dal governo nazionale; ma dipende anche da tutti noi. Adesso o mai più.
https://www.tempostretto.it/news/limosani-il-futuro-di-messina-dipende-anche-da-noi.html
16 May 2020
JOHN COCHRANE
Covid and economics publishing
Abstract: The pandemic is dramatically illustrating one area in which the epidemiologists are beating the economists about 100-1: publishing. Scientific publications are reviewed and posted in days, contributing in real time to the policy debate. Economists are writing papers in a similar flurry. But when will these papers be peer reviewed? Where will they be published?
Keywords: COVID 19 pandemic; world economy; economics publishing
The pandemic is dramatically illustrating one area in which the epidemiologists are beating the economists about 100-1: publishing. Scientific publications are reviewed and posted in days, contributing in real time to the policy debate.
Economists are writing papers in a similar flurry. They are writing really good, thoughtful, well done papers that are useful to the policy debate. See the NBER website for example, or SSRN. See my last post and previous one for several great examples.
But when will these papers be peer reviewed? Where will they be published?
Not every new paper is right, and the review and comment process improves economic papers a lot.
Economics publishing is stuck in a leisurely 19th century process. It typically takes several years from completing a project to its online publication, and often another year to print. And “completing” already includes pre-submission vetting through conferences, correspondence, seminars and working papers. I often wait a year to hear the first review of my papers. Even the best journals try for 6 weeks. Several rounds of revisions are almost universal. It is typical to be rejected, shop the paper to several journals who reject it (after 6 moths to a year), hear the same comments from different referees, until you find an editor who likes the paper. (Almost all of my papers have been rejected at least once. My record is 7 times.)
As a result, academic journals long ago ceased to be avenues for communication. They are archives, and certifiers for tenure committees that don’t trust themselves to read papers. Individual websites, and working paper series such as NBER and SSRN have taken over the communication function. But not every paper is right, and that means little of our communication takes place after any peer review.
This state of affairs has a supply effect. I cheer my colleagues writing these papers. But where in heaven’s name are they going to publish the papers? When, a year from now, the first reviews come back, will the editors still find the papers interesting and relevant? How will you fill in the increasingly mandatory section on “why this is important” and “policy implications” a year, or two years from now? The referees will demand a literature review. How will you cover the hundreds of papers sure to come out in the next few months? (Economics does not demand review only up to the date the working paper is first posted.)
For example, my last post could well become a paper. It needs a lot of work — refining the model, exploring economic costs and benefits, modeling the externality or heterogeneity helps, (surely yes), comparing it with data, and so forth. But should I put in that work, at least a month off of doing everything else, and then a further two to three months of revisions, submissions, resubmissions, and so forth for a period of years? No thank you.
My model, like most of these papers, is not a deep methodological improvement. It is a where-are-we-now paper, and a quantified attempt to peer through the mist of the next few months. Where-are-we-now papers are useful! They are 99% of academic research really. If there was a chance of publishing it the way scientists do, I might well do so. But submit it in July and still be waiting in May 2021 to hear a first review? Face a good bet that the editor thinks this is interesting economic history, but not a methodological or factual development of enduring interest? No thanks.
This is not news. There is a lot of soul-searching going on in our journals about how to become more relevant. Economics articles are quantitative essays more than scientific reports, so they often need a bit more digestion. Peer review itself is imperfect — there is lots of nitpicking but often basic mistakes go unnoticed. (I’ve long been a fan of open reviewing to broaden the base of input on papers. Often a conference discussant or other reader will know a lot about a paper, but the journal editor and selected referees don’t know about it. Universally, editors ask for new referees thus wasting the efforts of the often dozens of people who have reviewed the paper before. The idea is going nowhere.) Economists believe in markets, but not for papers. Why do we not figure out a market for submissions so that papers can get better matched to journals to start with, rather than one by one embark on a 6 month process and move from rejection to rejection. Why not simultaneous submissions?
But the I hope the model of the scientists inspires our journal editors to action.