
13 novembre 2024
BENEATH THE SURFACE: WHAT MEDIEVAL MOBILITY REVEALS ABOUT INTERGENERATIONAL WEALTH TRANSMISSION
Marianna Belloc Roberto Galbiati Francesco Drago
(synthesis; full article 12 Nov 2024
https://cepr.org/voxeu/columns/beneath-surface-what-medieval-mobility-reveals-about-intergenerational-wealth)
Abstract: The Middle Ages are widely understood as an era of economic immobility. This column uncovers a more nuanced picture. Wealth transmission in late medieval Florence was characterised by both mobility and persistence. While there was a notable degree of social mobility across adjacent generations, privilege tended to persist over longer horizons. Social and political networks played a significant role in generating such persistence, with families embedded in marriage networks and political institutions securing prosperity and status. The findings provide a historical perspective on the dynamics of wealth transmission.
Keywords: Economic History, poverty, income inequality, Middle Ages, intergenerational wealth, Italy.
It is a widespread belief that the Middle Ages were characterised by an immobile society in which socioeconomic status was transmitted inexorably from fathers to sons, in a context of little opportunity to climb the social ladder, no system of public education, and inherited professions. This idea is consistent with empirical results by Mocetti and Barone (2016) documenting that the top income earners in contemporary Florence descend from the wealthiest families of the 15th century. Our study (Belloc et al. 2024a) uncovers a more nuanced picture. Quite surprisingly, we find a relatively high degree of short-run mobility in late medieval Florence, not so distant from that of modern Western societies. But this result masks a deep-rooted persistence of economic status across generations over the longer run. These findings not only refine our knowledge of the historical processes of intergenerational wealth transmission; they also offer valuable insights into broader underlying mechanisms that continue to influence inequality in modern societies.
In the paper, we exploit a large dataset that combines four subsequent wealth assessments – 1403, 1427, 1457, and 1480 – to provide detailed information on the universe of Florentine households spanning nearly a century. 1 The richness of the dataset allows us to investigate the transmission mechanisms within direct (parent-son) family ties as well as broader kinship networks and to study the underlying data generating process.
We begin by evaluating the extent of short-term social mobility through the estimation of two-generation models. Our results, obtained by regressing children’s wealth outcomes on those of their parents, suggest that Florentine society was relatively mobile in the short run over the considered time span, with estimated rank-rank correlation coefficients between 0.4 and 0.5 comparable to the correlation coefficients found in modern cities (two-generation coefficients for 20th-century Sweden, estimated by Adermon et al. 2018, go from 0.3 to 0.4 depending on the specification). These findings are consistent with other studies documenting a fair amount of socioeconomic mobility in medieval urban centres (Padgett 2010).
We then consider intergenerational wealth transmission across multiple generations. The adoption of the two-generation correlation coefficients to make inferences on the long run is likely to systematically overestimate the degree of mobility. Indeed, as discussed by several authors (Braun and Stuhler 2018), these extrapolations are likely to neglect important factors underlying the actual wealth transmission process. This is confirmed by our data when we link children directly to grandfathers and find substantially larger numbers (meaning lower mobility) than those inferred from standard iteration techniques.
To explain these findings, we evaluate two potential explanations. The first is the ‘grandparental effects model’, according to which grandparents pass their status to grandchildren via direct transmission of wealth, resources, or skills. The second is the ‘latent factor model’, which attributes wealth persistence to an unobserved factor that is passed down across generations at a high rate and that correlates to wealth without necessarily involving direct contact. In both models, mobility between two generations can be high. But in the long run, with the contribution of either the grandparents (in the first model) or the latent factor (in the second model), persistence of the economic status is empirically generated.
We run a series of exercises to discriminate between the two possible data processes, and our results lend support to the latent factor model. For example, we demonstrate that even in cases with little likelihood of direct interaction between (great-) grandparents and (great-) grandchildren (due to age difference or other factors), wealth outcomes of the younger generation are still strongly correlated with those of the elder generation. This suggests that wealth transmission is mediated by factors other than direct inheritance or financial transfers, providing evidence for the role of a latent factor.
We also discuss how our findings can explain the very long-term persistence of economic status, documented by Barone and Mocetti (2021), which links Florentine families’ wealth from the 15th century (1427) to economic status in the present day (2011). To this purpose, we simulate wealth transmission over 600 years by employing our previously estimated coefficients. Figure 1 depicts the horse race across alternative approaches. While the latent factor model run with our data predicts a slightly lower degree of long-term wealth persistence than that found by Barone and Mocetti, our findings confirm that wealth status can persist across many generations and that this is true even in the presence of a discrete amount of mobility in the short run (two-generation model). This conclusion further supports the latent factor model’s explanatory power of very long-run trends.
Figure 1 Prediction of wealth status transmission from alternative models
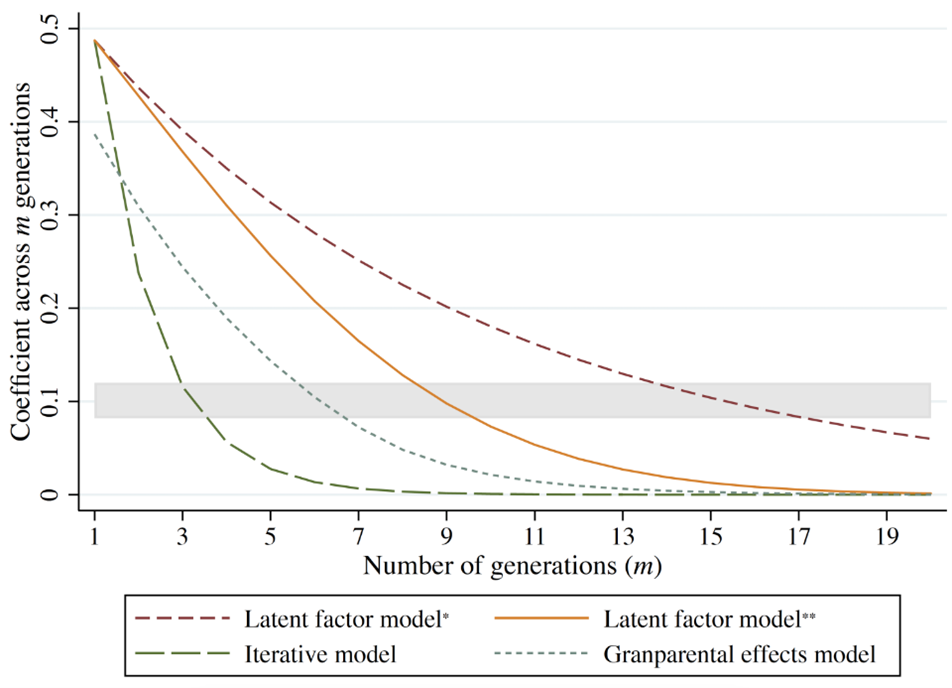
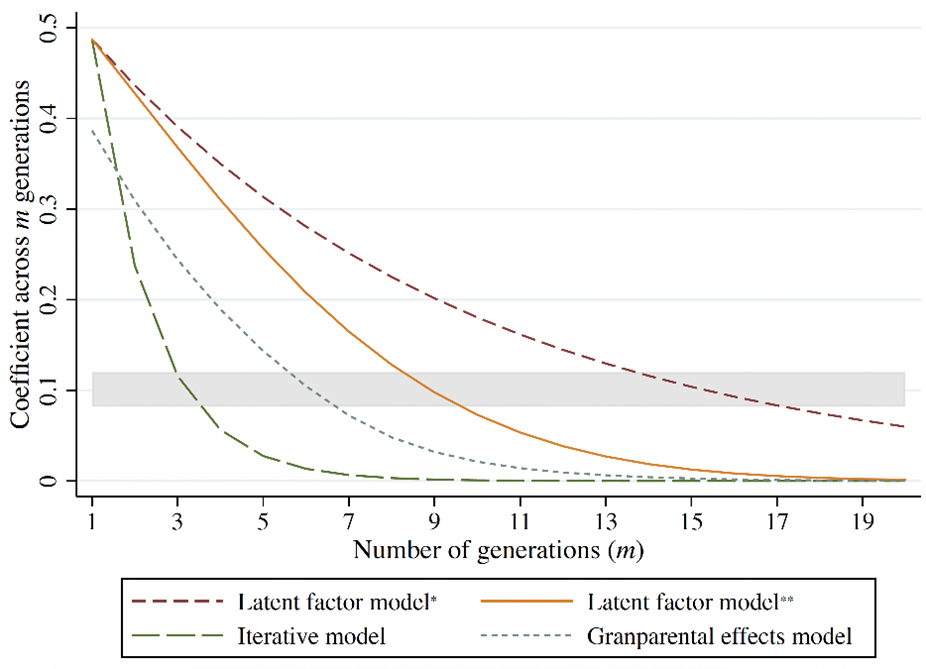
Notes: The picture shows the predicted correlation coefficients across m-generations from alternative models: latent factor model, iterative model, and grandparental effects model. The shaded area depicts the range of the estimated coefficient across 19 generations by Barone and Mocetti (2021). * Predictions are obtained assuming a constant heritability parameter. ** Predictions are obtained assuming that the heritability parameter declines by 1% every generation.
Finally, we explore mechanisms that could explain wealth status persistence and identify possible latent factors. In particular, we investigate the potential role of marriage networks and political participation. As regards the former, we complement our data with information on Florentine marriage networks (Padgett 2010) and find that families with higher ‘structural cohesion’ (measured by the number of marriage links to be severed to disconnect a family from the network) tend to experience greater wealth persistence. In other words, families that were more deeply embedded in the social fabric of Florence through marriage links were better able to maintain their economic status across generations. As for the latter, we employ data on political participation (the Tratte records) from Herlihy et al. (2002). We determine that Florentine citizens who held political office were more likely to belong to families with enduring wealth status, suggesting that access to political power helped reinforce economic advantage for wealthy elites. This connection between wealth and political influence underscores the importance of social capital in the transmission of wealth.
Our study adds to the growing body of literature on the intergenerational transmission of economic status, particularly in historical contexts. While much of the recent research focuses on contemporary societies (Pica et al. 2018, Polo et al. 2019, Porter et al. 2018), we show that similar mechanisms of wealth transmission were operating centuries ago. Our findings are consistent with other studies that have examined long-term wealth persistence, such as those by Ager et al. (2021) and Clark (2014), which also found that wealth status can persist for many generations, driven by latent factors rather than direct inheritance alone. By linking wealth data across multiple generations in premodern Florence, we provide insights into the broader forces that shape economic mobility. From the simple estimation of two-adjacent generation models, we are unable to make inferences on economic status persistence over the long run. We also highlight the importance of social networks and political engagement in maintaining wealth, even during an era marked by significant social and political change (Belloc et al. 2024b, Goldthwaite 2009, Najemy 2006). The use of a dataset spanning over four generations offers a rare opportunity to analyse long-run economic mobility in a historical setting, contributing to a more nuanced understanding of how wealth is transmitted over time.
In conclusion, we find that wealth transmission in late medieval Florence was characterised by both mobility and persistence. This is not an oxymoron. While there was a notable degree of social mobility across two adjacent generations, wealth status tended to persist over longer horizons, driven by latent factors transmitted across multiple, possibly non-adjacent generations. Social and political networks played a significant role in generating such persistence, with families embedded in marriage networks and political institutions better able to secure their wealth and status. Our findings provide a historical perspective on the long-term dynamics of wealth transmission and offer lessons for understanding contemporary patterns of economic mobility.
7 novembre 2024
DOUBLE PRICING OF GREENHOUSE GAS EMISSIONS IN SHIPPING: COMPETITIVENESS, CLIMATE, AND WHAT TO DO ABOUT IT
Goran Dominioni Christy Ann Petit
(synthesis; full article 06/11/2024https://cepr.org/voxeu/columns/double-pricing-greenhouse-gas-emissions-shipping-competitiveness-climate-and-what-do)
Abstract: International shipping faces significant challenges as emissions trading schemes expand, potentially leading to overlapping greenhouse gas pricing mechanisms. Concerns are rising among shipping companies that double pricing could reduce their competitiveness and raise costs. This column identifies three potential scenarios in which emissions from international shipping could become subject to multiple GHG pricing instruments, and suggests that one way to avoid double pricing would be to implement a crediting mechanism whereby payments made under one instrument are credited under the other.
Keywords: emission trading, shipping, climate change, international trade
International shipping is the backbone of the global economy, accounting for about 80% of international trade (Vuillemey 2020). As the EU extends the application of its Emissions Trading System (EU ETS) to international shipping and the International Maritime Organization (IMO) works on the adoption of a greenhouse gas emissions (GHG) pricing mechanism for the same sector, the prospect of GHG emissions from international shipping being subject to multiple pricing instruments is becoming more likely. While it is common for pricing instruments to overlap in other sectors (Agnolucci et al. 2023), some shipping companies have expressed concerns about the double pricing of GHG emissions, as this may reduce their profits and competitiveness. Similarly, as higher shipping costs can result in higher prices of transported goods (Ostry et al. 2022), some countries are worried about its potential to reduce trade opportunities, and that it may result in negative impacts in terms of GDP and food security.
In a recent paper (Dominioni and Petit 2024), we identify three potential scenarios in which emissions from international shipping could become subject to multiple GHG pricing instruments:
- A first scenario is two or more jurisdictions implementing overlapping GHG pricing instruments for international shipping at the sub-global level, both targeting downstream emissions (i.e. emissions from vessels). Besides the extension of the EU ETS to international shipping, various jurisdictions are considering the implementation of a GHG pricing instrument for this sector, such as the US International Maritime Pollution Accountability Act of 2023.
- A second scenario is the IMO implementing a GHG pricing instrument which overlaps with another sub-global GHG pricing instrument targeting downstream emissions, such as the EU ETS or a pricing instrument from another jurisdiction.
- Lastly, a third scenario is the IMO or another jurisdiction implementing a GHG pricing mechanism that also covers upstream emissions, such as emissions released in the production of liquefied natural gas used as a bunker fuel.
Should double pricing be avoided at all costs?
GHG pricing and other GHG policies for shipping may impact the competitiveness of shipping companies and countries, even though research indicates that these impacts tend to be small on average (Cariou et al. 2023, Rojon et al. 2021). Double pricing could entail a further reduction in competitiveness for shipping companies, as a result of needing to comply with two or more GHG mechanisms simultaneously, and a further reduction in trade opportunities for some countries. However, the case for avoiding double pricing rests on a balancing of interests and on how these instruments are implemented in practice.
Higher carbon prices normally result in greater emissions abatements (Känzig and Konradt 2023). If the IMO implements weak GHG policies, additional climate policies – including GHG pricing – from the EU and other countries would be essential to ensure a fast decarbonisation of the shipping sector. Indeed, research suggests that marginal abatement costs to reach net-zero carbon emissions by 2050 are around $300 per tonne of carbon (Longva et al. 2024).
In addition, some potential negative effects of double pricing may be mitigated through instrument design. For instance, World Bank research indicates that using a share of carbon revenues from shipping to improve port efficiency or support the deployment of zero-carbon bunker fuels can reduce the potential negative impacts of GHG pricing on vulnerable countries and shipping companies (Dominioni and Englert 2022). The cost incurred by companies in complying with multiple GHG pricing instruments can also be reduced through the harmonization of those instruments (e.g. on verification and reporting).
Thus, overall, the case against double pricing rests on contingent factors, many of which are in the hands of policymakers working on these policies.
What could be done to avoid double pricing?
If policymakers decide to avoid the double pricing of GHG emissions from shipping, one way to do so would be to implement a crediting mechanism, whereby payments made under one instrument are credited (i.e. discounted) under the other. That is, a shipping company would pay a price on its GHG emissions under one instrument, and this payment would be subtracted from the payment of another instrument.
Implementing a crediting mechanism such as the one discussed above requires establishing some level of comparability of different GHG pricing instruments. This may be relatively easy for some GHG instruments, but more complicated for more complex ones (Dominioni and Esty 2023). Luckily, there is a growing body of research concerned with developing methodologies to compare different types of GHG pricing instruments (Agnolucci et al. 2023). This knowledge could be harnessed in the maritime transport sector to avoid double pricing.
This knowledge can also help the IMO to implement a GHG pricing instrument for international shipping that is considered at least as ‘equivalent’ to the EU ETS. Currently, the EU plans to review the extension of the EU ETS to international shipping in 2027, taking into account the GHG pricing mechanism adopted by the IMO in the meantime. An IMO GHG price equivalent to the EU ETS may prevent a further expansion of the latter (currently the EU ETS covers only a fraction of GHG emissions released in transporting goods from and to the EU) and, potentially, even its retraction from shipping. It is worth noting that, during an event in October 2024, the European Commission, represented by a senior official from the directorate-general for Mobility and Transport (DG Move), was reported as reassuring that the EU stands ready to take into account the forthcoming IMO global instrument and adapt the EU ETS in line with the ETS Directive review clause to “avoid any significant double burden”. (Lowry 2024).
Who can help shipping policymakers to avoid double pricing?
Much of the knowledge on establishing equivalence between GHG policies – including carbon pricing – has been created in the context of the implementation of border carbon adjustment mechanisms, i.e. charges on the GHG emissions embedded in internationally traded products.
In our paper, we identify different pathways through which regulatory cooperation can take place. Various countries that have or are planning to implement border carbon adjustment mechanisms, as well as institutions like the OECD, the IMF, the World Bank, and the WTO, are developing significant knowledge on comparing policies that put a price on carbon (e.g. Agnolucci et al. 2023, IMF 2019, OECD 2023). If double pricing in shipping is to be avoided, these is a case for this knowledge to be shared with IMO policymakers and other teams that work in jurisdictions which implemented or are implementing domestic GHG pricing mechanism for international shipping.
Border carbon adjustments mechanism can also include crediting mechanisms similar to those that may be implemented to avoid double pricing in international shipping. For instance, the EU Carbon Border Adjustment Mechanism (CBAM) credits for carbon pricing instruments implemented in countries that export to the EU (European Parliament and Council of the European Union 2023). Policymakers working on border carbon adjustment mechanism could also contribute their expertise on how to design crediting mechanisms to the IMO and within sub-global discussions on the implementation of GHG pricing for international shipping.
On this basis, we argued in favour of regulatory cooperation between the IMO, IMF, OECD, World Bank and the WTO, as well as policymakers working on shipping decarbonisation and border carbon adjustment mechanisms at the EU or national level.
4 settembre 2024
THE MACROECONOMICS OF NARRATIVES
(synthesis; full article 30/08/2024 https://cepr.org/voxeu/columns/macroeconomics-narratives)
Abstract: The idea of an episode of negative sentiment causing poor economic performance has gained prominence in the press and drawn attention from policymakers struggling to read contradictory macroeconomic signals. This column applies natural language-processing tools to assess the importance of narratives for the US business cycle. The analysis suggests that contagious narratives are an important driving force in the business cycle, but not all narratives are equal in their potential to shape the economy, and the fate of a given narrative may rest heavily on its (intended or accidental) confluence with other narratives or economic events.
Keywords: politics and economy, macroeconomic policy, narratives, business cycle.
Can a negative mood tank the economy? Recently, discussion about a ‘vibe-cession’, or an episode of negative sentiment that might cause poor economic performance, has gained prominence in the financial press (Scanlon 2022a, 2022b, Keynes 2023) and drawn serious attention from policymakers struggling to read contradictory macroeconomic signals (Federal Open Market Committee 2024).
The idea that emotional states may affect the economy has a long intellectual history. John Maynard Keynes regrettably missed his chance to coin ‘vibe-cession’, but he wrote extensively about how peoples’ instinctive ‘animal spirits’ drove crashes and recoveries. Taking this idea one step further, economist Robert Shiller has advocated for a more detailed study of economic narratives, or contagious stories that shape how individuals view the economy and make decisions. Viral narratives could be the missing link between emotions and economic fluctuations. But, as economic modellers, we currently lack effective tools to measure these narratives, model their possible impacts on the economy, and quantify their contribution toward economic events.
Our recent research (Flynn and Sastry 2024) makes a first attempt to understand the macroeconomic consequences of narratives. We introduce new tools for measuring and quantifying economic narratives and use these tools to assess narratives’ importance for the US business cycle.
Measuring narratives using natural language processing
To measure narratives, we use resources not available to Keynes: large textual databases of what economic decisionmakers are saying and natural language-processing tools that can translate this text into hard data. Specifically, we study the text of US public firms’ SEC Form 10-K, a regulatory filing in which managers share “perspectives on [their] business results and what is driving them” (US Securities and Exchange Commission 2011), and their earnings report conference calls. We process these data using three methods designed to capture different facets of firms’ narratives: (i) a sentiment analysis; (ii) a textual similarity analysis that looks for connections to the “perennial economic narratives” that Shiller (2020) identifies as particularly influential in US history; and (iii) a fully algorithmic ‘latent dirichlet allocation’ model that looks for any repeating patterns in firms’ language. Using these methods, we obtain quantitative proxies for the narratives that firms use to explain their business outlook over time – for example, firms’ general optimism about the future, their excitement about artificial intelligence trends, or their adoption of new digital marketing techniques.
Narratives shape firms’ decisions and spread contagiously
In our data, we find that firms with more optimistic narratives tend to accelerate hiring and capital investment. This effect is above and beyond what would be predicted by firms’ productivity or recent financial success. Strikingly, firms with optimistic narratives do not see higher stock returns or profitability in the future and also make over-optimistic forecasts to investors. That is, firms’ optimistic and pessimistic narratives bear the hallmarks of Keynes’ ‘animal spirits’: forces that compel managers to expand or contract their business but do not predict future fundamentals.
We next find that narratives spread contagiously. That is, firms are more likely to adopt the narratives held by their peers, both at the aggregate level and within their industries. The narratives held by larger firms have an especially pronounced effect. Thus, consistent with Shiller’s hypothesis, narratives can spread like a virus: once some take a gloomy outlook in their reports or earnings calls, others follow suit.
Narratives drive about 20% of the business cycle
To interpret these results, and leverage them for quantification and prediction, we develop a macroeconomic model in which contagious narratives spread between firms. Because narratives are contagious, they naturally draw out economic fluctuations: even a transient, one-time shock to the economy can have long-lasting effects because a negative mood infects the population and holds back business activity. Sufficiently contagious narratives that cross a virality threshold can induce a phenomenon that we call narrative hysteresis, in which one-time shocks can move the economy into stable, self-fulfilling periods of optimism or pessimism. In these scenarios, there is a powerful positive feedback loop: economic performance feeds a narrative that reinforces the economic performance. These findings underscore the importance of measurement to discipline exactly how much narratives affect the economy.
Figure 1
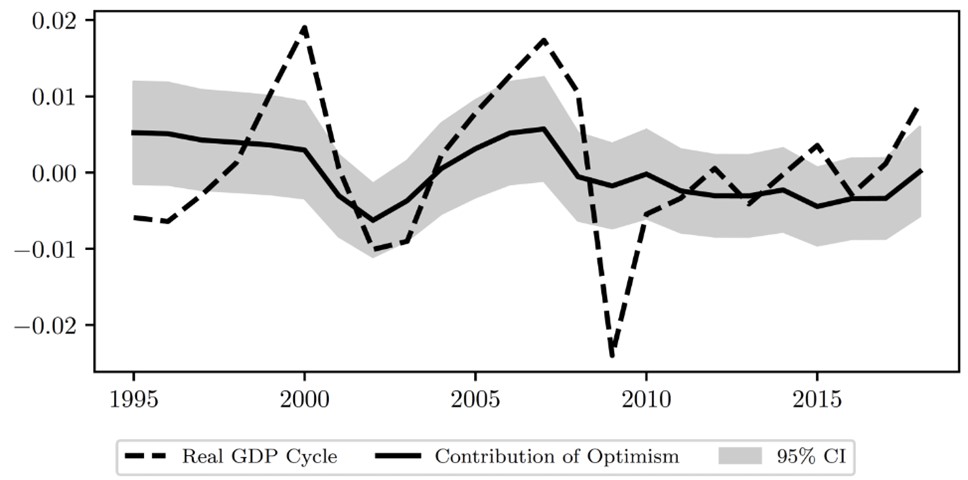
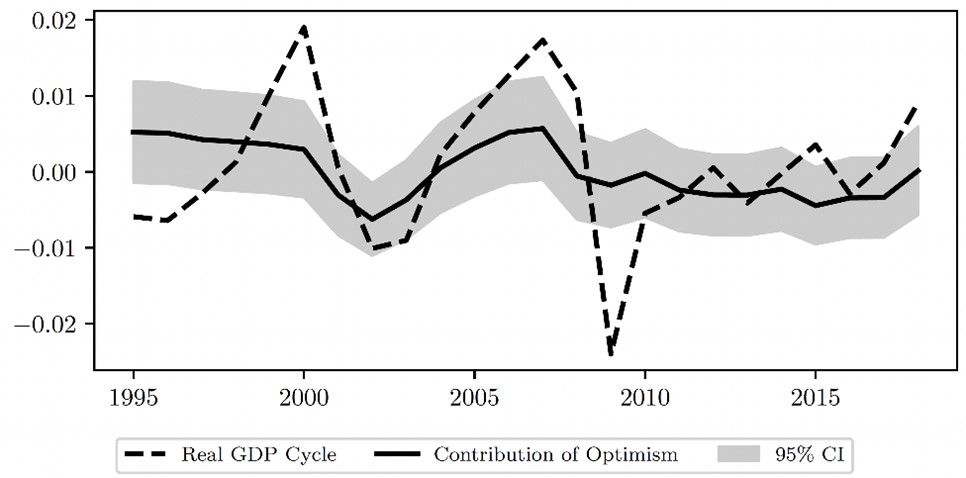
Note: The dashed line plots the US business cycle from 1995 to 2018. The solid line, based on our analysis, is the contribution of contagious narratives toward business-cycle fluctuations. The shaded area is a 95% confidence interval based on statistical uncertainty in our estimates.
How strong are the narratives driving the US economy? Combining our empirical results with our theoretical model, we estimate that narratives explain about 20% of the US business cycle since 1995 (Figure 1). In particular, we estimate that narratives explain about 32% of the early 2000s recession and 18% of the Great Recession. This is consistent with the idea that contagious stories of technological optimism fuelled the 1990s Dot-Com Bubble and mid-2000s Housing Bubble, while contagious stories of collapse and despair led to the corresponding crashes. Our analysis, building up from the microeconomic measurements of firms’ narratives and decisions, allows us to quantify these forces.
When can economic narratives ‘go viral’?
Our findings suggest that optimistic narratives generate business cycles, but do not truly ‘go viral’ and generate narrative hysteresis. Figure 2 visualises this by showing how much narratives might have affected output if they were counterfactually more prone to virality. We focus on two key parameters disciplined by our measurement: the ‘stubbornness’ with which firms maintain existing narratives, and the ‘contagiousness’ with which narratives spread. Our main estimate, denoted with a large “x”, is far from the virality threshold we derive theoretically (denoted by a dashed line). If the narrative were associated with greater stubbornness or contagiousness, then narrative dynamics would be considerably more violent – potentially explaining almost all of the business cycle, in the most extreme calibrations.
Figure 2

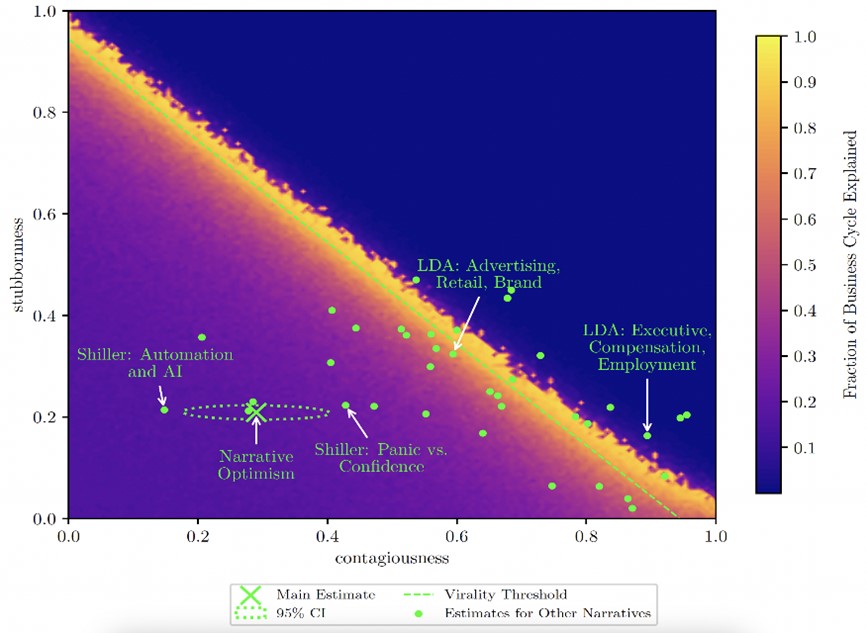
Note: This figure illustrates the tendency of business-cycle narratives toward virality. The horizontal and vertical axis respectively denote measurable contagiousness (how much a narrative spreads) and stubbornness (how much proponents stick to their narrative). The “x” corresponds to our measurement for the main narrative affecting US business cycles, and the dots correspond to our measurements for more granular narratives. Selected narratives are labelled. The shading denotes how much of the business cycle the narrative explains for a given level of contagiousness and stubbornness. The dashed line denotes the theoretical virality threshold that determines whether narrative hysteresis is possible.
Does that mean that all economic narratives lead tranquil lives? Not necessarily. In further analysis, we study the spread and effect of more granular narratives picked up by our other natural language-processing analysis. These narratives are associated with higher stubbornness and virality and are therefore more prone to ‘going viral’ (as denoted by the small circles). Viewed from afar, the narratives in the US economy form a constellation whose stable behaviour on average belies more violent individual fluctuations. This is consistent with the idea that ‘vibe-cessions’ are slow-moving, but more specific fears and fads move quickly.
Policymaking in the narrative economy
Our analysis suggests that contagious narratives are an important driving force in the business cycle. But it also qualifies this conclusion in important ways. Not all narratives are equal in their potential to shape the economy, and the fate of a given narrative may rest heavily on its (intended or accidental) confluence with other narratives or economic events.
How should policymakers act in a narrative-driven economy? Our analysis has at least three major conclusions, which also suggest future directions for both academic and policy research.
First, what people say about their economic situation is highly informative about both individual attitudes and broader trends in the economy. Public regulatory filings and earnings calls already contain considerable information. Both policymakers and researchers can use improved machine-learning algorithms and data-processing tools to analyse this information. There are also possible implications for how researchers and governments collect information. The same data-science advancements have increased the value of novel surveys that allow households or businesses to explain the ‘why’ behind their attitudes and decisions (e.g. Wolfhart et al. 2021).
Second, some narratives are more influential and contagious than others. It is therefore important to combine descriptive studies measuring narratives with empirical analysis of their effects on decisions and their spread throughout populations.
Third, the narratives introduced by policymakers could be potentially very impactful. We know relatively little about what makes a policy narrative into a great story that spreads contagiously and affects the economy on its own. Understanding these dynamics is an important area for future research.
7 agosto 2024
POLITICAL EXPRESSION OF ACADEMICS ON SOCIAL MEDIA
(synthesis; full article 30 july 2024 Vox Eu CEPR https://cepr.org/voxeu/columns/political-expression-academics-social-media)
Abstract: Social media platforms allow for immediate and widespread dissemination of scientific discourse. However, social media may distort public perceptions of academia through two channels: the set of topics being discussed and the style of communication. This column uses a global dataset of 100,000 scholars to study the content, tone, and focus of their social media communications. It finds systematic differences in the views expressed by academics and the general public, in both the topics and the tone of discussion. There are also clear differences between academics, depending on their gender, field, country of affiliation, and university ranking.
Keywords: politics and economy, social media, trust in scientists, academy.
Social media platforms may be important marketplaces for the exchange and dissemination of ideas, where academics and researchers hold significant roles as knowledge producers and influencers (Cagé et al., 2022, Gentzkow and Shapiro 2011). Policymakers may actively scout these platforms for policy insights or ideas, while journalists increasingly rely on digital sources like Twitter to shape news agendas (Muck Rack, 2019). The backlash against the journal Nature’s endorsement 1 of Joe Biden in the 2020 US presidential election illustrates the risks of political expression in scientific discourse, highlighting its potential to polarise public trust (Zhang 2023). This example raises questions about whether academics should maintain political identities when expressing views, to safeguard public trust in their scholarly independence and expertise.
The COVID-19 pandemic has highlighted the importance of trust to ensure compliance with public health measures that are rooted in hard science (Algan et al., 2021). Concerns also arise over the disconnect between academics and the public on issues like Brexit or populism more broadly, influenced by biases associated with political affiliations (Den Haan et al. 2017, Mede and Schäfer 2020) and differing perspectives on economic policies (Fabo et al. 2020).
The upsides of academic engagement on social media, by providing new and more direct ways of science communication, may inadvertently shape public perceptions of academia through selective topic engagement and differences in communication styles. Unlike traditional media, social media allows for immediate and widespread dissemination of scientific discourse. Most academics are not trained in such communication. Further, not all academics engage with social media, meaning that those who do may disproportionately influence public perceptions of academia through both the specific topics they choose to discuss and the styles and tones in which they communicate. Our new paper explores patterns in academics’ political expressions using a global dataset linking the Twitter profiles of 100,000 scholars to their academic records, spanning institutions across 174 countries and 19 disciplines from 2016 to 2022 (Garg and Fetzer 2024). Leveraging scalable large-language model (LLM) classification techniques, we analyse the content, tone, and substantive focus of their communications.
We document large and systematic variation in politically salient academic expression concerning climate action, cultural, and economic concepts. Views expressed by academics often diverge from the general public opinion in both the topics they focus on and the styles in which they are communicated.
Key findings
Finding 1: Academics are much more liberal and less toxic on Twitter than the general population
Academics on social media are markedly more vocal on politicised issues compared to the general population. Specifically, academics are 10.7 times more likely to express opinions in favour of climate action, 6.2 times more expressive about virtues of cultural liberalism, and 23.3 times more vocal about advancing economic collectivism than the average US social media user. However, academics consistently exhibit lower levels of toxicity and emotionality in their discourse compared to broader US Twitter users, with toxicity rates halving to around 4%, while the general population maintains rates between 8-9%. This divergence in political expression and communication style may contribute to public misconceptions about academic consensus, potentially affecting public trust in academia and influencing policy debates.
Figure 1 Differences in academic expression between academics and general population in the US
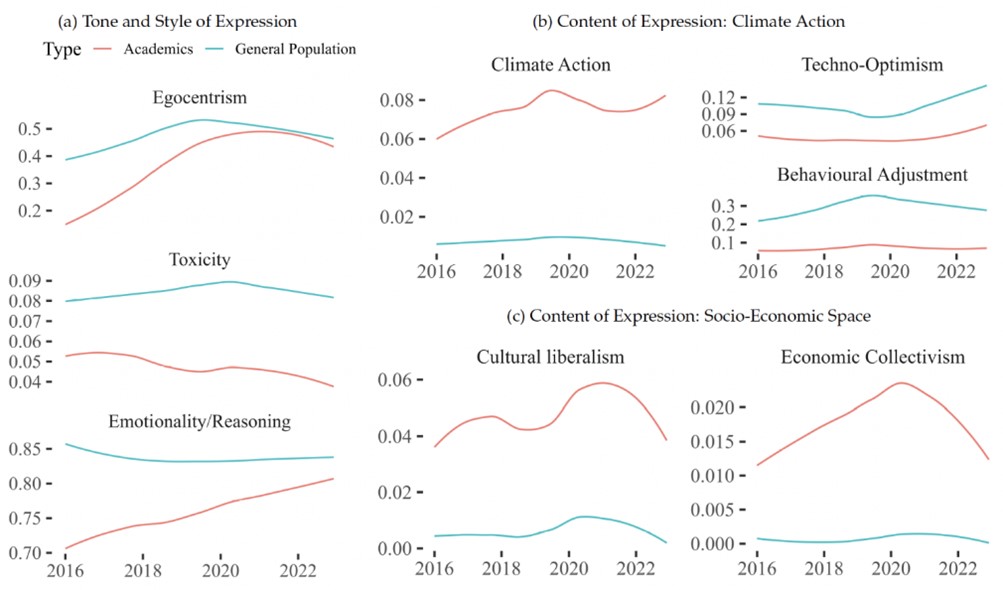
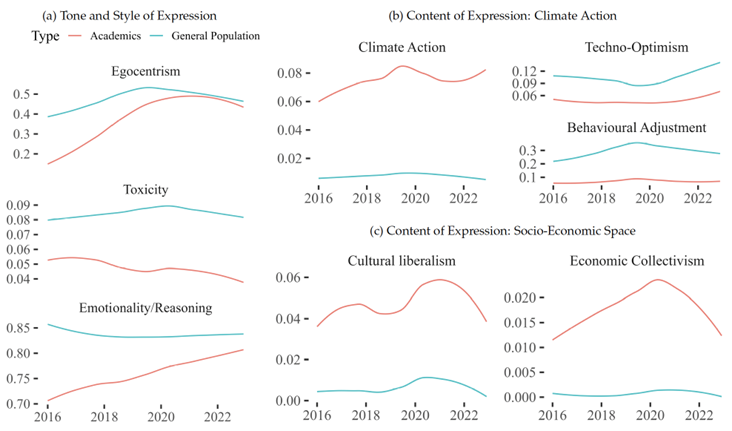
Note: This figure explores the divergences in expression between academics and the general US Twitter population, leveraging two distinct datasets: one comprising tweets from 100,000 US-based academics and another from a sample of 60,000 users representative of the general US Twitter population. The analysis highlights notable differences in both behavioural expression and political stances from January 2016 to December 2022.
Finding 2: American professors tend to be more egocentric and toxic on social media, but professors from other countries tend to be nicer than average
We find big differences in the tone and style of expression between academics, characterised by their field, institutional ranking, gender, and country of affiliation. Academics based in the US and those from top-ranked institutions tend to exhibit higher levels of egocentrism and toxicity on social media. In contrast, academics from other countries generally demonstrate lower levels of toxicity in their online discourse. We also find that humanities scholars and academics with extensive Twitter reach but lower academic prestige display heightened egocentrism. Conversely, academics with lower Twitter reach, regardless of academic standing, and those associated with top 100 universities, exhibit elevated toxicity levels compared to their counterparts.
Figure 2 How academics express themselves online: Average by author characteristics
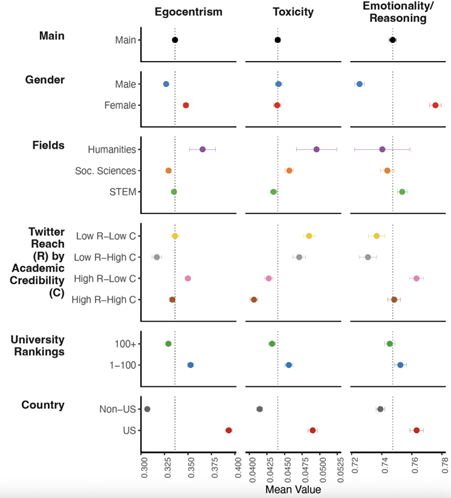
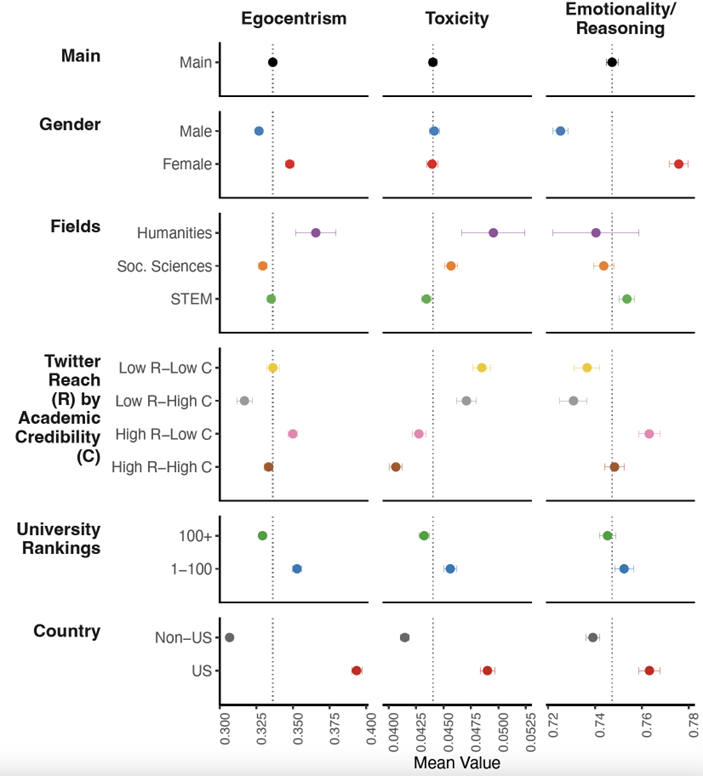
Note: This figure presents the average levels of three behavioural metrics—Egocentrism, Toxicity, and Emotionality/Reasoning—quantified from tweets by a balanced panel of academics from 2016 to 2022, using data linking 100,000 Twitter profiles to their academic profiles. Each panel categorises data by specific groups such as gender, fields, Twitter reach, and academic credibility, university rankings, and country. 95% confidence intervals are indicated by error bars.
Finding 3: Climate action: Discipline polarisation and expert selection
On average, academics are 10.7 times more vocal in advocating for climate action. Male academics exhibit a stronger preference for technological solutions over behavioural adjustments to tackle climate change. STEM scholars prioritise technological solutions, reflecting their focus on innovation and engineering approaches, while social sciences and humanities scholars often emphasise behavioural adjustments and societal transformations as primary solutions. This diversity in academic emphasis allows policymakers to select experts whose perspectives align with their policy goals. Moreover, academics affiliated with top-ranked US universities, and those with larger social media followings but lacking expertise in climate issues, show relatively lower support for proactive climate measures.
Figure 3 How academics talk about climate action online: Average by author characteristics
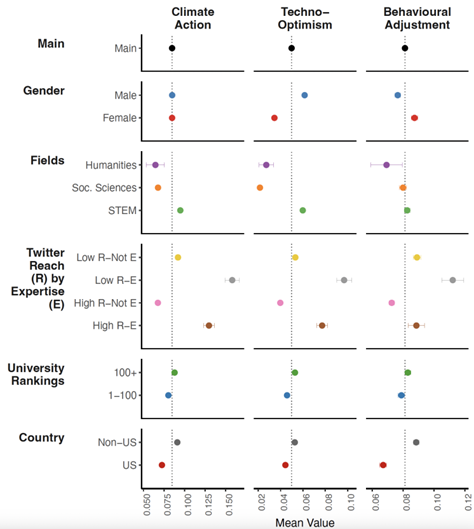

Note: This figure illustrates academics’ average stances on three pivotal climate change policy topics—Climate Action, Techno-Optimism, and Behavioural Adjustment—across different academic groups and personal characteristics, using a sample of 138 million tweets made by 100,000 academics between 2016 and 2022. 95% confidence intervals are indicated by error bars.
Implications
The over-representation of certain views – especially from high-reach, low-expertise academics – and the under-representation of other views could result in distorted or poor communication of science. Given these complexities, it is crucial for the academic community to engage in a more inclusive and balanced manner, ensuring that the marketplace of ideas on social media enriches rather than distorts public discourse and policy formulation. Further research should aim to quantify the impact of these ideological divisions on public trust and explore strategies for mitigating potential biases in academic communication on social media. Additional research is required to explore why academics express themselves politically, considering motivations such as name recognition, ideological drive, and the desire to share or evangelise knowledge.
Authors’ note: For a more detailed analysis and access to the dataset, please refer to our full research paper (Garg and Fetzer 2024) and visit our project website for additional results and data release information.
29 maggio 2024
LARGE, BROAD-BASED MACROECONOMIC AND FINANCIAL EFFECTS OF NATURAL DISASTERS
Sandra Eickmeier, Josefine Quast, Yves Schüler
(synthesis; full article 26 may 2024 Vox Eu CEPR https://cepr.org/voxeu/columns/https://cepr.org/voxeu/columns/large-broad-based-macroeconomic-and-financial-effects-natural-disasters)
Abstract: As the planet warms, the escalation in both frequency and severity of natural disasters be-comes a pressing concern. This column uncovers significant, sustained adverse effects of natural disasters on the US economy and financial markets. Disasters disrupt economic ac-tivity across labour, production, consumption, investment, and housing sectors. These dis-ruptions stem from increased financial risk and uncertainty, declining confidence, and height-ened awareness of climate change. Additionally, disasters cause a temporary spike in con-sumer prices, primarily due to surges in energy and food costs. The findings underscore the critical need for immediate action against climate change and the enhancement of economic and financial resilience to mitigate these impacts.
Keywords: climate change, natural disasters, financial markets, consumer prices, macroeconomic policy, US economy
As climate change intensifies, its impacts become increasingly undeniable. July 2023 stands out as the hottest month ever recorded on Earth (Thompson 2023). Projections indicate that the frequency and severity of extreme weather events, including natural disasters, will continue to escalate with advancing climate change (IPCC 2014, 2022). As the bulk of the social and economic costs are yet to fully materialise, discussions among economists and policymakers regarding the economic and political ramifications of climate change are gaining momentum (e.g. Carney 2015, Batten 2018, Olovsson 2018, Rudebusch 2019, Batten et al. 2020, Lagarde 2020, ECB 2021, Vives et al. 2021, Gagliardi et al. 2022, Pleninger 2022).
Indeed, the repercussions of climate change inevitably intersect with the primary objectives of central banks and fiscal authorities, despite climate change mitigation not being their primary mandate. For instance, central banks must deepen their understanding of how natural disasters and broader climate change phenomena impact economic activity, inflation, and financial stability, along with comprehending the transmission mechanisms underlying these impacts. For fiscal authorities, understanding these impacts is essential as well. Climate change could strain public debt levels, complicating their management and potentially heightening the vulnerability of public finances. Anticipating and accommodating the impact of climate change is thus crucial for the policy decisions of central banks and fiscal authorities and, more broadly, for their support of the societal transition to a carbon-neutral economy.
In Eickmeier et al. (2024), we examine the dynamic transmission of natural disasters to the US aggregate economy. We focus on those disasters that are expected to intensify due to climate change, i.e. severe floods, storms, and extreme temperature events. We rely on local projections using monthly data over the pre-pandemic sample since 2000. Our impulse variable reflects the number of natural disaster events in the US in a given month (Figure 1), and we examine the effect of a one standard deviation increase in that variable (which amounts to 1.7 disasters). In this column, we show responses of selected variables to the disasters. The full set of impulse responses can be found in Eickmeier et al. (2024).
Figure 1 Number of natural disasters per month in the US
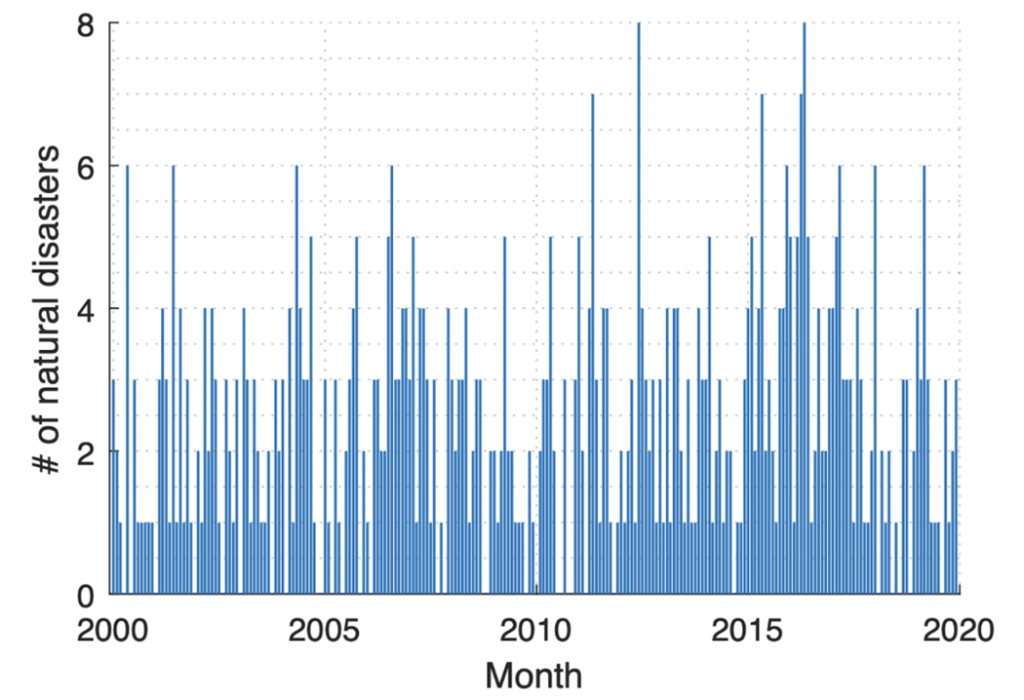
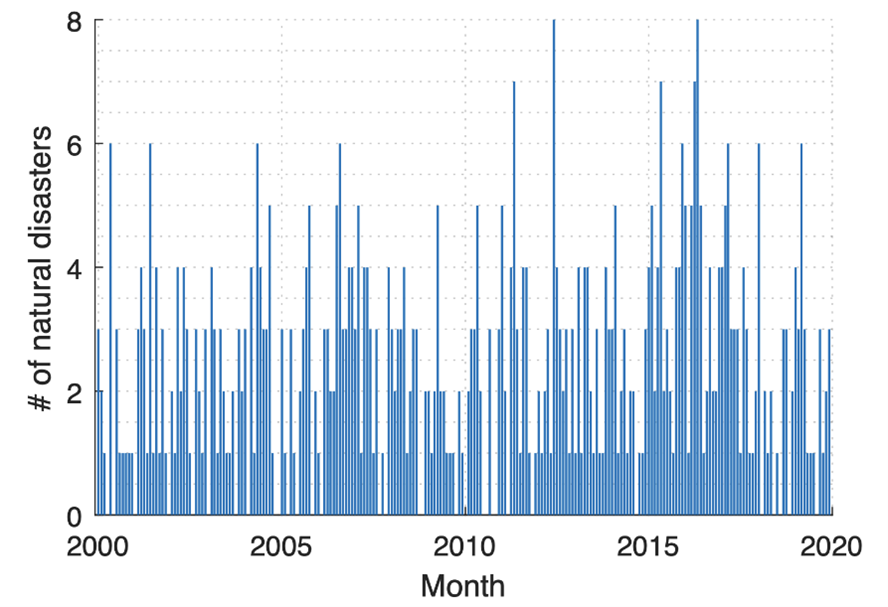
Notes: Number of extreme temperature events, floods, and storms in a given month.
Profound and widespread adverse effects of natural disasters
We find that natural disasters trigger significant and enduring negative aggregate impacts on the real economy. The unemployment rate rises gradually and persistently by 0.5 percentage points (Figure 2). The real effects are broad-based, as they manifest across various sectors, including labour and housing markets, production, consumption, and investment. Furthermore, our analysis reveals that disasters temporarily elevate consumer prices, likely driven by transient increases in energy and food costs (see Figure 3).
Figure 2 Impulse responses of unemployment rate (percentage points) and consumer prices (%)

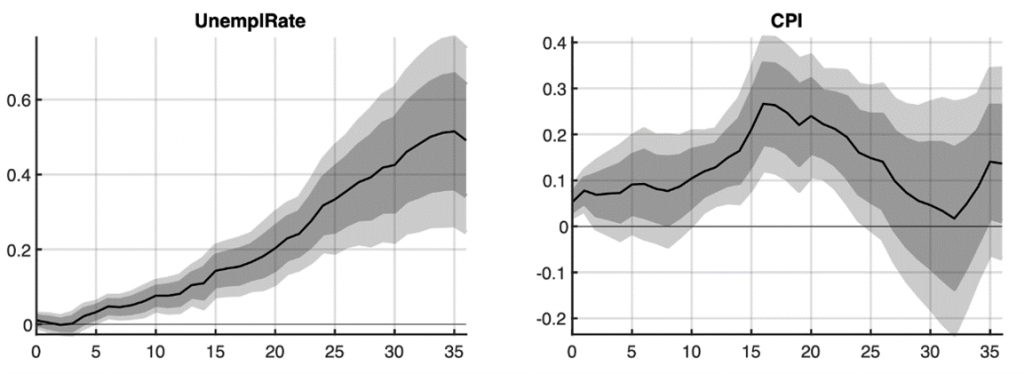
Notes: Grey areas indicate 68% and 90% confidence bands. x-axis: months.
Figure 3 Impulse responses of core consumer prices, food prices, and energy prices (%)
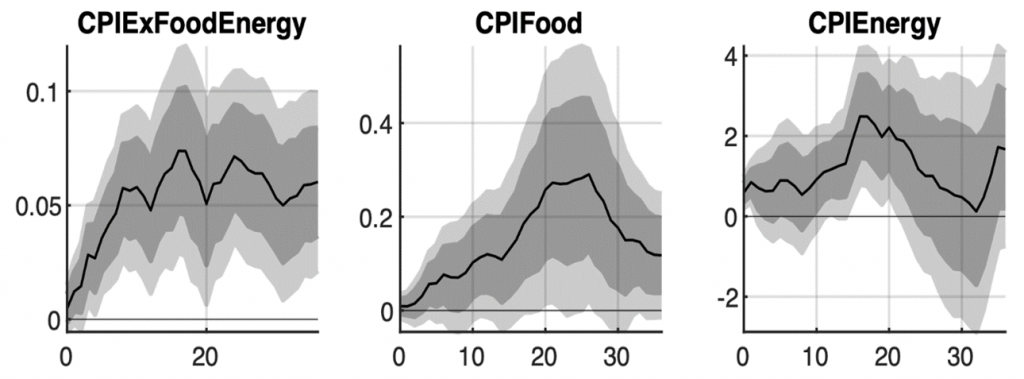
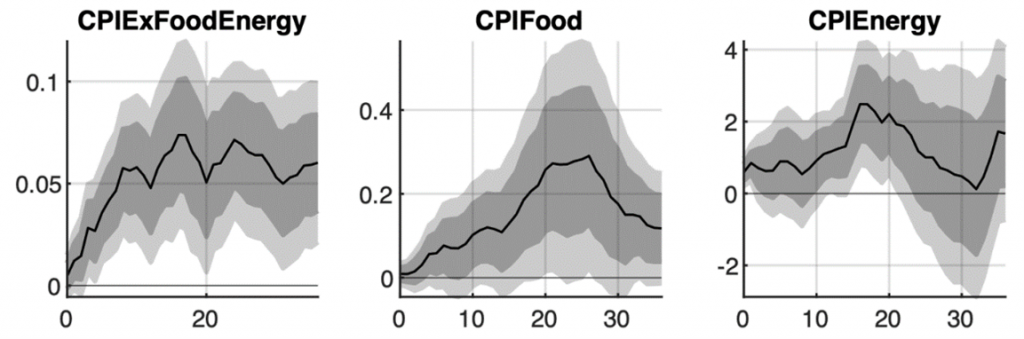
Notes: CPIExFoodENergy: consumer price index excluding food and energy prices, CPIFood: food-specific consumer price index, CPIEnergy: energy-specific consumer price index. Grey areas indicate 68% and 90% confidence bands. x-axis: months.
The adverse real effects can be attributed to a widespread decline in confidence, an increase in uncertainty, a tightening of broad financial conditions, encompassing financial risk perceptions, and heightened awareness of climate change (see Figure 4). Indeed, climate attention can serve as an additional channel of transmission. The way individuals perceive the link between natural disasters and climate change likely influences their adaptation strategies, preferences, and broader behaviour, thereby impacting the real economy. We also observe a widespread rise in bank risk and the economy’s susceptibility to future bank risk following the disasters, coupled with a decrease in holdings of (comparatively secure) treasury securities. Conversely, banks appear to be adjusting their portfolios toward safer business and real estate loans, potentially to mitigate the heightened risk.
Figure 4 Impulse responses of confidence, media attention toward climate change, and financial uncertainty and risk (%)

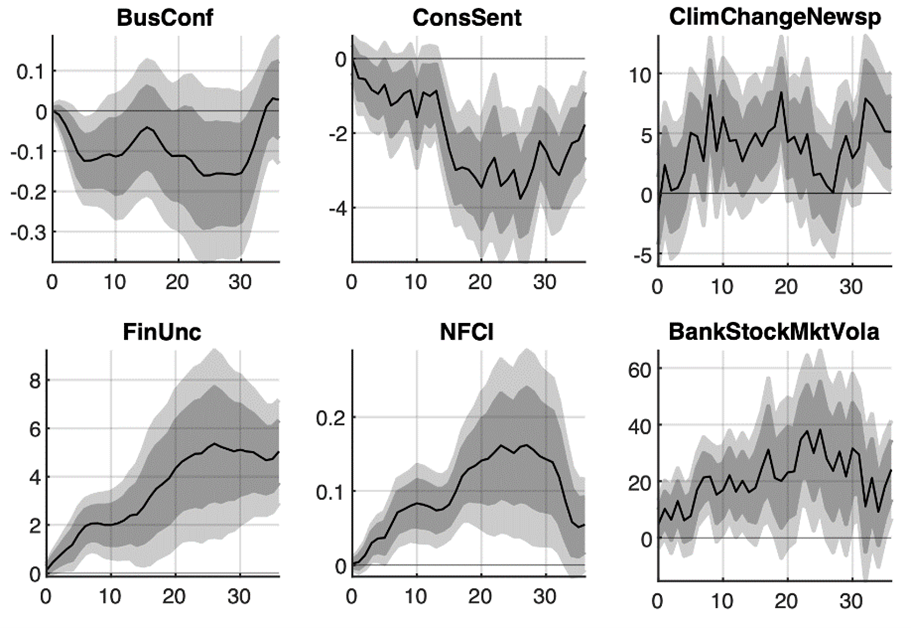
Notes: BusConf: business confidence index, ConsSent: consumer sentiment, ClimChangeNewsp: newspaper coverage on climate change. Financial uncertainty based on Jurado et al. (2015), NFCI (in ordinary units): Chicago Fed national financial conditions index, BankStockMktVola: bank stock market volatility. Grey areas indicate 68% and 90% confidence bands. x-axis: months.
Monetary and fiscal policy variables move in the direction that could contain negative macroeconomic impacts (see Figure 5). Anchored inflation expectations appear to help contain price pressures. However, we find a persistent increase in public debt relative to GDP, exposing the US government to heightened vulnerability in future adverse scenarios. Furthermore, our results suggest a long-lasting decline of r star, limiting future space to manoeuvre for monetary policy as well.
Figure 5 Impulse responses of monetary policy and fiscal variables (% for government spending, percentage points for all other variables)
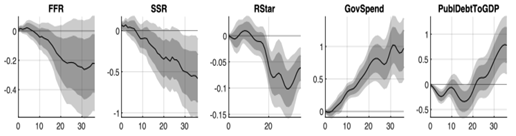

Notes: FFR: fed-eral funds rate, SSR: shadow short rate provided by Wu & Xia (2016), RStar: one-sided estimate for r-Star by Laubach & Williams (2003), GovSpend: government total expenditures, PublDebtToGDP: total public debt in % of GDP. Grey areas indicate 68% and 90% confidence bands. x-axis: months.
Our results are robust against a large variety of alterations. For instance, we consider individual disaster types, i.e. storms, floods, extreme temperature events, separately; we exclude Hurricane Katrina and the subsequent months from the analysis; we also account for persistence of the impulse variable; and we vary the lag structure of our local projections setup. In a complementary analysis, we analyse the impact of media attention toward climate change on the macroeconomy and find effects on the unemployment rate and consumer prices that are comparable to those following natural disasters. Furthermore, we demonstrate that the effects of natural disasters at the aggregate level differ markedly from their local impacts, reconciling studies which consider local effects of local disasters and those which examine aggregate effects.
As a caveat, just like previous empirical papers, our analysis captures past adjustments. Yet, most of the costs and adjustments are yet to materialise as natural disasters are projected to intensify and occur more frequently. Furthermore, as people increasingly associate these events with climate change, the manner in which the economy adjusts will critically hinge upon individual and collective behavioural responses, making their duration, sign, or size challenging to predict. Despite these uncertainties, we feel confident that our research contributes to a better understanding of the aggregate effects of natural disasters and informs policymakers on possible interventions which could lead to better outcomes.
Summary
Overall, our analysis underscores the profound and widespread negative impacts of natural disasters on the real economy, financial markets, and crucial policy variables. This highlights the urgent need for immediate actions to combat climate change and bolster economic and financial resilience. While our findings indicate that macroeconomic policies have provided some support during these disasters, suggesting possible ways to mitigate their economic impacts, the sustainability of these measures remains in question amidst ongoing climate change. Specifically, as climate change continues to exert downward pressure on r star and elevate public debt levels, the effectiveness of monetary and fiscal policies in managing the economic repercussions of natural disasters may be compromised. Enhancing economic and financial resilience against such shocks becomes increasingly paramount, underscoring the need for immediate and strategic actions to combat climate change and its far-reaching effects.
21 maggio 2024
THE ECONOMICS OF SOCIAL MEDIA
Guy Aridor, Rafael Jiménez-Durán, Ro’ee Levy, Lena Song
(synthesis; full article 20 may 2024 Vox Eu CEPR https://cepr.org/voxeu/columns/economics-social-media )
Abstract: The growing interest in regulating the market power and influence of social media platforms has been accompanied by an explosion in academic research. This column synthesises the research on social media and finds that while it has made dramatic progress in the last decade, it mostly focuses on Facebook and Twitter. More research is needed on other platforms that are growing in usage, such as TikTok, especially since these platforms tend to produce different content, distribute content differently, and have different consumers. Studying these changes is crucial for policymakers to design optimal regulation for social media’s future.
Keywords: digital markets, social media, algorithms, social behavior. Digital Markets Act Digital Services Act
The Digital Markets Act (Scott Morton and Caffarra 2021) and the Digital Services Act highlight the growing interest in regulating the market power and influence of social media platforms. This heightened policy interest, paired with the explosion in academic research studying social media (pictured in Figure 1), generates a demand for a synthesis of the rapidly expanding literature in order to help guide the many policy debates. In a recent paper (Aridor et al. 2024a), we synthesise and organise the literature around the three stages of the life cycle of social media content: (1) production, (2) distribution, and (3) consumption.
Figure 1 Social media research in economics
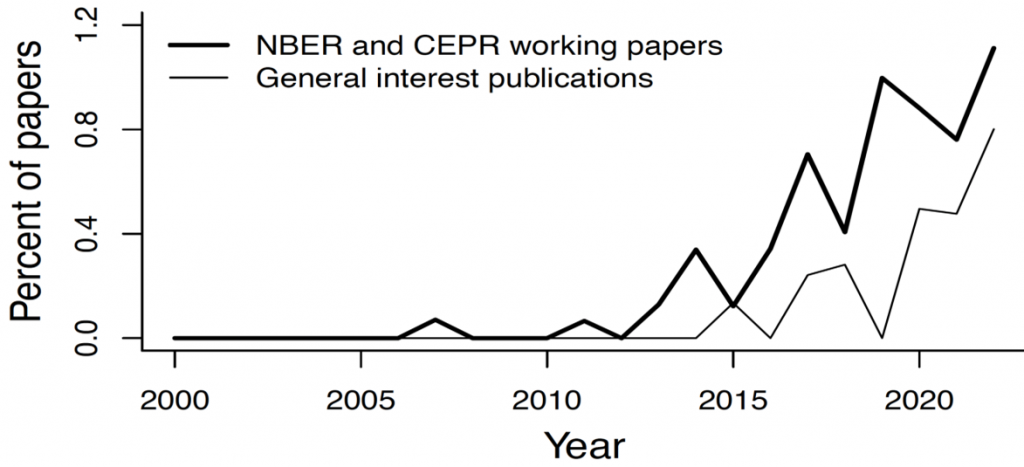

Source: Aridor et al. (2024)
Production of content
Social media platforms rely on user-generated content to attract users. Unlike traditional media that can directly shape content through editorial processes, social media platforms must rely on platform design – features, incentives, and rules – to influence content production. The challenge for platforms is to incentivise the creation of content that attracts user engagement and advertisers, while deterring the creation of harmful content such as misinformation and hate speech.
There is evidence that the production of content responds to different types of incentives. Non-monetary incentives such as peer awards or feedback (including badges, reactions, likes, and comments) have been shown to moderately increase the amount of content produced in the short run (Eckles et al. 2016). While monetary incentives could theoretically crowd out prosocial motives, the literature has also found strong positive effects of monetary incentives, such as ad-revenue sharing programmes, on content creation (Abou El-Komboz et al. 2023). As opposed to quantity, the quality of content produced – proxied, for instance, by the subsequent number of likes received – seems relatively more difficult to influence. Non-monetary incentives tend to have small effect sizes on quality (Zeng et al. 2022, Srinivasan 2023) and the evidence for monetary incentives is mixed (Sun and Zhu 2013, Kerkhof 2020).
Due to its social consequences, a policy-relevant dimension of content quality is whether it contains misinformation or ‘toxic content’ (e.g. hate speech). In terms of misinformation, a vast literature studies several types of interventions that seek to deter the production – mostly the re-sharing – of false articles, while keeping constant or even increasing the sharing of truthful information (Kozyreva et al. 2022, Pennycook and Rand 2022, Martel and Rand 2023). When comparing across interventions, nudging or prompting users to think about the prevalence of misinformation (Guriev et al. 2023) and digital literacy campaigns that train users to identify emotional manipulation (Athey et al. 2023) seem to be particularly effective. In terms of toxic content, reducing users’ exposure to toxicity (Beknazar et al. 2022) and some types of counterspeech – messages that reproach the producers of toxic content (Munger 2017) – have been found to deter the production of this type of content with small effect sizes. ‘Harder’ sanctions such as post deletions (Jiménez Durán 2022) tend to have null or at best small effect sizes.
Distribution of content
After content is produced, platforms distribute it to users. The distribution of content could be affected by users’ social networks and the platforms’ algorithms. There is an ongoing debate on whether and how to regulate the content that algorithms promote and downrank. Specifically, there is a concern that by promoting like-minded or low-quality content, algorithms may distort beliefs or polarize users (Aral 2021, Campante et al. 2023). The best evidence on this topic comes from Facebook. Based on both experimental variation (Levy 2021) and internal data (Gonzlez-Bailon et al. 2023), there is growing evidence that Facebook’s algorithms tend to promote like-minded content, though the effects are still being debated (Messing 2023). In terms of content quality, Facebook’s algorithm may increase the amount of uncivil content but also decrease exposure to untrustworthy accounts (Gonzalez-Bailon et al. 2023, Guess et al. 2023). These results are consistent with social media platforms trying to maximise engagement, while perhaps downranking specific posts due to other incentives, such as the platforms’ reputation. Other concerns regarding the algorithm have received less support in the literature. For example, YouTube’s recommendation system does not seem to drive users into extreme rabbit holes (Hosseinmardi et al. 2021, Chen et al. 2023).
In addition to distributing organic content, platforms distribute ads to users. In contrast to traditional advertising, ads on social media can accurately target users based on various characteristics and thus are especially valuable (Gordon et. al 2023; Tadelis et. al 2023). A key policy debate with regard to social media advertisements is how to balance the trade-off between the consumer welfare gains from privacy and the dependence of firms on advertising revenues. On the one hand, personal data are clearly valuable for firms. Wernerfelt et al. (2022) find that removing access to off-platform data would increase median acquisition costs for Facebook advertisers by 37%, and Aridor et al. (2024b) find that Apple’s App Tracking Transparency policy – which allowed consumers to opt out of sending this data to applications – led to significant revenue losses for Facebook-dependent direct-to-consumer firms. On the other hand, consumers may highly value maintaining the privacy of their data. Lin et. al (2023) elicit incentive-compatible valuations for consumers’ data and find that the distribution of privacy preferences is heavily skewed and that consumers most value protecting the privacy of their friend network and posts on the platform.
Consumption of content
Consumers allocate their time between consuming content served by the platform and off-platform activities. Their choices are influenced by consumption spillovers where others’ consumption choices influence how people use social media, habit formation where consumption today makes people want to use more in the future, and self-control problems where people use social media more than they would like to (Eckles et al. 2016, Allcott et al. 2020, Allcott et al. 2022, Aridor 2023).
These choices affect the wellbeing of consumers. Experiments eliciting how much users need to be paid to stop using social media find that users highly value its access (Brynjolfsson, Collis, and Eggers 2019; Brynjolfsson et al. 2023). However, Bursztyn et al. (2023) point out that nonusers could derive negative utility from others’ social media usage and find evidence for negative consumer welfare once this spillover to non-users is accounted for. This explanation is consistent with empirical evidence suggesting that social media has adverse effects on subjective wellbeing and mental health (Allcott et al. 2020, Mosquera et al. 2020, Braghieri et al. 2022). Importantly, these results do not imply that consumer welfare is negative at every level of social media consumption; some level of social media use may be beneficial.
Social media consumption can also have both positive and negative aggregate impacts. On the positive side, social media has been shown to increase news knowledge and facilitate protest in democracies (Fergusson and Molina 2021, Guess et al. 2023a). On the flip side, social media has been linked to beliefs influenced by misinformation and offline hate crimes (Allcott and Gentzkow 2017, Müller and Schwarz 2021, Jiménez Durán et al. 2022). The evidence on polarisation and voting is more mixed and context-dependent (Levy 2021, Garbiras-Díaz and Montenegro 2022, Guess et al 2023a, 2023b, Nyhan et al. 2023, Fujiwara et al. forthcoming). These effects operate through several channels, including social media as a platform for exposure to persuasive content, facilitation of coordinated actions, and influence on people’s perceptions of others.
Beyond looking at on-platform and off-platform behavior, recent research has studied consumers’ substitution patterns across platforms. Amid concerns that the market for social media applications has become too concentrated, measuring substitution patterns is crucial for assessing the degree of market concentration. There is evidence that consumers substitute not only to other social media apps, but also to communication apps and non-digital activities (Collis and Eggers 2022, Aridor 2023).
Concluding remarks
In this column, we show that research on social media has made dramatic progress in the last decade. However, social media is rapidly changing, both in terms of the platforms used and the content produced, distributed, and consumed. Figure 2 shows that Facebook remains the most dominant platform, but that it faces competition from newer platforms. The figure also shows that academic research mostly focuses on Facebook and Twitter. More research is needed about other platforms that are growing in usage, such as TikTok, especially since these platforms tend to produce different content (e.g. more videos), distribute content differently (rely on their algorithm and not on one’s social network) and have different consumers (e.g. more content consumed by teenagers). Studying these changes is crucial for policymakers to design optimal regulation for social media’s future.
Figure 2 Platform representation in the economics literature

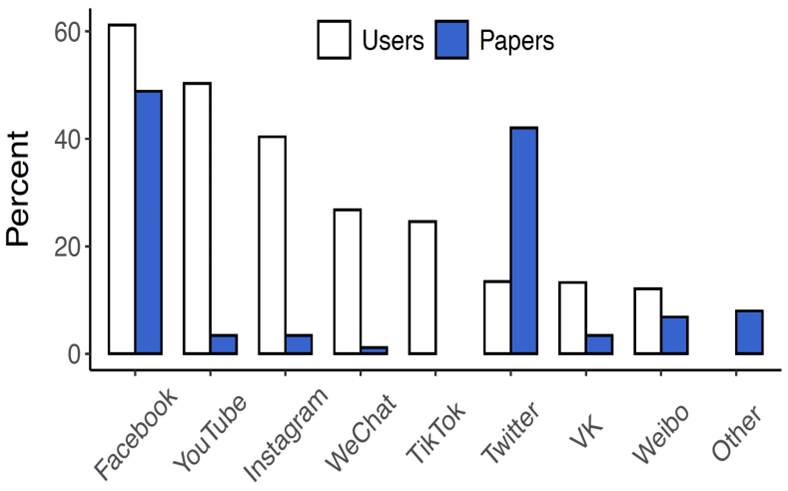
Source: Aridor et al., (2024)
15 maggio 2024
HOW GEOPOLITICS IS CHANGING TRADE
Costanza Bosone, Ernest Dautović Michael Fidora, Giovanni Stamato
(synthesis; full article 14 may 2024 https://cepr.org/voxeu/columns/how-geopolitics-changing-trade)
Abstract: There has been a rise in trade restrictions since the US-China tariff war and Russia’s invasion of Ukraine. This column explores the impact of geopolitical tensions on trade flows over the last decade. Geopolitical factors have affected global trade only after 2018, mostly driven by deteriorating geopolitical relations between the US and China. Trade between geopolitically aligned countries, or friend-shoring, has increased since 2018, while trade between rivals has decreased. There is little evidence of near-shoring. Global trade is no longer guided by profit-oriented strategies alone – geopolitical alignment is now a force.
Keywords: international trade, geopolitics, friend-shoring, global trade
Since the global financial crisis, trade has been growing more slowly than GDP, ushering in an era of ‘slowbalisation’ (Antràs 2021). As suggested by Baldwin (2022) and Goldberg and Reed (2023), among others, such a slowdown could be read as a natural development in global trade following its earlier fast growth. Yet, a surge in trade restriction measures has been evident since the tariff war between the US and China (see Fajgelbaum and Khandelwal 2022) and geopolitical concerns have been heightened in the wake of Russia’s invasion of Ukraine, with growing debate about the need for protectionism, near-shoring, or friend-shoring.
The impact of geopolitical distance on international trade
Rising trade tensions amid heightened uncertainty have sparked a growing literature on the implications of fragmentation of trade across geopolitical lines (Aiyar et al. 2023, Attinasi et al. 2023, Campos et al. 2023, Goes and Bekker 2022).
In Bosone et al. (2024), we present new evidence and quantify the timing and impact of geopolitical tensions in shaping trade flows over the last decade. To do so, we use the latest developments in trade gravity models. We find that geopolitics starts to significantly affect global trade only after 2018, which, timewise, is in line with the tariff war between the US and China, followed by the Russian invasion of Ukraine. Furthermore, the analysis sheds light on the heterogeneity of the effect of geopolitical distance by groups of countries: we find compelling evidence of friend-shoring, while our estimates do not reveal the presence of near-shoring. Finally, we show that geopolitical considerations are shaping European Union trade, with a particular focus on strategic goods.
In this study, geopolitics is proxied by the geopolitical distance between country pairs (Bailey et al. 2017). As an illustration, Figure 1 (Panel A) plots the evolution over time of the geopolitical distance between four country pairs: US-China, US-France, Germany-China, and Germany-France. This chart shows a consistently higher distance from China for both the US and Germany, as well as a further increase in that distance over recent years.
Geopolitical distance is then included in a standard gravity model with a full set of fixed effects, which allow us to control for unobservable factors affecting trade. We also control for international border effects and bilateral time-varying trade cost variables, such as tariffs and a trade agreement indicator. This approach minimises the possibility that the index of geopolitical distance captures the role of other factors that could drive trade flows. We then estimate a set of time-varying elasticities of trade flows with respect to geopolitical distance to track the evolution of the role of geopolitics from 2012 to 2022. To the best of our knowledge, we cover the latest horizon on similar studies on geopolitical tensions and trade. To rule out the potential bias deriving from the use of energy flows as political leverage by opposing countries, we use manufacturing goods excluding energy as the dependent variable. We present our results based on three-year averages of data.
Figure 1 Evolution of geopolitical distance between selected country pairs and its estimated impact on bilateral trade flows
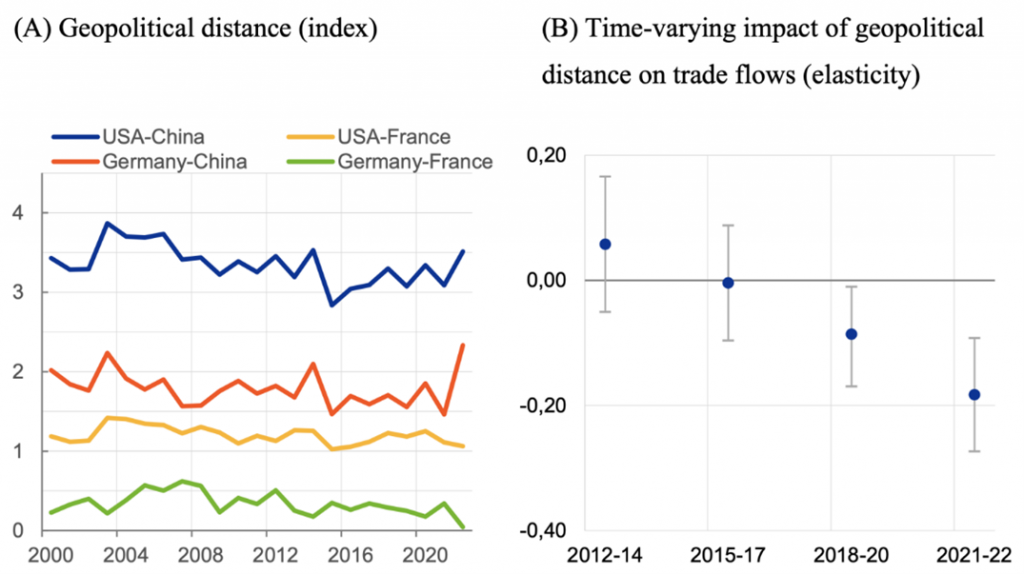
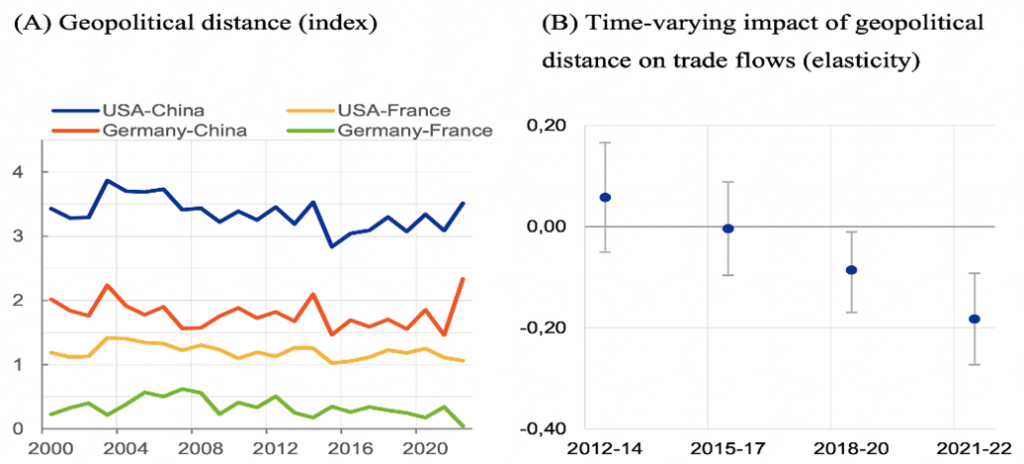
Notes: Panel A: geopolitical distance is based on the ideal point distance proposed by Bailey et al. (2017), which measures countries’ disagreements in their voting behaviour in the UN General Assembly. Higher values mean higher geopolitical distance. Panel B: Dots are the coefficient of geopolitical distance, represented by the logarithm of the ideal point distance interacted with a time dummy, using 3-year averages of data and based on a gravity model estimated for 67 countries from 2012 to 2022. Whiskers represent 95% confidence bands. The dependent variable is nominal trade in manufacturing goods, excluding energy. Estimation performed using the PPML estimator. The estimation accounts for bilateral time-varying controls, exporter/importer-year fixed effects, and pair fixed effects.
Sources: TDM, IMF, Bailey et al. (2017), Egger and Larch (2008), WITS, Eurostat, and ECB calculations.
Our estimates reveal that geopolitical distance became a significant driver of trade flows only since 2018, and its impact has steadily increased over time (Figure 1, Panel B). The fall in the elasticity of geopolitical distance is mostly driven by deteriorating geopolitical relations, most notably between the US and China and more generally between the West and the East. These reflect the effect of increased trade restrictions in key strategic sectors associated to the COVID-19 pandemic crisis, economic sanctions imposed to Russia, and the rise of import substituting industrial policies.
The impact of geopolitical distance is also economically significant: a 10% increase in geopolitical distance (like the observed increase in the USA-China distance since 2018, in Figure 1) is found to decrease bilateral trade flows by about 2%. In Bosone and Stamato (forthcoming), we show that these results are robust to several specifications and to an instrumental variable approach.
Friend-shoring or near-shoring?
Recent narratives surrounding trade and economic interdependence increasingly argue for localisation of supply chains through near-shoring and strengthening production networks with like-minded countries through friend-shoring (Yellen 2022). To offer quantitative evidence on these trends, we first regress bilateral trade flows on a set of four dummy variables that identify the four quartiles of the distribution of geopolitical distance across country pairs. To capture the effect of growing geopolitical tensions on trade, each dummy is equal to 1 for trade within the same quartile from 2018 and zero otherwise.
We find compelling evidence of friend-shoring. Trade between geopolitically aligned countries increased by 6% since 2018 compared to the 2012–2017 period. Meanwhile, trade between rivals decreased by 4% (Figure 2, Panel A). In contrast, our estimates do not reveal the presence of near-shoring trends (Figure 2, Panel B). Instead, we find a significant increase in trade between far-country pairs, offset by a relatively similar decline in trade between the farthest-country pairs. Overall, shifts toward geographically close partners are less pronounced than toward geopolitically aligned partners.
Figure 2 Impact of trading within groups since 2018 (semi-elasticities)

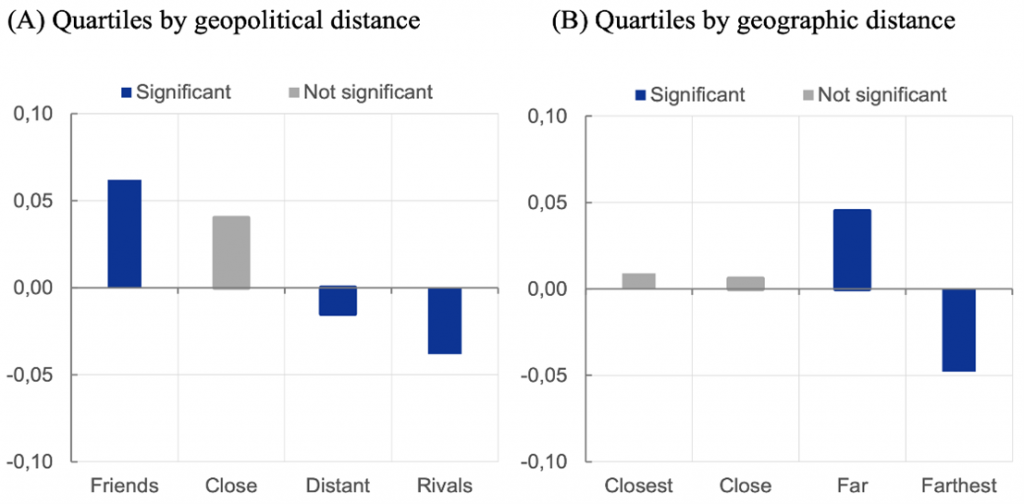
Notes: Estimates in both panels are obtained by PPML on the sample period 2012–2022 using consecutive years. Please refer to Figure 1 for details on estimation. The effects on each group are identified based on a dummy for quartiles of the distribution of geopolitical distance (panel A) and on a dummy for quartiles of the distribution of geographic distance (panel B) across country pairs. The dummy becomes 1 in case of trade between country pairs belonging to the same quartile since 2018. A semi-elasticity b corresponds to a percentage change of 100*(exp(b)-1).
Sources: TDM, IMF, Bailey et al. (2017), Egger and Larch (2008), WITS, Eurostat, CEPII, and ECB calculations.
Evidence of de-risking in EU trade
The trade impact of geopolitical distance on the EU is isolated by interacting geopolitical distance with a dummy for EU imports. We find that EU aggregate imports are not significantly affected by geopolitical considerations (Figure 3, Panel A). This result is robust to alternative specifications and may reflect the EU’s high degree of global supply chain integration, the fact that production structures are highly inflexible to changes in prices, at least in the short term, and that such rigidities increase when countries are deeply integrated into global supply chains (Bayoumi et al. 2019). Nonetheless, we find evidence of de-risking in strategic sectors. 1 When we use trade in strategic products as the dependent variable, we find that geopolitical distance significantly reduces EU imports (Figure 3, Panel A).
Figure 3 Impact of geopolitical distance on EU imports and of the Ukraine war on euro area exports

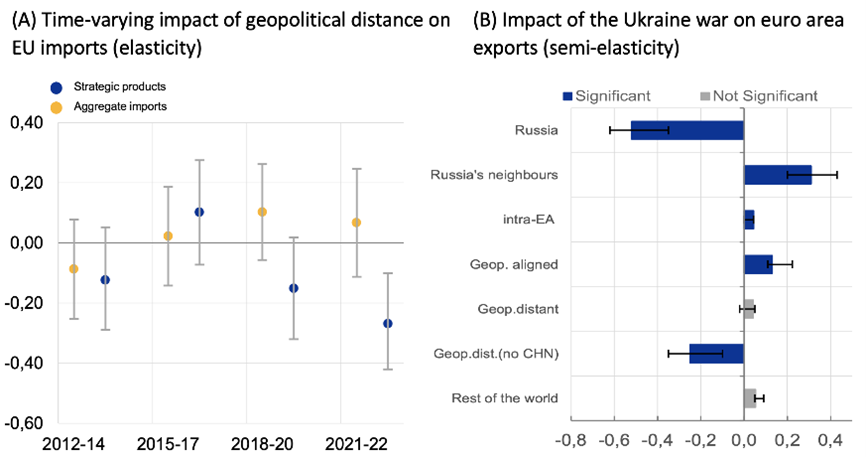
Notes: Estimates in both panels are obtained by PPML on the sample period 2012–2022. Panel A: Dots represent the coefficient of geopolitical distance interacted with a time dummy and with a dummy for EU imports, using 3-year averages of data. Lines represent 95% confidence bands. Panel B: The sample includes quarterly data over 2012–2022 for 67 exporters and 118 importers. Effects on the level of euro area exports are identified by a dummy variable for dates after Russia’s invasion of Ukraine. Trading partners are Russia; Russia’s neighbours Armenia, Kazakhstan, the Kyrgyz Republic, and Georgia; geopolitical friends, distant, and neutral countries are respectively those countries that voted against or in favour of Russia or abstained on both fundamental UN resolutions on 7 April and 11 October 2022. The whiskers represent minimum and maximum coefficients estimated across several robustness checks.
Sources: TDM, IMF, Bailey et al. (2017), Egger and Larch (2008), WITS, Eurostat, European Commission, and ECB calculations.
We conduct an event analysis to explore the implications of Russia’s invasion of Ukraine on euro area exports. We find that the war has reduced euro area exports to Russia by more than half (Figure 3, Panel B), but trade flows to Russia’s neighbours have picked up, possibly due to a reordering of the supply chain. Euro area exports with geopolitically aligned countries are estimated to have been about 13% higher following the war, compared with the counterfactual scenario of no war. We find no signs of euro area trade reorientation away from China, possibly reflecting China’s market power in key industries. However, when China is excluded from the geopolitically distant countries, the impact of Russia’s invasion of Ukraine on euro area exports becomes strongly significant and negative.
Concluding remarks
Our findings point to a redistribution of global trade flows driven by geopolitical forces, reflected in the increasing importance of geopolitical distance as a barrier to trade. In this column we review recent findings on geopolitics in trade and their impact since 2018, the emergence of friend-shoring rather than near-shoring, and the interactions of strategic sectors with geopolitics in Europe. In sum, we bring evidence of new forces that now drive global trade – forces that are no longer guided by profit-oriented strategies alone but also by geopolitical alignment.
6 maggio 2024
SHOULD AI STAY OR SHOULD AI GO: THE PROMISES AND PERILS OF AI FOR PRODUCTIVITY AND GROWTH
Francesco Filippucci, Peter Gal, Cecilia Jona-Lasinio, Alvaro Leandro, Giuseppe Nicoletti
(synthesis; full article 2 may 2024 Vox Eu CEPR https://cepr.org/voxeu/columns/should-ai-stay-or-should-ai-go-promises-and-perils-ai-productivity-and-growth)
Abstract: There is considerable disagreement about the growth potential of artificial intelligence. Though emerging micro-level evidence shows substantial improvements in firm productivity and worker performance, the macroeconomic effects are uncertain. This column argues that the promise of AI-related economic growth and social welfare hinges on the rate of adoption and its interplay with labour markets. Policies should focus on both domestic and global governance issues – including threats to market competition and increased inequality – and do so rapidly to keep pace with fast-evolving AI.
Keywords: productivity and innovation, artificial intelligence, ai growth.
Income and wellbeing gains in advanced economies have been held back by weak productivity performance. The growth rate of labour productivity declined in OECD economies from about 2% annual growth rate between the 1970s and 1990s, to 1% in the 2000s (Goldin et al. 2024, Andre and Gal 2024). This poses a dramatic challenge for ageing societies and makes it harder to allocate resources for the green transition.
There is widespread enthusiasm about the growth potential of rapidly developing artificial intelligence (AI). Some analysts argue that, under reasonable conditions, AI could lead to large and persistent gains, on the order of adding 1–1.5 percentage points to annual growth rates over the next 10–20 years (Baily et al. 2023, Artificial Intelligence Commission of France 2024, McKinsey 2023, Briggs and Kodnani 2023). On the other hand, Acemoglu (2024) contends that the available evidence combined with the economic theory of aggregation supports only moderate total factor productivity and GDP growth impacts, on the order of about 0.1% per year.
Recent work from the OECD provides a broad overview of AI’s impact on productivity and discusses the conditions under which it is expected to deliver strong benefits, with a focus on the role of policies (Filippucci et al. 2024).
AI as a new general-purpose technology
Given its transformative potential in a wide range of economic activities, AI can be seen as the latest general-purpose technology (Agrawal et al. 2019, Varian 2019) – similar to previous digital technologies such as computers and the internet or, going back further, to the steam engine and electricity. From an economic perspective, AI can be seen as a production technology combining intangible inputs (skills, software, and data) with tangible ones (computing power and other hardware), to produce three broad types of outputs:
- Content, such as texts or images (generative AI)
- Predictions, optimisations, and other advanced analytics, which can be used to assist with or fully automate human decisions (non-generative AI)
- Physical tasks when combined with robotics (including autonomous vehicles).
Additionally, AI has some peculiar features, even compared to previous digital technologies. These include the potential for being autonomous (less dependent on human inputs) and the capacity for self-improvement, by learning from patterns in unstructured data or leveraging feedback data about its own performance. Altogether, these features imply that AI can boost not only the production of goods and services but also the generation of ideas, speeding up research and innovation (Aghion et al. 2018).
Initial micro-level evidence shows large productivity and performance gains
According to our overview of the fast-growing literature, initial micro-level evidence covering firms, workers, and researchers is indicative of several positive effects from using AI. First, micro-econometric studies find that the size of the gains from non-generative AI on firms’ productivity is comparable to previous digital technologies (up to 10%; see panel a of Figure 1). Second, when using more recent generative AI in various tasks – assisting in writing, computer programming, or customer service requests – the estimated performance benefits are substantially larger but vary widely (between 15 and 56%; see panel b of Figure 1) depending on the context. In particular, Brynjolfsson et al. (2023) found that AI has a much stronger impact on the performance of workers with less experience in their job. These estimates focus on specific tasks and individual-level gains. Hence, they are narrower in scope than previous firm-level studies but tend to rely more on more causal identification in experimental settings.
Figure 1 The positive relationship between AI use and productivity or worker performance: Selected estimates from the literature
- a) Non-generative AI, firm-level studies on labour productivity

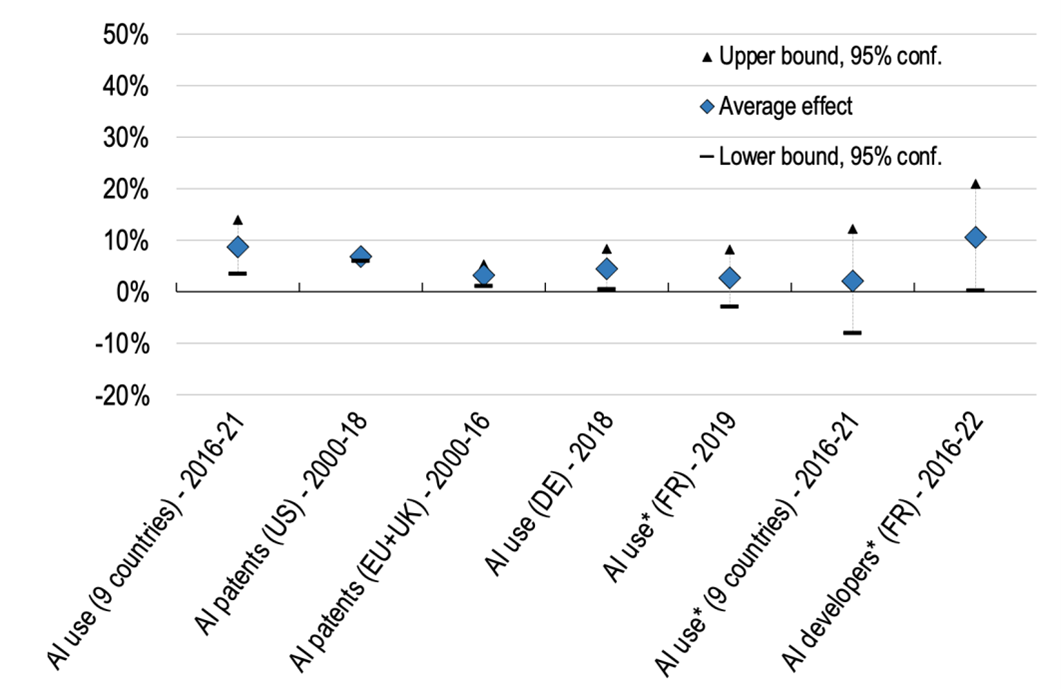
- b) Generative AI, worker-level studies on performance in specific tasks
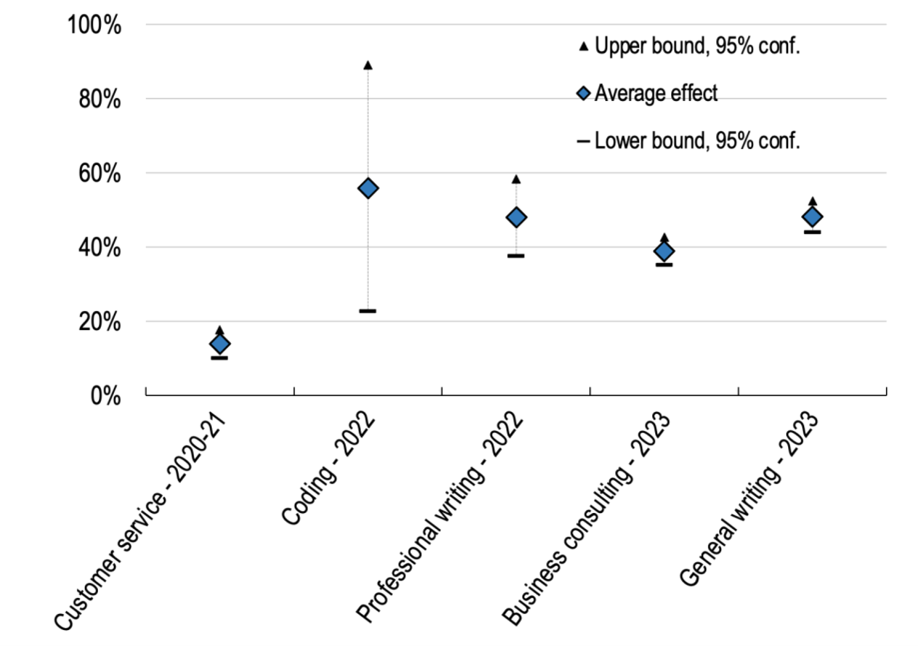
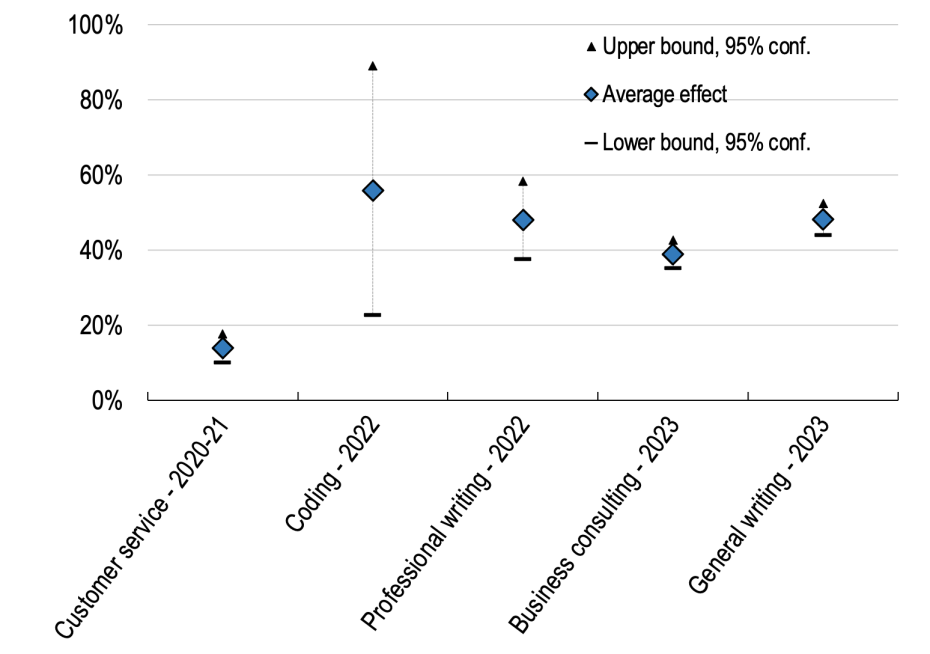
Note: In panel a, ‘AI use’ is a 0-1 dummy obtained by firm surveys, while ‘AI patents’ refers either to a 0-1 dummy for having at least one patent (US study) or to the number of patents in firms. The sample of countries underlying the studies are shown in parentheses. The year(s) of measurement is also indicated. *Controlling for other ICT technologies. For more details, see Filippucci et al. (2024).
Third, researchers believe that AI allows for faster processing of data – speeding up computations and decreasing the cost of research – and may also make new data sources and methods available, as documented by a recent survey in Nature (Van Noorden and Perkel 2023). Fourth, AI-related inventions are cited in a broader set of technological domains than non-AI inventions (Calvino et al. 2023). Finally, there are promising individual cases from specific industries: AI-predicted protein-folding gives new insights in biomedical applications; AI-assisted discoveries of new drugs help with pharmaceutical R&D; and research on designing new materials can be broadly used in manufacturing (OECD 2023).
Long-run aggregate gains are uncertain
As generative AI’s technological advances and its use are very recent, findings at the micro or industry level mainly capture the impacts on early adopters and very specific tasks, and likely indicate short-term effects. The long-run impact of AI on macro-level productivity growth will depend on the extent of its use and successful integration into business processes.
According to official representative data, the adoption of AI is still very low, with less than 5% of firms reporting the use of this technology in the US (Census Bureau 2024; see Figure 2). When put in perspective with the adoption path of previous general-purpose technologies (e.g. computers and electricity), AI has a long way to go before reaching the high adoption rates that are necessary to detect macroeconomic gains. While user-friendly AI may spread faster through the economy, the successful integration of AI systems and exploiting their full potential may still require significant complementary investments (in data, skills, reorganisations) which take time and necessitate managerial talent. Moreover, future advances in AI development – and its successful integration within business processes – will require specialised technical skills that are often concentrated within a few firms (Borgonovi et al. 2023).
Figure 2 AI adoption is still limited compared to the spread of previous general-purpose technologies
The evolution of technology adoption in the US (as % of firms)
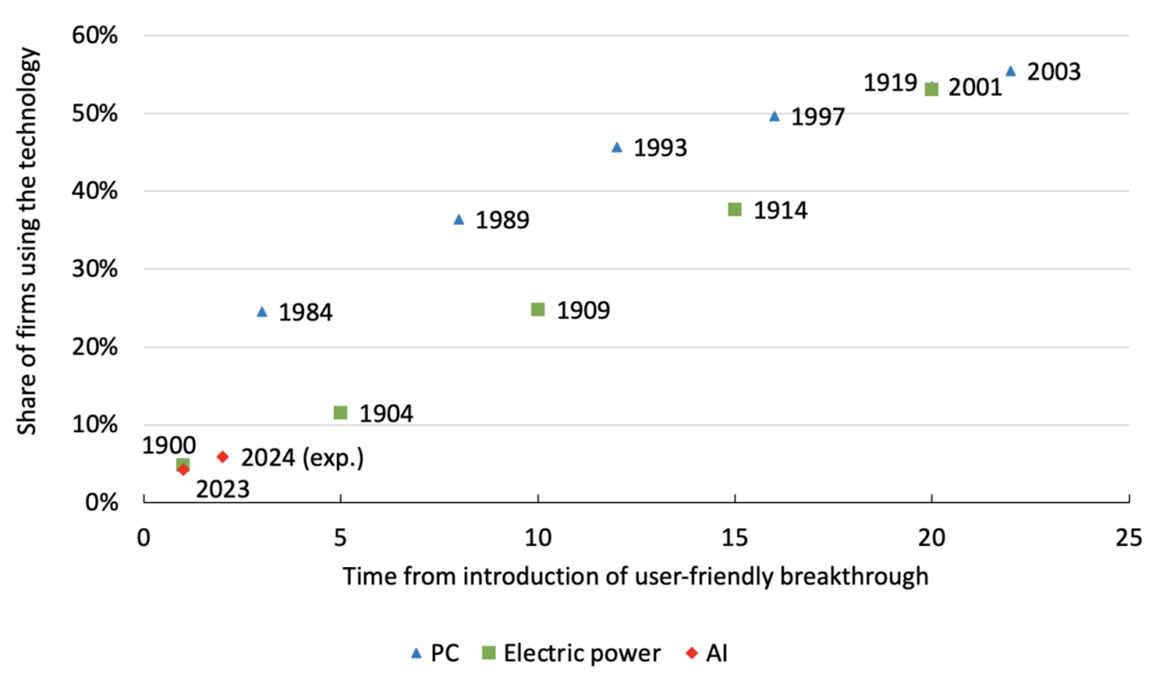
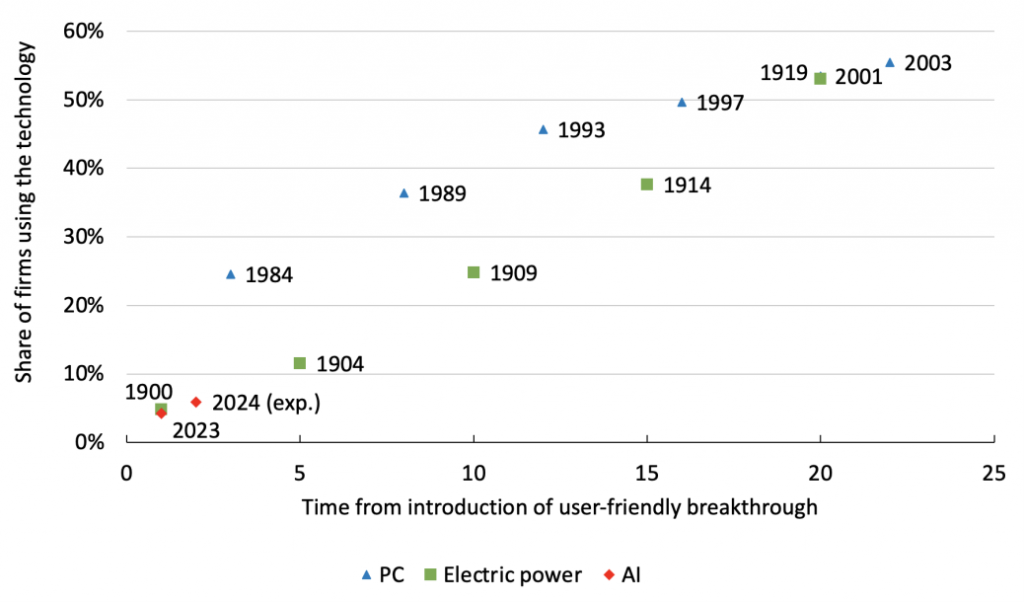 Note: The 2024 value for AI is the expectation (exp.) as reported by firms in the US Census Bureau survey. For more details, see the sources.
Source: For PC and electricity, Briggs and Kodnani (2023); for AI, US Census Bureau, Business Trends and Outlook Survey, updated 28 March 2024.
It is also an open question whether AI-driven automation will displace (reallocate) workers from heavily impacted sectors to less AI-affected activities or the human-augmenting capabilities of AI will prevail, underpinning labour demand. Currently, AI exposure varies greatly across sectors: knowledge-intensive, high-productivity activities are generally much more affected (Figure 2), with significant potential for automation in some cases (Cazzaniga et al. 2024, WEF 2023). Hence, an eventual fall in the employment shares of these sectors would act as a drag on aggregate productivity growth, resembling a new form of ‘Baumol disease’ (Aghion et al. 2019).
Figure 3 High-productivity and knowledge-intensive services are most affected by AI
AI exposure of workers by sector, 2019
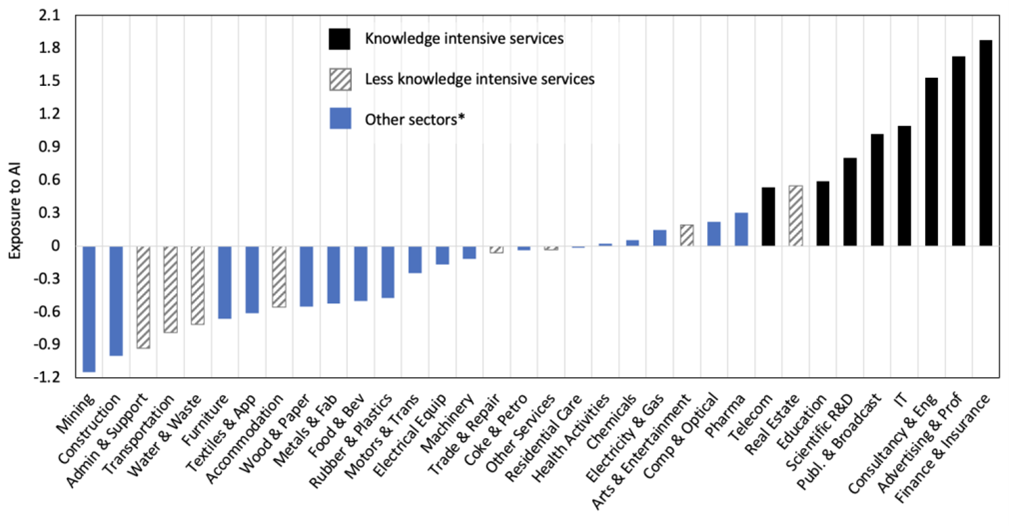

Note: The index measures the extent to which worker abilities are related to important AI applications. The measure is standardised with mean zero and standard deviation one at the occupation level and then matched to sectors. Figure does not yet include recent Generative AI models. *Including non-market services, manufacturing, utilities, etc.
Source: Filippucci et al. (2024) and OECD (2024) based on Felten et al. (2021).
Historically, the automation of high-productivity activities, combined with saturating demand for their output, has pushed employment from manufacturing to services (Bessen 2018). This structural change also played a role – though a moderate one – in the ongoing slowdown in aggregate productivity growth (Sorbe et al. 2018). Similarly, if AI enhances productivity only in selected activities, aggregate growth will be limited by the slower productivity growth and higher employment share in sectors that are less exposed to AI (such as labour-intensive personal services like leisure and health care). This may occur more quickly with AI compared to past technologies given the rapid and wide-ranging advances in its capabilities. However, in the extreme case of AI impacting (nearly) all tasks and boosting productivity in (nearly) all economic activities, this negative effect may be muted (Trammel and Korinek 2023).
AI poses policy challenges related to competition, inequality, and broader societal risks
AI poses significant threats to market competition and inequality that may weigh on its potential benefits, either directly or indirectly, by prompting preventive policy measures to limit its development and adoption.
First, the high fixed costs and returns to scale related to data and computing power may lead to excessive concentration of AI development. Second, AI use in downstream applications may lead to market distortions, especially if it allows first movers to build up a substantial lead in market share and market power. Moreover, AI-powered pricing algorithms have a tendency to charge supra-competitive prices (Calvano et al. 2020) and could eventually enhance harmful price discrimination (OECD 2018).
The impact of AI on inequality remains ambiguous. The technology can potentially substitute for high-skilled labour and narrow wage gaps with low-skilled workers, thereby reducing inequalities (Autor 2024) at least within occupations (Georgieff 2024). Though there are indications that AI can be associated with higher unemployment (OECD 2024), AI could also lead to more inclusion and stronger economic mobility by improving education quality and access, expanding credit availability, and lowering skill barriers (e.g. foreign languages).
Further uncertainties surrounding AI include broader societal concerns. More immediate concerns relate to privacy, misinformation, and bias (possibly leading to exclusion in areas such as labour and financial markets), while longer-term concerns include mass unemployment or even existential risks (Nordhaus 2021, Jones 2023).
A comprehensive policy approach is needed to effectively manage these risks and harness AI’s full potential. Immediate priorities include promoting market competition and widespread access to AI technologies while preserving innovation incentives (e.g. via adapting intellectual property rights protection) and addressing issues of reliability and bias, which require adequate auditing and accountability mechanisms. Job displacement, reallocation and inequality impacts might emerge over longer periods, but they require preventive policy action through training, education, and redistribution measures to ensure human skills remain complementary to AI. Policymakers should also devise national and international governance mechanisms to cope with rapid and unpredictable developments in AI.
29 Aprile 2024
MIGRATION AND EMPLOYMENT DYNAMICS ACROSS EUROPEAN REGIONS
Anthony Edo, Cem Ozguzel
(synthesis; full article 25 apr 2024 Vox Eu CEPR https://cepr.org/voxeu/columns/migration-and-employment-dynamics-across-european-regions)
Abstract: Despite extensive research on the labour market effects of immigration, little is known about the dynamic effects of immigration on native employment or the role of institutional factors or economic performance in shaping these effects. This column makes use of regional differences across multiple countries in Europe to reveal an intricate and diverse impact of immigration on native employment. While the employment impact of immigration can be negative in the short run, it diminishes over time. Furthermore, the employment response to immigration varies considerably by educational level and place. These results highlight the importance of adopting a nuanced and targeted approach to immigration policies, including mitigating any potential short-run adverse labour market effects on low-educated workers and economically lagging regions.
Keywords: labour market, migration, immigration policies, employment dynamics.
How does immigration affect employment opportunities for natives? As immigrants (or the foreign-born) make up an increasingly large share of receiving countries in Europe, the economic impact of immigration remains a topical issue. The foreign-born share of the labour force in these countries increased by 3.4 percentage points over the last decade, from 12.8% in 2010 to 16.2% in 2019, which is twice as much as in the US, where the foreign-born share of the labour force increased by only 1.6 percentage points (from 15.8% in 2010 to 17.4% in 2019). As shown in Figure 1, this increase has been uneven between and within European regions.
Figure 1 The changes in the employment rates and immigrant shares in 13 European countries between 2010 and 2019
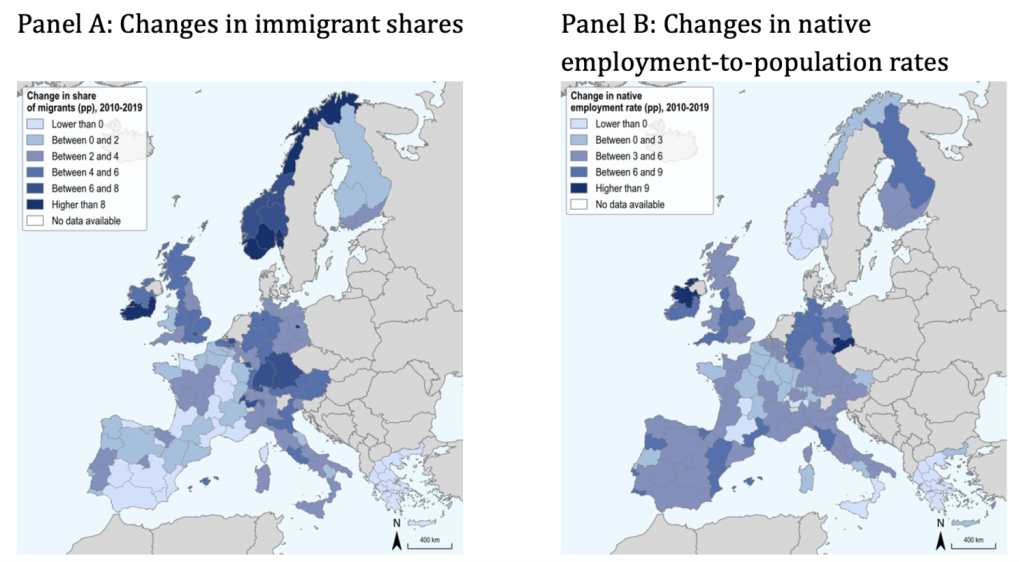

Source: Edo and Özgüzel (2023)
In a recent paper (Edo and Özgüzel 2023), we exploit these variations and present the first empirical evidence on the regional impact of immigration on native employment across European countries. Our analysis relies on the EU Labour Force Survey (EU LFS) covering 13 (West) European countries over the 2010-2019 period. The richness of the data allows for estimating the impact of immigration on the employment rate of natives at the regional level across multiple countries. This perspective provides a wealth of information to understand the labour market effects of immigration better and whether these effects are more pronounced in regions with more protective labour market institutions (e.g. higher employment protection, collective bargaining, or higher union density) or in regions experiencing stronger economic expansion during the period of analysis.
The advantage of our cross-regional analysis is to account for all channels through which an immigrant supply shock in a given region can affect native employment in that region. This estimation strategy not only captures the ‘own’ effect of a particular supply shift on the employment of competing workers. It also captures the complementary effects of the supply shock on the employment of workers with different skills. However, this analysis could lead to misleading interpretations if immigrants chose their region of residence based on economic considerations or if natives responded by migrating to other local labour markets (Borjas et al. 1997, Dustmann et al. 2005).
To address the potential bias arising from the endogeneity of immigrant location choices, we collected and harmonised census data for 13 countries to measure the historical distribution of immigrants in 1990 by country of origin across European regions to predict the regional distribution of immigrants during the analysis period. The instrumental variable (IV) strategy relies on the fact that the presence of earlier migrants partly determines immigrant settlement patterns, while the historical distribution of immigrants in 1990 should be uncorrelated with contemporaneous changes in regional economic conditions (Altonji and Card 1991, Card 2001). We perform a series of tests to address issues raised by Jaeger et al. (2018) and Goldsmith-Pinkham et al. (2020), confirming our IV strategy’s validity. Finally, we show that immigration did not affect native internal mobility across European regions over the period considered. Therefore, our estimated employment effects are unlikely to be biased by the reallocation of natives across regions.
We uncover four significant findings. First, immigration has a detrimental impact on the employment rate of natives in the early years following the supply shock. In the short term, a 1% immigration-induced increase in the size of the labour force in a given region reduces the employment-to-population rate of natives in that region by 0.81% (see Figure 2). Yet, the native employment response to immigration is more negative in the short term when examining 1-year (or annual) fluctuations compared to 2-year and 3-year variations. The short-term impact of immigration disappears in the longer run when examining 5-year or 10-year variations. This employment dynamics induced by immigration is consistent with standard theory indicating that economic adjustments following immigration are not necessarily immediate and can take some time (Borjas 2013).
Second, the labour market effects of immigration differ by educational group. The impact of immigration on the employment rate of highly educated natives is zero in the short run and positive in the longer run, while the effects are negative among low-educated natives in the short run and much weaker in the longer run (see Figure 2). It is not surprising to find an adverse impact on the employment of low-educated native workers as the degree of competition between natives and immigrants within the low-skill segment of the labour market tends to be stronger (Dustmann et al. 2013, Peri and Sparber 2011). In sum, immigration to Europe in the last decade increased the employment opportunity gap between high- and low-educated natives.
Third, the impact of immigration on employment is weaker in regions with stricter labour market institutions. We interact the regional share of immigrants with three institutional measures indicating whether the region is located in a country with a high level of employment protection or union density (i.e. in the top 50% in 2010), or whether wage bargaining takes place predominantly at the sectoral/country level (as opposed to the firm level). We find that higher levels of employment protection and collective bargaining coverage dampen the employment effect of immigration by shielding native workers in the short and longer run. In contrast, a higher degree of union density does not matter when determining the employment impact of immigration.
Figure 2 The labour market effects of immigration are uneven across time and workers with different levels of education
Estimated effect of a 1% increase in the labour supply due to immigration on the log employment-to-population rate of natives by level of education, 2010-19, NUTS2 regions
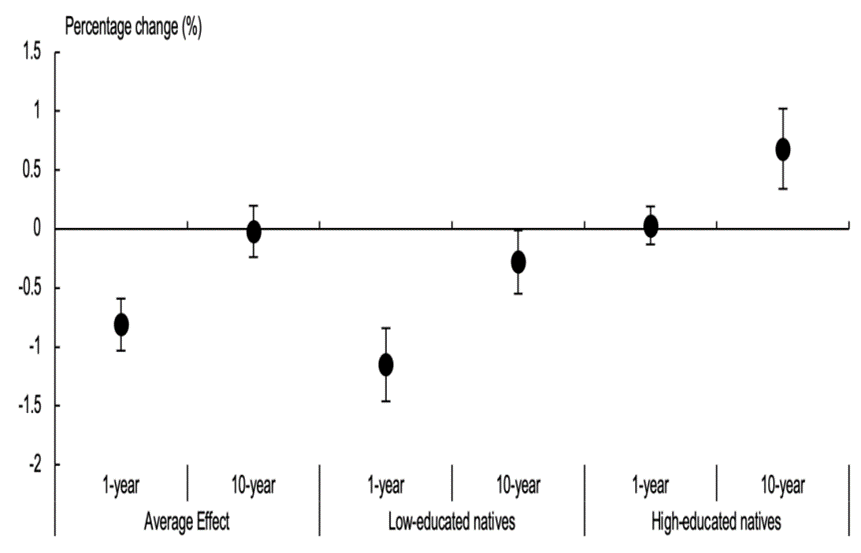

Finally, economically dynamic regions are better equipped to absorb immigration. We classify European regions into two categories based on their economic vitality, using a ‘high GDP growth’ indicator to differentiate between those with strong and weak economic performance. This classification is determined by ranking regions according to their GDP changes between 2010 and 2019. The top 25% are designated as ‘high GDP growth’ regions, while the remaining 75% are considered regions with comparatively weaker economic dynamism. In the short term, the fastest-growing regions show relatively modest employment effects in response to immigration, but they experience employment gains in the long term. This outcome underscores the significant role that economic dynamism plays in shaping the impact of immigration on the labour market.
Our findings reveal the intricate and diverse impact of immigration on the employment of natives in European countries. While the employment impact of immigration can be negative in the short run, it diminishes over time and vanishes after some years. Furthermore, the employment response to immigration varies by educational level and places according to their institutional features. From a policy perspective, our study highlights the importance of adopting a nuanced and targeted approach to immigration policies. As the labour market consequences for natives are uneven across groups and places, targeted policies that consider these heterogeneous impacts can mitigate any potential short-run adverse labour market effects on low-educated workers and economically lagging regions and ensure that the entire population benefits from the economic gains associated with migration.
16 aprile 2024
FROM BUZZ TO BUST: HOW FAKE NEWS SHAPES THE BUSINESS CYCLE
Tiziana Assenza, Fabrice Collard, Patrick Feve, Stefanie Huber
(synthesis; full article Vox Eu CEPR 10 apr 2024 https://cepr.org/voxeu/columns/buzz-bust-how-fake-news-shapes-business-cycle)
Abstract: The threats that misinformation poses to politics and public health are well documented, but the macroeconomic effects of fake news remain largely unexplored. This column surveys the impact of fake news on economic stability. Leveraging a novel dataset, the authors unveil the detrimental effects of technology-related fake news on key economic indicators. Fake news profoundly influences economic dynamics, from heightened uncertainty to amplified business cycle fluctuations. Policymakers grappling with the ramifications of fake news will need to monitor its heterogeneous effects on economic stability.
Keywords. Economic stability, fake news
In the contemporary digital era, the proliferation of fake news has emerged as a significant concern, fundamentally altering the landscape of public discourse and raising questions about its economic ramifications. As Thomas Jefferson recognised over two centuries ago, truth itself becomes suspect when filtered through the lens of fabricated news. 1 Today, the urgency of Christine Lagarde’s words are emblematic of the emergence of fake news as a primary concern for policymakers and citizens alike. 2 Indeed, the 2024 World Economic Forum’s ranking of fake news as the most severe global short-term risk underscores the gravity of this problem. To date, fake news related research has focused primarily on the political economy of social media (for a review, see Campante et al. 2023); on understanding the factors driving – and tools to stop – the consumption and sharing of political news (Zhuravskaya et al. 2017, Ozdaglar and Acemoglu 2021, Guriev et al. 2023, Mattozzi et al. 2023); and on the impact of fake news on election outcomes (Fraccaroli et al. 2019).
Despite its evident societal and political implications, the macroeconomic impact of fake news remains largely unexplored. Our research (Assenza et al. 2024) attempts to fill this gap in the literature by investigating a fundamental question: Does fake news shape aggregate economic fluctuations?
At the heart of this investigation lies the methodological challenge of identifying fake news shocks. We rely on the hypothesis that fake news issuance introduces some degree of confusion or noise, thereby augmenting the uncertainty faced by economic agents. Leveraging data from the Assenza-Huber Fake News Atlas database, our study constructs a proxy that captures exogenous variations in fake news issuance. The database includes news items fact-checked by PolitiFact, a reputable and Pulitzer-Prize winning fact-checking organisation. By harnessing this dataset, the study sheds light on the dynamic causal relationship between technology-related fake news shocks and business cycle dynamics, employing a proxy-VAR approach (Stock and Watson 2018, Kilian and Lütkepohl 2018) to unravel the complex interplay between fake news and economic outcomes. To be precise, we instrument the Jurado et al. (2015) measure of macroeconomic uncertainty with our proxy for fake news.
Our key findings, illustrated in Figure 1, reveal compelling insights. The figure displays the impulse response functions (IRFs) of the model variables to a one-standard deviation shock in fake news. Technology-related fake news shocks sow seeds of uncertainty that reverberate through the economy, manifesting in increased unemployment rates and lower industrial production. Moreover, these fake news shocks contribute significantly to the overall volatility of the business cycle, underscoring their systemic importance.
Figure 1 Benchmark responses: The economic impact of fake news
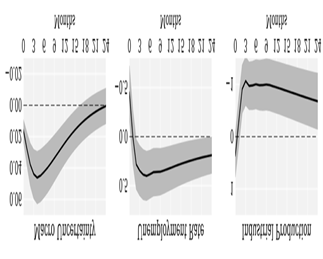
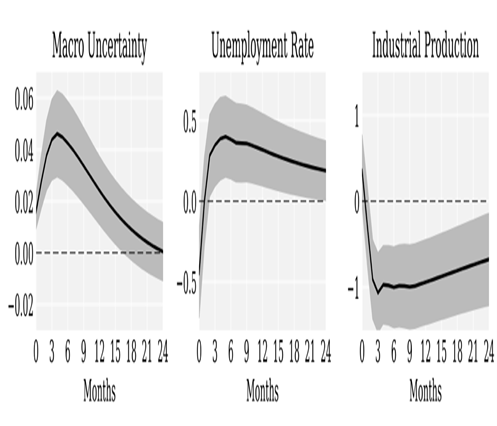
Note: The solid black line shows the IRF of the model variables to a fake technology news shock. Shaded areas represent +/- 1 standard deviation around average response obtained from 1,000 Bootstrap replications.
Technology-related fake news shocks trigger a sustained surge in macroeconomic uncertainty, peaking after four months before gradually subsiding. This hump-shaped pattern of the impulse response functions suggests a powerful and robust transmission mechanism, reflecting the spread of fake news, its gradual absorption by the public, and, ultimately, heightened confusion and uncertainty. As Figure 1 shows, the initial uncertainty gradually builds up, leading to a further depression of macroeconomic outcomes. In terms of magnitude, the fake technology news shock explains up to 84% of the one-month-ahead macroeconomic uncertainty after one year. It contributes 50% of the short-run volatility of the unemployment rate and still accounts for one third of its overall volatility after one year. While the shock explains only 14% of the short-run volatility of the industrial production index, it accounts for about 50% of its volatility at the one-year horizon. This highlights the potential of fake news to act as a key driver of the business cycle. These results survive a battery of robustness checks.
Disagreement rather than uncertainty
Our baseline identification rests on the idea that the issuance of fake news creates confusion and, in turn, greater uncertainty in the economy, complicating the forecast of economic agents. Accordingly, we have relied on the macroeconomic uncertainty index developed by Jurado et al. (2015) to identify our fake technology news shock. In addition, we dive into another potential channel for transmitting shock: disagreement. By its very nature, fake news is controversial and can lead to increased disagreement among agents regarding, among other things, future economic outcomes.
Figure 2 shows the IRFs that closely resemble those of our benchmark model. Amplified disagreement manifests as a decline in industrial production and a surge in unemployment. In line with our benchmark findings, the fake technology news shock accounts for a substantial share of business cycle volatility: about 65% for unemployment and 62% for industrial production at the one-quarter horizon. We take this as further evidence that fake technology news shocks sow confusion and disagreement among agents.
Figure 2 Disagreement VAR
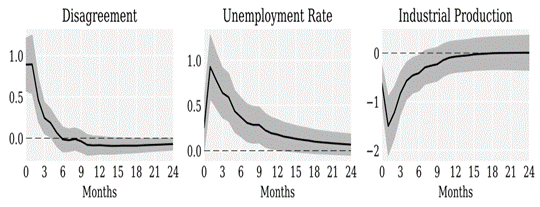
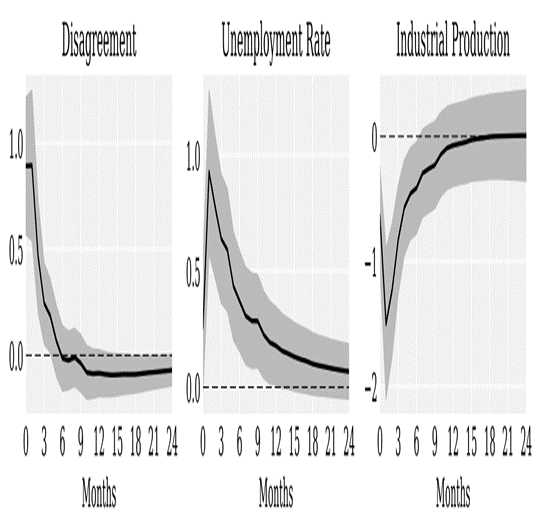
Note: The black solid line shows the IRFs of the model variables to a fake technology news shock. Instead of the 1-month ahead Jurado et al. (2015) macroeconomic uncertainty index, we include a measure of disagreement in the VAR (using micro-data from the Survey of Consumer Expectations published by the New York Fed). Shaded areas represent +/- 1 standard deviation around average response obtained from 1,000 Bootstrap replications.
Fake news impacts the broader economy
Expanding beyond the core economic indicators presented in Figure 1, our research dives deeper into critical sectors – such as consumption, labour, and finance – uncovering the extensive impact of fake news on economic behaviour. We find that fake news influences various facets of economic activity. Specifically, we show that fake technology news shocks explain a sizeable share of durable and non-durable goods consumption expenditures as well as services. Following a fake technology news shock, consumers tend to cut their spending. This downturn extends to the labour market – both hours worked and a fall in job openings after the shock. It also impacts financial markets, with stock prices decreasing amidst increased volatility. Inflation and inflation expectations initially dip, as does the monetary policy interest rate, but quickly revert to their long-run value. Finally, credit spreads and risk premiums increase, suggesting the occurrence of market confusion and a higher level of investor risk aversion. Overall, fake technology news shocks play a significant role in shaping fluctuations, highlighting the pervasive impact of fake news on economic stability and behaviour.
It’s the economic supply-side fake news that matters
Notably, the study uncovers nuanced differences in the economic response to different types of fake news. Specifically, we find that supply-side fake news on topics such as technology, taxes, and gas prices exerts significant influence on economic outcomes. However, fake news focusing on other aspects of the economy – such as labour markets, government spending, or financial regulation – fails to yield a statistically significant impact (see Figure 3).
Figure 3 Comparing the economic impact of supply-side versus other types of fake news

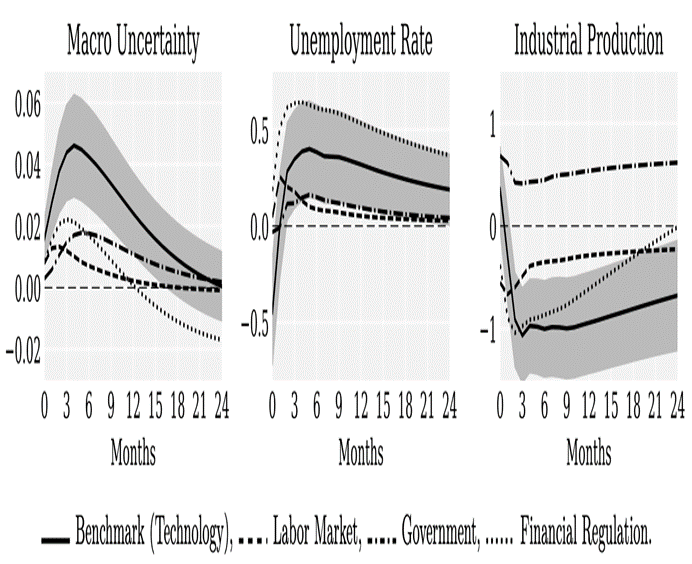
Note: The black solid line shows the IRFs of the model variables to a fake technology news shock, the dashed line the IRFs to a fake labour market news shock, the dash-dotted line the IRFs to a fake government news shock, and the dotted line the IRFs to a fake financial regulation news shock. Shaded areas represent +/- 1 standard deviation around average response obtained from 1,000 Bootstrap replications
This result does not necessarily indicate that these types of fake news do not impact the economy. Rather, it suggests that these types of fake news do not influence the economy through our mechanism – that of macroeconomic uncertainty. For example, we show that government fake news issuance is fundamentally related to the (fixed) electoral cycle, which is predictable in the US and therefore does not affect macroeconomic uncertainty. This underscores the importance of understanding the diverse channels through which different types of fake news shape economic dynamics.
The asymmetric impact of fake technology news shocks
Moreover, our research highlights the role of ‘news sentiment’ in amplifying the economic impact of fake news. We find that fake technology news shocks with a negative tone account for a greater share of the volatility of macroeconomic uncertainty, the unemployment rate, and industrial production than those with a positive tone. Figure 4 illustrates that the influence of negative fake technology news shocks on key economic indicators outweighs the influence of positive shocks. In addition, we find that negative fake technology news shocks trigger a significant persistent consumer confidence loss, while the same shocks identified on positive news induce a very short-lived surge in confidence. Hence, fake (negative) technology news not only increases uncertainty but also instils a sense of pessimism that positive fake news fails to counteract.
Figure 4 Comparing the economic impact of positive versus negative fake news

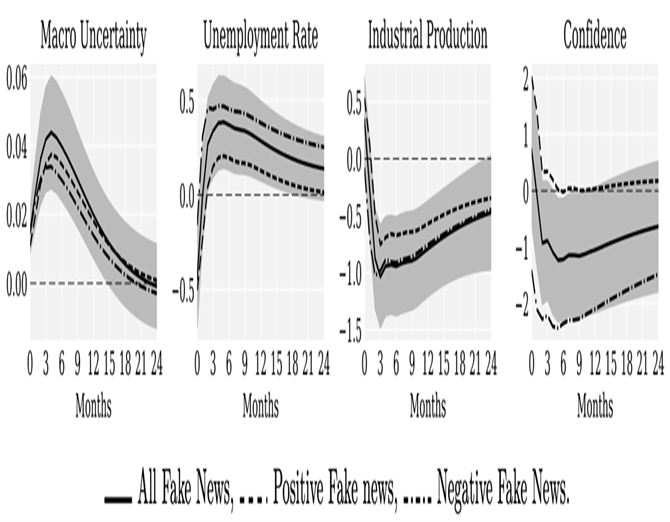
Note: This VAR includes the Michigan Confidence Index in addition to the benchmark variables. The black solid line shows the IRFs of the model variables to a fake technology news shock, the dashed line the IRFs to a positive sentiment fake technology news shock, and the dash-dotted line the IRFs to a negative sentiment fake technology news shock. Shaded areas represent +/- 1 standard deviation around average response in the VAR featuring all fake technology news obtained from 1,000 Bootstrap replications.
Conclusion
Our research offers insights into the economic ramifications of fake news, shedding light on its systemic importance. While specific policy recommendations lie beyond the scope of our paper, our findings emphasise the need to recognise that fake news poses challenges not only to social and political stability, but also to economic stability. However, current policy-related analyses and discussions focus largely on the political and societal consequences of fake news, such as its detrimental effects on democratic processes; the Code of Practice on Disinformation requested by the Internal Market and Consumer Protection (IMCO) and the EU is one example (Frau-Meigs 2018). Our research contributes to this ongoing discourse by shedding light on the adverse economic implications of fake news. Moreover, it suggests that policymakers, particularly those in economic and financial realms, could benefit from monitoring the prevalence of fake economic news, especially when it pertains to the supply side of the economy.
09 Aprile 2024
AUSTERITY AND ELECTIONS
Alberto Alesina, Gabriele Ciminelli, Davide Furceri, Giorgio Saponaro
(synthesis; full article Vox Eu CEPR 9 Apr 2024 https://cepr.org/voxeu/columns/austerity-and-elections)
Abstract: With high debt and high real interest rates, the electoral effects of fiscal policy will be a prominent issue for policymakers. This column discusses the political consequences of tax increases and expenditure cuts, and argues that that the electoral risks of austerity can be mitigated through strategic, ideologically consistent, and well-timed policy decisions, and in particular though consistency between a government’s policy actions and its electoral promises.
Keywords: Politics, economy, taxation, innovation, elections, campaign manifestos
Given record high debt-to-GDP ratios in developed and several emerging economies in the presence of long-term real interest rates above their pre-pandemic levels, fiscal contraction will become necessary some time again. While a large literature, often discussed here on Vox (Barro and Redlick 2009, Alesina et al. 2012, DeLong and Bradford 2012, Taylor 2013), has debated the consequences of fiscal shocks for income growth and debt sustainability (Cherif and Hasanov 2013, Born and Pfeifer 2015), how they depend on the underlying state of the economy (Auerbach and Gorodnichenko 2010, Ramey and Zubairy 2015, Alesina et al. 2016) and whether deficit expansions have consequences of the same magnitude as deficit reductions (Barnichon and Matthes 2015), we ask what the electoral consequences are: the polls are the ultimate constraint on democratically elected policymakers.
On the one hand, voters may dislike austerity of any type because it reduces disposable income in the short run. Thus, governments may delay implementing it until it is the only option left to avoid a sovereign debt crisis, which often happens in a recession. But the literature has found that a recession is the worst moment to implement austerity: Auerbach and Gorodnichenko (2012) estimate larger spending multipliers in recessions than in expansions. Hence, kicking the can of austerity down the road, hoping to avoid its electoral consequences, can make them worse.
On the other hand, fiscal policy has important distributional consequences that may make some forms of austerity appealing to voters. For example, raising wealth or corporate taxes may be received well by the electorate which benefits from the services paid with these taxes. As an example, in a referendum in September 2022, Swiss citizens voted to increase VAT effective from January 2024. Symmetrically, permanently reducing government expenditures signals lower future taxes, which can find support among voters who believe they receive less from the government than they contribute, either because of inefficiency or deliberate redistributive policies. In another words, tax hikes or spending cuts can be appealing to the median voter depending on the level of inequality and their view on the optimal size of government. In a recent paper (Alesina et al. 2024), using a dataset which comprises thousands of austerity measures announced by 14 advanced economies over a time span of 30 years, we focus on the following questions:
- Do voters react to tax hikes differently than to expenditure cuts?
- Is austerity politically more costly during recessions?
- Do voters care about consistency with electoral promises?
Our investigation reveals that the conventional narrative oversimplifies how voters respond to austerity. The specifics of how austerity is implemented – whether through tax hikes or expenditure cuts – and the economic manifesto of the implementing government play a critical role in shaping voter reactions.
Tax hikes invariably alienate voters…
We find that tax hikes are associated with an important reduction in the vote share of the main governing party: Oo average, an austerity package worth 1% of GDP is associated with a reduction in the vote share of about 7%. This negative effect is considerably larger if the government that introduced it had previously campaigned on a free-market platform in the election that brought it into power. In other words, free-market (and small-state) parties see their vote share reduced drastically when they form governments that raise taxes to consolidate the budget. But we also find that parties that did not campaign on a free-market platform (and might even favour a large size of government) still see their vote share reduced if they decide to reduce the budget deficit by increasing taxes, albeit to a lesser degree. Governments on average seem to act as if they were aware of the cost of taxation, by frontloading tax-based adjustments in their first year of term, especially after they have won a large majority in the parliament.
Figure 1 Change in the vote share of the main governing party after a tax-based consolidation package worth 1% of GDP
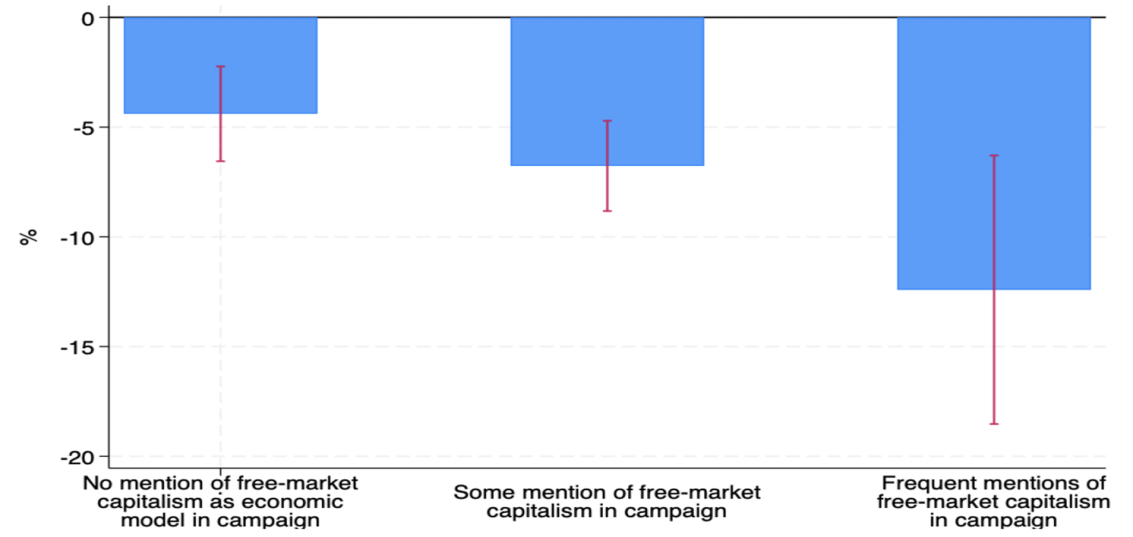

Note: Red whiskers are 90% confidence bands.
… but expenditure cuts may attract votes
Turning to expenditure cuts, our findings challenge the notion that all forms of austerity are politically harmful We find that, on average, expenditure cuts are not associated with any significant change in the vote share of the government introducing it. But when we take into account economic manifestos, we find that this matters a great deal. Parties that campaigned on a free-market platform gain vote share after forming a government that announces an austerity package consisting of expenditure cuts. This result is completely flipped for parties that did not campaign on a free-market platform: they lose votes after expenditure-based austerity.
Figure 2 Change in the vote share of the main governing party after an expenditure-based consolidation package worth 1% of GDP
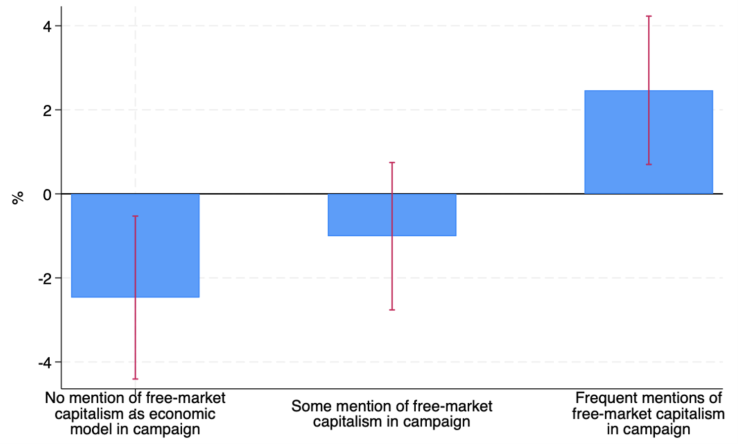
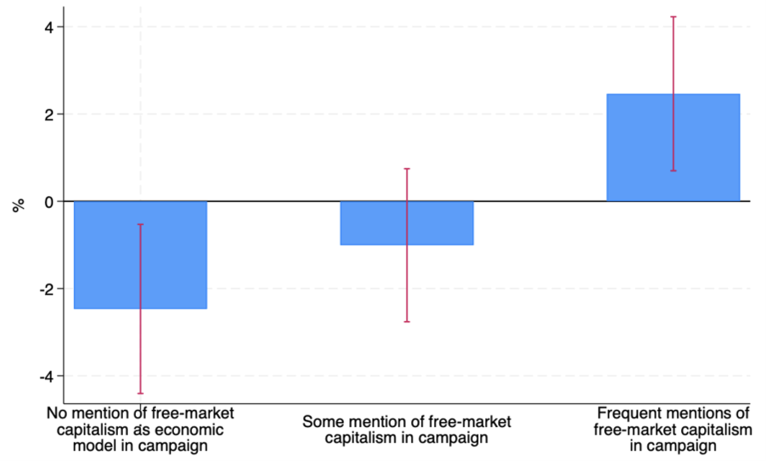
Notes: red whiskers are 90% confidence bands
These results suggest that ideology and consistency of political actions with those promised in a manifesto are important in explaining the electoral consequences of austerity. We confirm this intuition by considering political ideology instead of economic manifestos: right-leaning parties lose vote share after tax-based austerity, but can gain votes after expenditure-based austerity. Conversely, left-leaning parties lose votes after expenditure-based austerity, but their electoral fallout is limited in case of tax-based austerity. However, consistency with promised policies is important even conditioning on political ideology. We find that left-leaning governments can limit the electoral cost of expenditure-based consolidations if they campaigned less on a big-state platform.
Austerity during a recession is more costly at the polls
We also find that austerity, in particular tax-based austerity, is more detrimental to the electoral fortunes of the government when it is announced during an economic downturn. This highlights a critical aspect of the electoral cost of austerity: timing austerity during booms can save, if not improve, the electoral fortunes of governments.
Implications
Recent studies have linked the rise in populism to the austerity measures introduced after the Great Recession of 2007-2009 (Klein et al. 2022) which may have increased the vote for Brexit (Fetzer 2019). Our study has a more nuanced implication, suggesting that electoral risks can be navigated, and sometimes even turned to an advantage, through strategic, ideologically consistent, and well-timed policy decisions. In particular, the ideological congruence between a government’s policy actions and its electoral promises can go a long way in mitigating the electoral cost of austerity. When austerity is in alignment with a party’s pre-election manifesto, particularly for parties that have campaigned on reducing government spending or advocating for fiscal responsibility, such measures can be seen as the fulfilment of electoral commitments rather than a betrayal. Hence, fiscal responsibility can be politically viable if announced in a consistent and timely manner.
02 aprile 2024
CLIMATE POLARISATION AND GREEN INVESTMENT
Anders Anderson, David Robinson
(synthesis; full article Vox Eu CEPR 31 Mar 2024 https://cepr.org/voxeu/columns/climate-polarisation-and-green-investment)
Abstract: Climate change is a topic that is especially prone to political polarisation and ‘asymmetric updating’ – the tendency for people to assign more weight to information that conforms to prior beliefs and less weight to evidence that challenges those beliefs. This column reports on responses from two surveys in Sweden, separated by a heat wave, which revealed that while most people grew more concerned about climate change following the heat wave, men living in areas with a high vote count for the right-wing Swedish Democrat party grew less concerned on average. In general, individuals who became more concerned about climate change tilted their retirement portfolios towards funds with better climate risk scores.
Keywords: climate change, financial markets, green investments, voting behavior, climate polarization.
On a variety of complex issues ranging from immigration, climate change, gender identity, to foreign policy, we are confronted with a barrage of seemingly contradictory facts that we must sift through to form an informed opinion about the subject. Economists use the term ‘asymmetric updating’ to capture the idea that in these situations, we generally overweight information that conforms to our prior beliefs about the issue and underweight evidence that challenges those beliefs. Asymmetric updating is widely understood to be an important element in the rise of political polarisation that we see across the globe in many contexts. This polarisation is intimately connected to the rise in right-wing populism in Europe (Stöckl and Rode 2021).
Climate change is a topic that is especially prone to asymmetric updating and political polarisation. Although the pace of climate change may be accelerating quickly, it is in general a slow-moving process; it plays out over decades, not weeks or months. Decisions made by any one individual are unlikely to have any measurable impact on the climate, even large changes can occur with collective action. And at the same time, high-frequency variation in localised weather conditions can create confusion about the general direction of climate change. “If the earth is getting hotter, then why is it so cold outside?” is a common refrain among those falsely equate climate and weather.
In our study (Anderson and Robinson 2024), we were interested in understanding how perceptions of climate change impacted households’ willingness to make climate-friendly investments. This is a critical question in terms of understanding how finance and climate change interact. The traditional view is that as more capital flows into climate-friendly investment vehicles, the cost of capital for green investment projects falls, potentially speeding the pace of climate adaptation. Moreover, households’ willingness to make climate-friendly investments reflects how they incorporate climate considerations into the standard risk/return trade-off that is central to long-term retirement savings decisions. And at the same time, climate-friendly investment, and the broader trends towards environmental, social and governance (ESG) investment, have become polarizing issues in much of the world (Masters and Temple-West 2023).
To study these issues, we conducted two large-scale, nationally representative surveys of Swedish households – one in the winter of 2018, the second in the winter of 2019. The surveys measured their beliefs about the importance of climate change and how the beliefs were changing over time. In between the two surveys, during the summer of 2018, Sweden was rocked by record-breaking high temperatures. This heat wave was associated with over 50 different wildfires in Sweden and drew widespread media attention throughout northern Europe.
The analysis we conducted focused on two central questions. How did the heat wave change people’s beliefs about the severity and importance of climate change? And how did it affect people’s willingness to make climate-friendly investment choices?
Even though weather and climate are distinct natural phenomena, the first question is important because extreme weather events have been shown to act as wake-up calls in a number of settings. For example, Greenstone (2019) shows that more people in the US believe in climate change now than did five years ago, citing increasingly harsh weather as the reason for their changing views. Weather-induced preference shocks have been explored in various settings before including car purchases (Busse et al. 2015), real estate prices (Bernstein et al. 2019), stock prices (Choi et al. 2020), and pricing of options (Kruttli et al. 2021).
The answers we found here were surprising. Although the average respondent grew slightly more concerned about climate change between the two surveys, this modest shift in the average masked important differences of opinion. While most people grew more concerned, a sizeable fraction of individuals grew less concerned about climate change after the heat wave.
Leveraging the granularity of Swedish administrative data, we were able to map respondents to their voting precincts (see Figure 2). To study the role that political polarisation played in this divergence of opinion, we measured voter turnout at the precinct level for the Sweden Democrat (SD) party. The Sweden Democrats are a right-wing, populist party in Sweden that has gained significant popularity over the last several elections. They dispute climate change and they stand in vocal opposition to Sweden’s commitments to fight climate change. In addition, party leaders peddle misinformation about the nature, scale, and severity of climate change to support their positions. We compared individuals who lived in areas with high voter turnout for this party to areas with low voter turnout.
Respondents in high-SD areas were generally less concerned about climate change and less likely to think it necessary for the government to take action to fight it. While on average, men in our survey who lived closer to areas of extreme weather events grew more concerned about climate change, this effect was reversed among men in high SD areas, who grew less concerned (see Figure 1).
Figure 1 Temperature assessments in 2018 and 2019

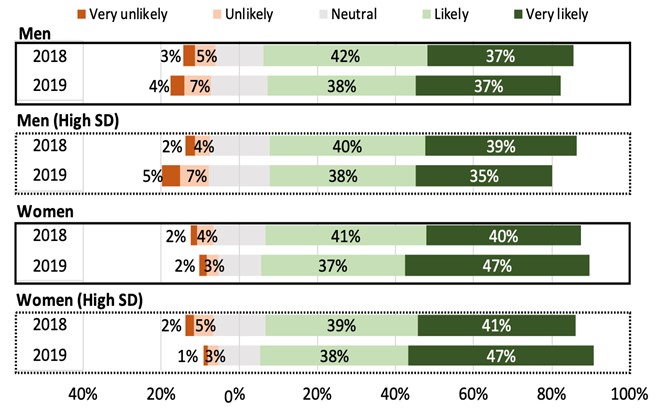
Note: This figure display survey responses to the question: “In the next 20 years, how likely is a one Centigrade increase in global temperature”. Responses are collected for the same 2,561 individuals in 2018 and 2019 and fall on a scale ranging from “Very unlikely” to “Very likely”. The results are presented separately for men and women living in high or low SD vote districts.
Next, we asked whether these opinions had any impact on retirement savings behaviour. To study this issue, we linked survey responses to mutual fund holdings in the Swedish pension system, which allows individuals to direct a portion of their pension savings to as many as five distinct mutual funds among several hundred that participate in the government savings system. The system features a web interface that makes it easy for investors to filter potential fund choices on ESG factors and a variety of other negative screens.
In general, individuals who became more concerned about climate change tilted their retirement portfolios towards funds that received better Morningstar climate risk scores. But this effect was concentrated solely in areas with low SD voter turnout. Among respondents living in high SD voter turnout areas, respondents who report being less concerned about climate change downweight fossil fuel exclusion funds in their retirement portfolios. Figure 2 Heat warnings and political polarisation

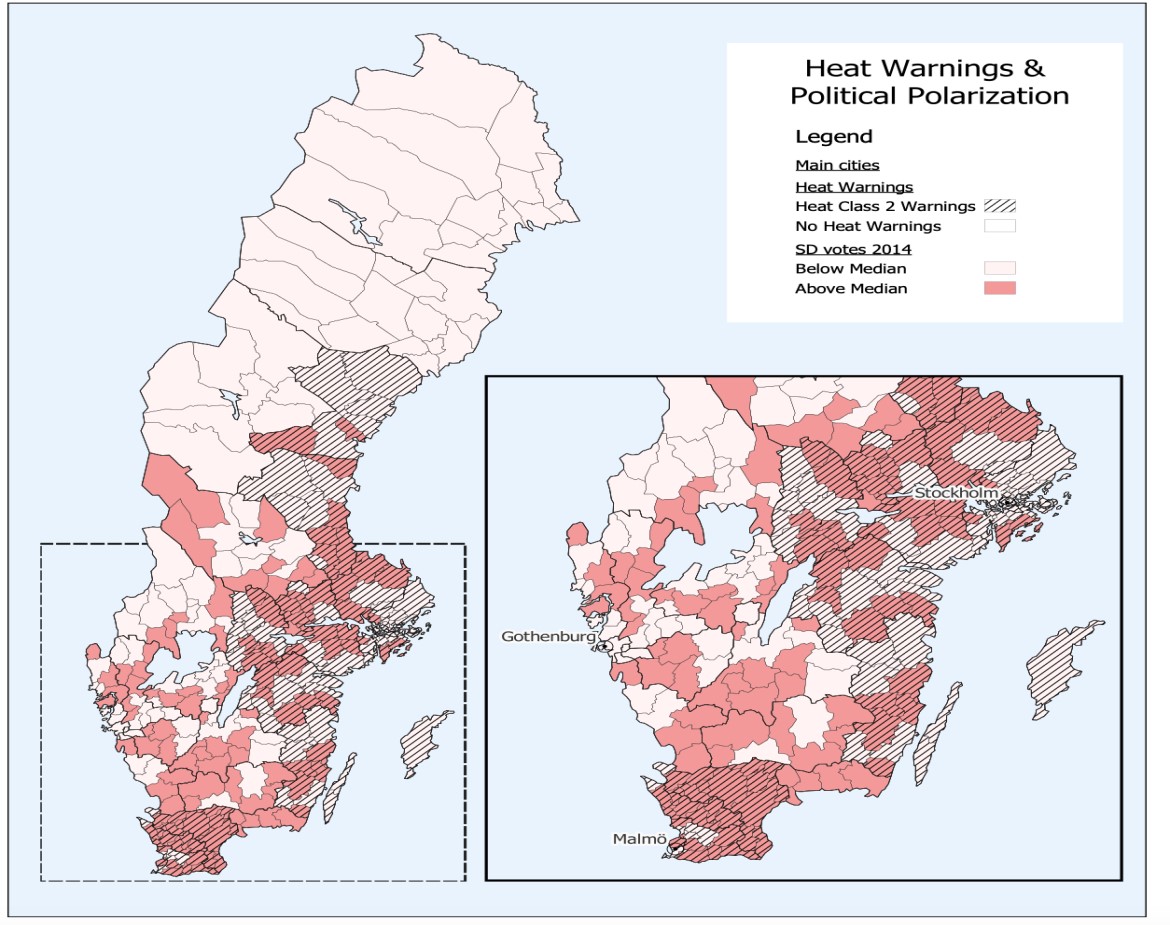
Note: This map shows voter turnout for the Sweden Democrat party along with the presence of severe heat warnings.
These findings illustrate the fact that political polarisation can shape investment behaviour in capital markets by ordinary households. The results take on additional importance when placed in the broader context of the Swedish retirement system, which went from having almost no fossil fuel exclusion funds among its choices to being dominated by them. As concerns about climate change become increasingly acute, understanding the role of behavioural forces operating at the individual level and how these forces aggregate into market-level outcomes is an important topic for academics, market participants, and policymakers alike.
25 marzo 2024
HOW THE FINANCIAL AUTHORITIES CAN TAKE ADVANTAGE OF ARTIFICIAL INTELLIGENCE
Jon Danielsson, Andreas Uthemann
(synthesis; full article Vox Eu CEPR 19 Mar 2024 https:// https://cepr.org/voxeu/columns/how-financial-authorities-can-take-advantage-artificial-intelligence)
Abstract: Artificial intelligence will both be of considerable help to the financial authorities and bring new challenges. This column argues the authorities risk irrelevance if they are reluctant and slow in engaging with AI, and discusses how the authorities might want to approach AI, where it can help, and what to watch out for.
Keywords. Artificial intelligence, machine learning, productivity, innovation.
Artificial intelligence (AI) will likely be of considerable help to the financial authorities if they proactively engage with it. But if they are conservative, reluctant, and slow, they risk both irrelevance and financial instability.
The private sector is rapidly adopting AI, even if many financial institutions signal that they intend to proceed cautiously. Many financial institutions have large AI teams and invest significantly; JP Morgan reports spending over $1 billion per year on AI, and Thomson Reuters has an $8 billion AI war chest. AI helps them make investments and perform back-office tasks like risk management, compliance, fraud detection, anti-money laundering, and ‘know your customer’. It promises considerable cost savings and efficiency improvements, and in a highly competitive financial system, it seems inevitable that AI adoption will grow rapidly.
As the private sector adopts AI, it speeds up its reactions and helps it find loopholes in the regulations. As we noted in Danielsson and Uthemann (2024a), the authorities will have to keep up if they wish to remain relevant.
So far, they have been slow to engage in their approach to AI and will find adopting AI challenging. It requires cultural and staff changes, supervision will have to change, and very significant resources will have to be allocated.
Pros and cons of AI
We see AI as a computer algorithm performing tasks usually done by humans, such as giving recommendations and making decisions, unlike machine learning and traditional statistics, which only provide quantitative analysis. For economic and financial applications, it is particularly helpful to consider AI as a rational maximising agent, one of Norvig and Russell’s (2021) definitions of AI.
AI has particular strengths and weaknesses. It is very good at finding patterns in data and reacting quickly, cheaply, and usually reliably.
However, that depends on its having access to relevant data. The financial system generates an enormous amount of data, petabytes daily. But that is not sufficient. A financial sector AI working for the authorities should also draw knowledge from other domains such as history, ethics, law, politics, and psychology, and to make connections between different domains, it will have to be trained on data that contain such connections. Even if we can do so, we don’t know how AI that has been fed with knowledge from a wide set of domains and high-level objectives will perform. When made to extrapolate, its advice might be judged as entirely wrong or even dangerous by human experts.
Ultimately, this means that when extrapolating from existing knowledge, the quality of its advice should be checked by humans.
How the authorities can implement AI
The financial authorities hold a lot of public and private information that can be used to train AI, as discussed in Danielsson and Uthemann (2024b), including:
- Observations on past compliance and supervisory decisions
- Prices, trading volumes, and securities holdings in fixed-income, repo, derivatives, and equity markets
- Assets and liabilities of commercial banks
- Network connections, like cross-institution exposures, including cross-border
- Textual data
- The rulebook
- Central bank speeches, policy decisions, staff analysis
- Records of past crisis resolution
- Internal economic models
- Interest rate term structure models
- Market liquidity models
- Inflation, GDP, and labour market forecasting models
- Equilibrium macro model for policy analysis
Data are not sufficient; it also requires considerable human resources and compute. Bloomberg reports that the median salary for specialists in data, analytics, and artificial intelligence in US banks was $901,000 in 2022 and $676,000 in Europe, costs outside the reach of the financial authorities. This is similar to what the highest-paid central bank governors earn. Technical staff earn much less (see for example Borgonovi et al. 2023 for a discussion on the AI skill market).
However, it is easy to overstate these problems. The largest expense is training AI on large publicly available text databases. The primary AI vendors already meet that cost, and the authorities can use transfer learning to augment the resulting general-purpose engines with specialised knowledge at a manageable cost.
Taking advantage of AI
There are many areas where AI could be very useful to financial authorities.
It can help micro authorities by designing rules and regulations and enforcing compliance with these rules. While human supervisors would initially make enforcement decisions, reinforcement learning with human feedback will help the supervisory AI become increasingly performant and, hence, autonomous. Adversarial architectures such as generative adversarial networks might be particularly beneficial in understanding complex areas of authority-private sector interactions, such as fraud detection.
AI will also be helpful to the macro authorities, such as in advising on how to best cope with stress and crises. They can run simulation scenarios on alternative responses to stress, advise on and implement interventions, and analyse drivers of extreme stress. The authorities could use generative model models as artificial labs to experiment on policies and evaluate private sector algorithms.
AI will also be useful in ordinary economic analysis and forecasting, achievable with general-purpose foundation models augmented via transfer learning using public and private data, established economic theory, and previous policy analysis. Reinforcement learning with feedback from human experts is useful in improving the engine. Such AI would be very beneficial to those conducting economic forecasting, policy analysis and macroprudential stress tests, to mention a few.
Risks arising from AI
AI also brings with it new types of risk, particularly in macro (e.g. Acemoglu 2021). A key challenge in many applications is that the outcome needs to cover behaviour that we rarely observe, if at all, in available data, such as complicated interrelations between market participants in times of stress.
When AI does not have the necessary information in its training dataset, its advice will be constrained by what happened in the past while not adequately reflecting new circumstances. This is why it is very important that AI reports measures of statistical confidence for its advice.
Faced with all those risks, the authorities might conclude that AI should only be used for low-level advice, not decisions, and take care to keep humans in the loop to avoid undesirable outcomes. However, that might not be as big a distinction as one might think. Humans might not understand AI’s internal representation of the financial system. The engine might also act so as to eliminate the risk of human operators making inferior choices, in effect becoming a shadow decision-maker.
While an authority might not wish to get to that point, its use of AI might end up there regardless. As we come to trust AI analysis and decisions and appreciate how cheaply and well it performs in increasingly complex and essential tasks, it may end up in charge of key functions. Its very success creates trust. And that trust is earned on relatively simple and safe repetitive tasks.
As trust builds up, the critical risk is that we become so dependent on AI that the authorities cannot exercise control without it. Turning AI off may be impossible or very unsafe, especially since AI could optimise to become irreplaceable. Eventually, we risk becoming dependent on a system for critical analysis and decisions we don’t entirely, or even partially, understand.
Six criteria for AI use in financial policy
These issues take us to six criteria for evaluating AI use in financial policy.
- Data. Does an AI engine have enough data for learning, or are other factors materially impacting AI advice and decisions that might not be available in a training dataset?
- Mutability. Is there a fixed set of immutable rules the AI must obey, or does the regulator update the rules in response to events?
- Objectives. Can AI be given clear objectives and its actions monitored in light of those objectives, or are they unclear?
- Authority. Would a human functionary have the authority to make decisions, does it require committee approval, or is a fully distributed decision-making process brought to bear on a problem?
- Responsibility. Does private AI make it more difficult for the authorities to monitor misbehaviour and assign responsibility in cases of abuse? In particular, can responsibility for damages be clearly assigned to humans?
- Consequences. Are the consequences of mistakes small, large but manageable, or catastrophic?
We can then apply these criteria to particular policy actions, as shown in the following table.
Table 1Particular regulatory tasks and AI consequences

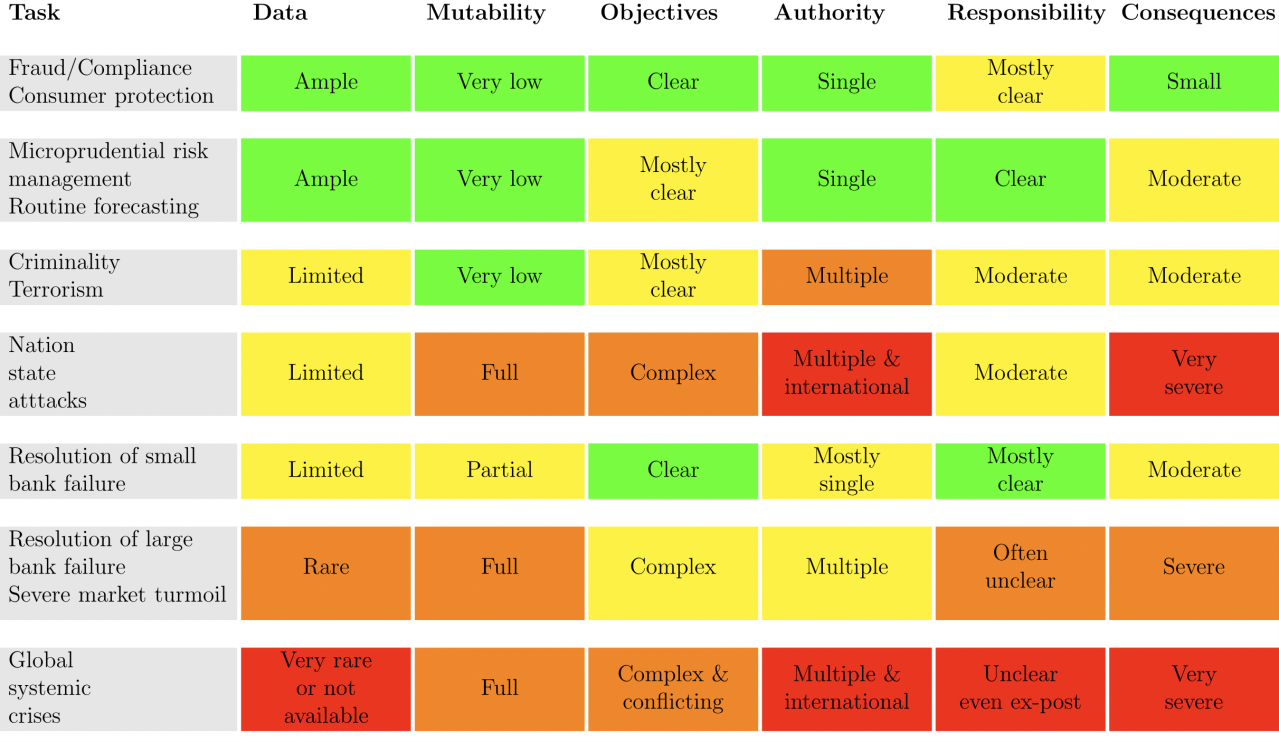
Conclusion
AI will be of considerable help to the financial authorities, but there is also significant risk of authorities losing control due to AI.
The financial authorities will have to change how they operate if they wish to remain effective overseers of the financial system. Many authorities will find that challenging. AI will require new ways of regulating, with different methodologies, human capital, and technology. The very high cost of AI and the oligopolistic nature of AI vendors present particular challenges. If then the authorities are reluctant and slow to engage with AI, they risk irrelevance.
However, when the authorities embrace AI, it should be of considerable benefit to their mission. The design and execution of micro-prudential regulations benefit because the large volume of data, relatively immutable rules, and clarity of objectives all contribute to AI’s strength.
It is more challenging for macro. AI will help scan the system for vulnerabilities, evaluate the best responses to stress, and find optimal crisis interventions. However, it also carries with it the threats of AI hallucination and, hence, inappropriate policy responses. It will be essential to measure the accuracy of AI advice. It will be helpful if the authorities overcome their frequent reluctance to adopt consistent quantitative frameworks for measuring and reporting on the statistical accuracy of their data-based inputs and outputs.
The authorities need to be aware of AI benefits and threats and incorporate that awareness into the operational execution of the services they provide for society.
8 novembre 2021
NISHANT YONZAN, BRANKO MILANOVIC, SALVATORE MORELLI, JANET GORNICK 05 NOVEMBER 2021
Mind the gap: Disparities in measured income between survey and tax data
(synthesis; full article – Vox Eu CEPR 09 November 2021 https://voxeu.org/article/disparities-measured-income-between-survey-and-tax-data)
Abstract: Household survey data and tax data both suffer from measurement concerns at the top of the income distribution. This column analyses data from the US to investigate when and why the two data sources diverge. The authors conclude that the source of the divergence lies in the measurement of non-labour income as tax rules change over time.
Keywords: Tax data, tax exemptions, evasion, avoidance, misreporting, income, survey.
Household survey data have been widely used for understanding, among other things, the welfare of individuals and families within and across countries. However, as is well known, household surveys do not fully capture the top of the income distribution – whether due to misreporting or various forms of non-response (i.e. refusal to participate or to provide specific information) (e.g. Korinek et al. 2006, Lustig 2020, Ravallion 2021). The existing literature suggests that tax data lead to estimates of top income shares that are generally larger than those found using household survey data (e.g. Burkhauser et al. 2012 for the US comparing CPS data to tax-based estimates from Piketty and Saez 2003, Bartels and Metzing 2019 for Germany, and Burkhauser et al. 2017 for the UK).
Tax data are also not immune to measurement concerns arising from, among other factors, tax exemptions, evasion, avoidance, and misreporting (e.g. Piketty et al. 2011). Furthermore, definitions of income in tax data vary as a function of the types of income that are taxed in a given country and time; the nature of tax units also depends on overarching rules, such as whether couples can file jointly, separately, or both.
It has been argued that combining the two data sources can produce better estimations of the distribution of income. The difficult part, however, is knowing where discrepancies occur and why.1 Two questions thus arise: (1) at what point in the income distribution does the gap in income between survey and tax data become problematic such that using tax data is beneficial? (the where); and (2) what is the source of this gap? (the why).
Exploring this in detail is difficult because of differing definitions of income and recipient units. However, thanks to the flexibility of harmonised microdata available from the Luxembourg Income Study (LIS) Database, it is possible to use household survey data to fully match (‘mimic’) the relevant tax data, and to uncover the sources of discrepancies. In a recent paper (Yonzan et al. 2021), using survey-based data from the LIS Database and income tax data from various sources (for the US, Piketty and Saez 2001, Saez 2015), we find that the discrepancy arises only at the very top of the income distribution. The main source of discrepancy is non-labour income, and the reason for changes in this discrepancy over time appears to be the elasticity of taxable incomes to tax policies.
In what follows, we first lay out the necessary adjustments to the data that would allow an apples-to-apples comparison between income from survey data and income from tax data. With those adjustments in place, we then investigate where in the income distribution the disparities begin. And finally, we discuss why these discrepancies might occur and are changing over time. In our paper, we present results for France, Germany, and the US. Here we discuss these results for the US.
There are several reasons why estimates of top income shares may diverge between tax and survey data. First, as already mentioned, the income definitions may differ. Second, the units of analysis – tax units versus household survey units – may differ. Third, the two types of data are plagued by different under-reporting problems. Whereas tax data suffer from tax exemptions, evasion, and avoidance, household survey data suffer from misreporting, and different forms of non-response. Fourth, even in the absence of non-response problems, household survey data may return biased estimates of top income shares if their sampling frame does not allow for adequate sampling of rich households. While the first two are mechanical differences and easier to correct, the latter two are behavioural and statistical in nature and require more assumptions.
Thanks to the flexibility of the LIS microdata, we are able to minimise the mechanical discrepancies between the two data sources – namely, the use of different units and different income definitions. Figure 1 compares the number of units in household survey data (Survey-raw) to the number of units in tax data (Tax-raw) for the US in 2013. The centre bar is reconstructed from survey households to match the definition of units in the tax data, which are couples and/or single adults with or without dependents. Using surveys, we estimate incomes for 160.9 million US units versus 163 million units that report their income to the US Internal Revenue Service. Similarly, utilising the flexibility of the LIS data, we construct income from survey data to match the definition of income reported to tax authorities.
Having made these mechanical adjustments, we are better able to compare the resulting incomes from survey and tax data. However, we do note that the behavioural and statistical issues remain, and these issues could very well be contributing to the discrepancies in our findings.
Figure 1 Number of units of analysis in survey and tax data for the US in 2013
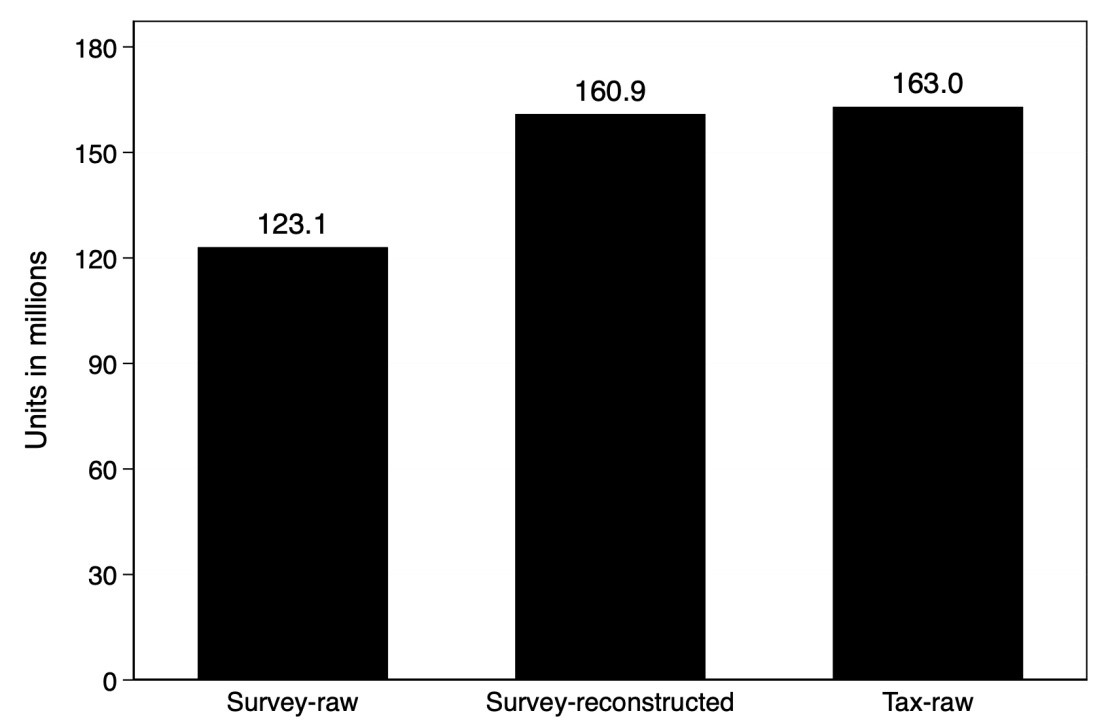
Notes: This figure shows the total number of units in the US in 2013. The total number of households (Survey-raw) is the aggregate (weighted) number of households in the LIS US 2013 dataset; the Survey-reconstructed is the total number of tax units constructed to match the tax data; and the Tax-raw is the total units in tax data. The units are presented in millions.
Where is the gap?
We find that, in the US, the gap between survey and tax incomes is problematic only for the very top percentile of the income distribution. Figure 2 compares the trends in income shares of the top income groups – namely, the top 1% and the top 4% below the top 1% (top 5–1%) – in the two data sources. While there is a gap in income shares calculated using the two data sources for the top 1%, this gap is minimal, if any, for the top 5–1%. Note also that this gap has been growing over time. Figure 2 additionally highlights the Tax Reform Act of 1986 (TRA 1986), which provided incentives for shifting income between various sources of reported income (Atkinson et al. 2011). Income shifting – that is, reporting a type of income in one tax category in one year and then shifting it to another category in another year in order to minimise tax liability – could be one reason for the increasing gap in the income share of the top 1% group between the survey and tax data. This example shows how changes in tax policies, which induce changes in behaviour, can wreak havoc on the observed composition of income.
Figure 2 Trends in income share of top income groups in the US
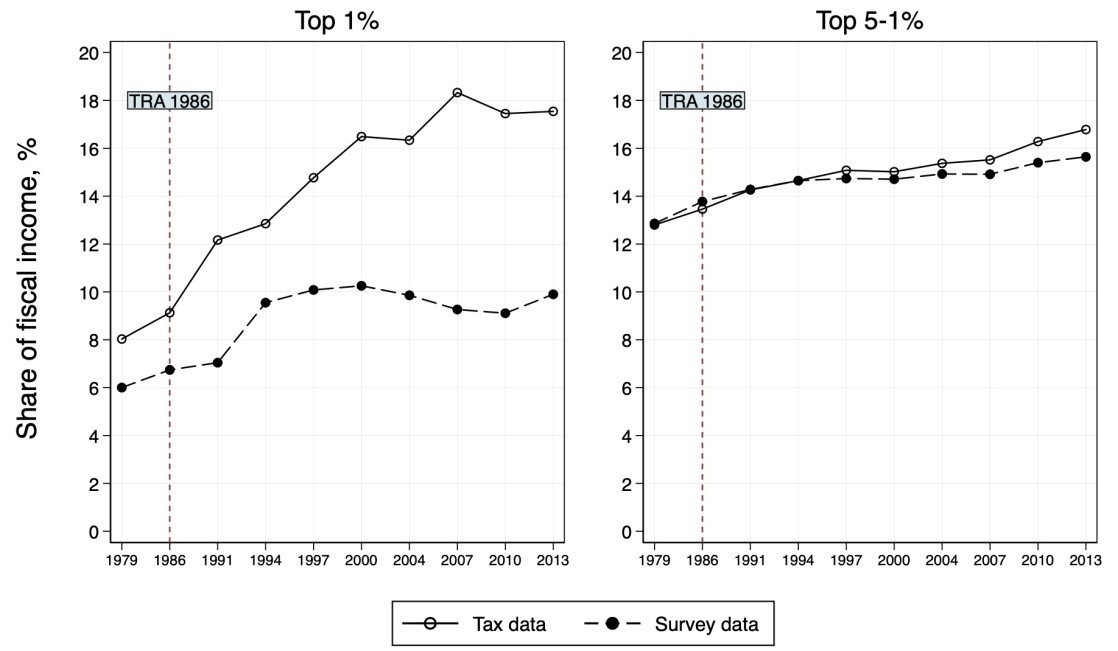
Notes: This figure shows the trend in the shares of the fiscal income held by the top 1% and the next 4 percentile of top earners (top 5-1%) in the US using the survey and tax data. The vertical line at 1986 highlights the year that the Tax Reform Act of 1986 (TRA 1986) was passed in the US.
Why does the gap exist?
Why would tax incentives such as TRA 1986 affect mainly the very rich? It is because the rich have more of their income stemming from non-labour sources (which includes business and capital incomes). Figure 3 shows the shares of income from labour and non-labour for the US in 2013. It compares three groups from within the top income decile. While, for the nine percentiles below the top one, the shares of income derived from labour and non-labour are nearly the same in the two sources, within the richest percentile, the non-labour portion of income is significantly greater in the tax data. The source of the rising gap also lies in non-labour income. Whereas in 1986, the year TRA 1986 was passed, only half of the gap between the survey and tax data was due to the non-labour income component (with none of this attributable to business income), by 2013, four fifths of the gap was attributable to non-labour income (with more than three fifths directly due to business income).2
Figure 3 Comparison of income composition for top income groups in the US in 2013
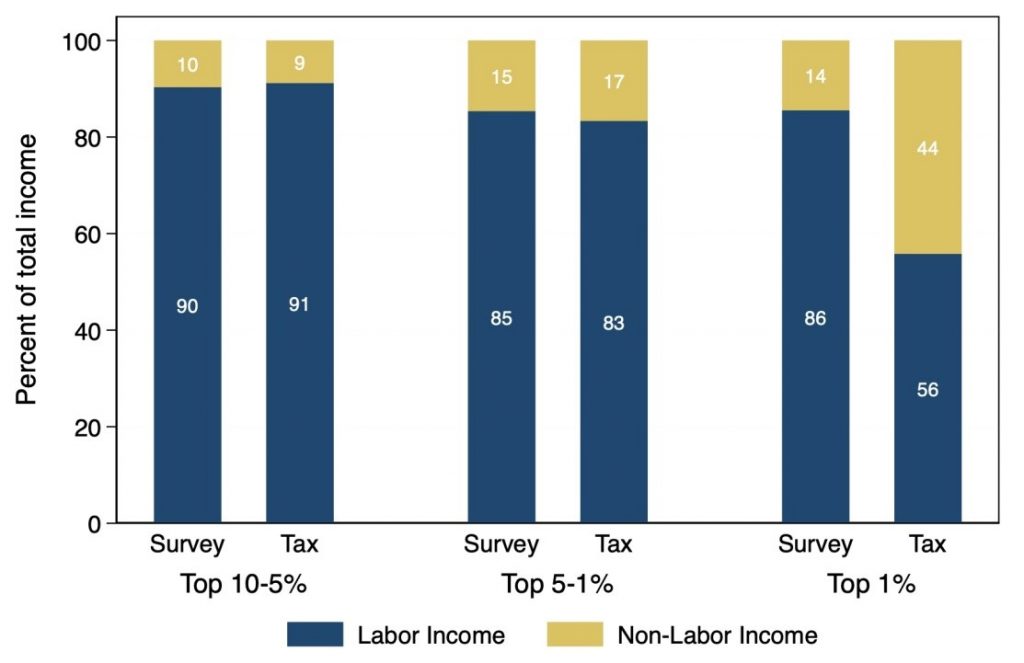
Notes: This figure shows the disaggregation of total income (in percent) by income components (labour and non-labour) held by each income groups in the US for the year 2013. Income groups represent the top percentile (top 1%), the next four percentiles (top 5-1%), and the bottom five percentiles of the top decile (top 10-5%). Non-labour income includes income from business (or self-employment) and income from capital.
Conclusions
What conclusions can we draw based on this evidence? First, for 99% of the population, survey and tax data agree, both in absolute amounts of income (not shown here, but discussed in our paper) and in shares of labour and non-labour income. (The divergence appears only for the top 1% of the population.) Second, the source of that divergence lies in non-labour income only. Third, the cause of the divergence over time appears to be income-shifting due to a change in tax rules. The last point, if confirmed, highlights the problem of using income and income components from tax data in temporal analysis without acknowledging the fact that both are ‘endogenous’, in the sense that they are affected by public policy changes in how various income sources are taxed. Another possible source of discrepancy is tax evasion and/or avoidance, but we cannot assess that directly due to data limitations.
27 aprile 2021
MICHELE LIMOSANI
Messina: un’istantanea sull’economia della città
(Published on 05.03.2021; full text with images: http://parliamentwatch.it/wp-content/uploads/2021/04/Report-Limosani.pdf)
Abstract:
Nell’ambito della collaborazione fra l’Università di Messina e Libellula, un progetto di Parliament Watch, che ha il fine di sperimentare pratiche di monitoraggio civico, il docente ed economista Michele Limosani, Direttore del Dipartimento di Economia dell’Ateneo messinese, ha prodotto il report “Messina: un’istantanea sull’economia della città”, che fotografa la attuale condizione dell’economia messinese, e nel contempo indica possibili soluzioni per una ripresa economica, auspicando che una crisi così profonda possa essere trasformata in un’occasione storica per ridare un futuro di speranza alle nuove generazioni.
Keywords: Messina, Area dello Stretto, crisi economica, sistema produttivo economico.
Premessa
Obiettivo di questo Report è quello di offrire un’istantanea sullo stato di salute economico della nostra città soffermando la nostra attenzione sui “fondamentali” del sistema, cioè quelle grandezze economiche sulle quali poggia l’intera costruzione del sistema produttivo locale; guarderemo al motore della macchina, per usare una metafora cara agli appassionati di automobili, trascurando per il momento di considerare, per quanto importanti, la carrozzeria e gli accessori. La foto del sistema che si propone è quindi un’istantanea ed è naturale pensare che “ciò che siamo e osserviamo oggi” sia anche il risultato della storia e delle scelte pregresse di politica economica operate dai vari governi nazionali, regionali e dalla classe dirigente locale. Quanto dobbiamo andare indietro nel tempo per cercare di individuare quegli eventi che continuano a produrre effetti sulla realtà sociale ed economica? La questione è controversa. Secondo alcuni studiosi non è possibile comprendere l’economia di una città come Messina fuori da una vicenda più generale che riguarda la storica questione meridionale. Esiste nel paese un vivace dibattito sulle origini del dualismo anche grazie a un rinnovato interesse di osservatori, giornalisti e storici che hanno di recente proposto una rilettura del processo di unificazione del Paese. È certamente un dibattito che merita approfondimenti e ulteriori discussioni ma che necessita di competenze di storia economica e una paziente e rigorosa ricostruzione dei fatti alla luce di una consolidata metodologia storiografica. In queste pagine, comunque, eviteremo di addentrarci in questa vicenda. Certo, penserete, la nostra città non può avere la pretesa di rappresentare l’intera situazione dell’economia del Mezzogiorno! È vero, ma è tuttavia un importante caso di studio; stiamo parlando della tredicesima città d’Italia, una delle sei città metropolitane del Sud d’Italia insieme a Bari, Napoli, Reggio Calabria, Catania e Palermo. Il Report è pensato per tutti coloro che desiderano ricevere in poco tempo informazioni essenziali sul sistema economico in cui vivono e operano; in modo particolare, tuttavia, si rivolge ai più giovani, a coloro che stanno per assumere decisioni importanti per il loro futuro, sia in relazione agli studi universitari da compiere, sia all’eventuale lavoro o attività da intraprendere. La città ha bisogno di voi, della vostra passione, del vostro talento e del vostro profondo e genuino desiderio di cambiare le cose.
- La partecipazione al mercato del lavoro e la ricchezza delle famiglie
Quante persone lavorano in città? Messina registra una popolazione di circa 230 mila abitanti e 99 mila nuclei familiari; in media ogni famiglia è composta da 2/3 persone. Secondo gli ultimi dati disponibili provenienti dall’Agenzia delle Entrate, i contribuenti che hanno presentato dichiarazione fiscale in città sono più o meno 133 mila, il 58% della popolazione residente. Cioè per ogni soggetto che presenta dichiarazione al fisco esiste un soggetto che non dichiara redditi. Fermiamo la nostra attenzione (un fermo immagine) a quel 42% della popolazione residente in città (circa 100 mila persone) che non ha dichiarato alcun tipo di reddito. Se teniamo fuori da questo gruppo i giovani, ossia i soggetti di età compresa tra 0 e 19 anni, circa 40 mila persone, la rimanente popolazione (60 mila persone circa) includerà moltissime donne che hanno rinunziato da tempo a cercare lavoro e una cospicua fetta di soggetti che popolano il folto bosco del mercato nero, alcuni dei quali “sopravvivono” di espedienti. Una stima, sia pure imprecisa, delle persone che in questo segmento di popolazione vivono situazioni di profondo disagio, proviene dalle domande per il reddito di cittadinanza registrato in città nella fase Pre-covid, circa 18.000. Quanto guadagna un cittadino messinese? Il grafico 1 (p. 5) riporta la distribuzione dei redditi nella nostra città. Il 33% dei contribuenti dichiara redditi compresi tra 0 e 10.000 euro lordi, ossia tra 0 e 800 euro mensili lordi, il 40% è compreso tra 15.000 e 26.000 e quindi tra 1.200 e 2.200 euro mensili lordi. Il peso della tassazione sui redditi delle famiglie (IRPEF) in città ricade in massima parte sulla fascia di contribuenti con redditi medio-bassi (50% circa). I contribuenti inclusi nella fascia bassa (0-15 mila), infatti, pagano poche tasse per via delle esenzioni e delle aliquote più basse; quelli compresi nella fascia alta di reddito, (> 75 mila), per via del numero esiguo, forniscono uno scarso contributo. L’apparenza inganna. Su dieci persone che incontriamo quotidianamente e che dichiarano di lavorare (non in nero ovviamente), 5 non riescono a superare la soglia del reddito di povertà (3 su 5, poi, percepiscono redditi inferiori a 800 euro lordi mensili); 4 appartengono alla cosiddetta classe media, con una netta prevalenza di redditi medio-bassi e 1 solo soggetto sta molto bene. In una famiglia in cui lavorano due dipendenti forse si riesce a cumulare un reddito dignitoso. Il residuo fiscale, ossia la differenza tra quanto un cittadino versa in termini di tasse (dirette e indirette) e quanto riceve in termini di benefici legati alla spesa pubblica, sarà gioco forza negativo. È evidente, infatti, che – anche solo limitatamente alla imposta IRPEF – poche persone, e per di più con redditi medio bassi, dovranno finanziare la spesa pubblica per servizi che si rivolge a tutta la popolazione residente sul territorio; sanità, istruzione, pensioni sociali e sicurezza. Comunque sia, per il residuo fiscale possediamo solo una stima a livello regionale (elaborazioni su dati ISTAT) pari a -3.576 euro pro-capite (differenza tra valore della tassazione pro-capite 7.681 e spesa pubblica pro-capite 11.257); ma non c’è ragione di credere che il dato a livello locale sia poi così tanto diverso da quello regionale. Qual’ è la fonte di reddito? Che tipo di lavoro svolge il cittadino messinese? Messina, come il grafico 2 mostra, è una città di impiegati (dipendenti pubblici e privati) e di pensionati INPS, l’ente pubblico più “caro” ai messinesi. I redditi d’impresa e dei lavoratori autonomi sono marginali. Secondo le ultime statistiche della Camera di Commercio le aziende registrate nel comune di Messina sono poco più di 20.000 e la composizione settoriale è mostrata nel grafico 3. Nei settori della manifattura, del commercio, dell’edilizia e della ristorazione sono concentrate gran parte delle imprese, più del 60%. Molte imprese (si direbbe diverse migliaia a guardare attentamente i dati fiscali !!!) risultano formalmente registrate nell’albo della Camera di Commercio ma sono inattive. Sono circa 5.000, poi, le ditte individuali (il 25% del totale) che registrano perdite di esercizio e quindi presentano un imponibile pari a zero. 3.700, invece, sono i soggetti che dichiarano redditi da impresa, di cui 307 provenienti da aziende soggette alla contabilità ordinaria (ossia imprese che fatturano più di 400.000 euro l’anno nel settore dei servizi o di 700.000 negli altri settori) e 3.400 da imprese che operano in regime di contabilità semplificata (prevalentemente artigiani). In questa apparente fragilità del sistema emergono però alcuni dati confortanti. Sono, infatti, circa 126 le imprese di capitale distribuite nella provincia di Messina che fatturano più di cinque milioni di euro l’anno e operano prevalentemente nei settori dell’energia, dei trasporti, del credito, dei prodotti elettronici e per l’agricoltura, della grande distribuzione (alimenti, automobili, prodotti elettronici), nella vendita di materie prime (ferro e derivati del petrolio). Ci sono anche partecipate pubbliche, aziende sanitaria private, imprese di prodotti alimentari (caffè, acqua minerale, lavorazioni carni) e di costruzione. Sei aziende fatturano sopra i 50 milioni di euro e alcune società hanno pensato di quotarsi in borsa. Quanto vale la ricchezza delle famiglie? Secondo nostre elaborazioni sui dati di Banca d’Italia la ricchezza netta della famiglie nel Comune capoluogo è stimata intorno a un valore di 20 miliardi (il patrimonio in capo alle società di capitale non viene conteggiato). In particolare, poi, il 50% di questa ricchezza è rappresentato dalla casa; consistente, infatti, il numero di soggetti che dichiara redditi da immobili, ossia redditi provenienti da affitti di seconde case o di immobili per negozi e attività commerciali (circa 60.000). Il 15% della ricchezza, ancora, è detenuta liquida in conti correnti, 3 miliardi circa; il rimanente in altre attività finanziarie, tra cui titoli di Stato. Una fetta consistente del patrimonio delle famiglie (circa il 90%) è detenuto in attività finanziarie ritenute “sicure” – case, depositi bancari e titoli – e investita in attività non produttive. E questo è un grave problema!
3 Quale sarà il futuro del sistema economico della città?
Proviamo a immaginare la Messina del futuro a partire dai dati che abbiamo e tracciamo alcune linee di tendenza lungo le quali essa si muoverà in assenza di un piano o un intervento in grado di modificare radicalmente la dinamica del sistema. In poche parole, che città ci toccherà vedere tra 20 anni, se non facciamo nulla per cambiare le tendenze? Ora, se con una forte dose di ottimismo assumiamo che 1) la popolazione rimanga stazionaria, ossia il tasso di natalità permane uguale al tasso di mortalità (nei primi nove mesi del 2019 il saldo tra i nati e i morti è stato negativo -832); 2) il rapporto tra la popolazione residente e quella attiva (numero di occupati e persone in cerca di lavoro) si mantenga costante, allora è possibile avanzare due previsioni. La prima riguarda il numero dei pensionati che, tra venti anni, si attesterà ancora su un valore superiore al 40%. Gli impiegati di oggi, infatti, saranno la componente più importante dei pensionati di domani e le pensioni continueranno ad essere la maggiore fonte di reddito della città. Contrariamente a quanto accade oggi, tuttavia, i lavoratori che andranno via via in pensione nei prossimi anni “godranno” del regime contributivo e quindi, nel migliore dei casi, di una pensione pari a circa il 30% percento in meno dell’ultima retribuzione. Il welfare familiare, generosamente erogato dai nonni a favore dei figli e dei nipoti, conoscerà tempi duri. Seconda previsione: gli impiegati che andranno in pensione dovranno essere rimpiazzati da nuovi occupati. Ipotizzando un turn-over pari a 0,80, e cioè 8 nuove assunzioni per ogni 10 pensionati (un numero generoso rispetto ai dati attuali di quota 100), la quota di lavoratori dipendenti sarà, a regime, circa del 40%, il 10% in meno di quelli che attualmente dichiarano un reddito. Cosa ne sarà del rimanente 10%? Con buona probabilità finirà per alimentare il numero di coloro che fuggono dalla città o incrementare il serbatoio della disoccupazione, anche se questa percentuale potrebbe comunque essere un po’ sovrastimata a causa del calo delle nascite e quindi dalla decrescita della popolazione. La simulazione dunque lascia prevedere, se nulla cambiasse, un impoverimento generalizzato. La riduzione complessiva attesa dei redditi, infatti, determinerebbe un calo della domanda di beni e servizi con le professioni e gli esercizi commerciali sempre più in difficoltà. E poiché molte famiglie, per mantenere lo stesso tenore di vita e/o mantenere i figli emigranti, dovranno fare affidamento sulla ricchezza accumulata nel passato (prevalentemente immobilizzata nell’acquisto delle case), si potrà determinare un’ulteriore eccesso di offerta di immobili e quindi un probabile altro calo del loro valore. Insomma è prevedibile una drastica cura dimagrante dell’economia cittadina; per non parlare dello spopolamento, dell’invecchiamento della popolazione e della fuga di giovani qualificati. Certo, in linea teorica – anche accettando malvolentieri l’impoverimento dei futuri pensionati – è possibile sostenere che un tasso di sostituzione dei dipendenti pubblici e privati nel rapporto 1:1 potrebbe lasciare la situazione invariata. Basterebbe dunque chiedere tanti concorsi pubblici quanti sono coloro che vanno in pensione e sostenere le attività produttive private tradizionali (commercio, edilizia) in modo tale da assicurare il turn-over, lasciando che la stragrande maggioranza dei giovani in esubero rispetto alle necessità del mercato del lavoro continui ad emigrare in cerca di lavori più qualificati. Ci si può anche battere per assicurare tale obiettivo ma non credo sia un futuro di decrescita felice quello che vogliamo riservare ai nostri figli.
- Chi ha pagato il prezzo del Covid
La gran parte dei redditi dei nostri cittadini non ha subito forti riduzioni a causa del lockdown. I pensionati e i pubblici dipendenti hanno avuto i redditi garantiti dallo Stato. Anche per i dipendenti regolarmente assunti dalle imprese private lo Stato è intervenuto attraverso l’erogazione della cassa integrazione (quella in deroga), anche se con evidenti ritardi, difficoltà e importi ridotti in media del 25%. Nel caso dei redditi da lavoro autonomo (0,6% dei redditi complessivi) la situazione è più articolata. In primo luogo all’interno di tale categoria si trovano soggetti con fasce di reddito molto variegate; da coloro che guadagnano 15.000 euro l’anno (piccoli artigiani) a riconosciuti professionisti con redditi superiori ai 100.000 euro. Una parte dei lavoratori autonomi (avvocati, notai, commercialisti), poi, lavora a prestazione e spesso può risultare difficile individuare quante prestazioni sono state interrotte in questo periodo e poi parte del lavoro ha potuto continuare ad essere svolto in back office da casa o da studio. È pur vero, tuttavia, che in molte professioni (vedi quella degli avvocati, per esempio) i problemi di natura economica vengono da lontano ed è ragionevole pensare che la crisi del coronavirus li abbia soltanto fatti emergere nella loro cruda oggettività. La tipologia di redditi sicuramente più colpita dalla crisi, sono i redditi da impresa (circa 8000 soggetti in totale) e tra questi soprattutto quelli della piccola impresa, individuale e/o familiare, con pochi dipendenti, rimasta ferma in questo periodo; le piccole attività commerciali (bar, centri benessere, palestre), la ristorazione, gli alberghi, le associazioni culturali (cinema, teatro, cultura sport). Trattasi, comunque, di una piccola quota di soggetti rispetto al totale dei contribuenti. Rimane, infine, colpita duramente tutta la schiera di soggetti che non dichiara redditi, vive di espedienti, si muove nel mercato nero (si stima attorno a 20/25 mila persone) e di cui è impossibile valutare gli effetti. È stato stimato che, con un piccolo aumento una tantum in misura fissa dell’aliquota dell’addizionale comunale all’IRPEF dell’1% sui redditi di tutte quelle attività che non sono state influenzate dalla crisi covid (90%), si sarebbero potuti raccogliere più di 10 milioni di euro per sostenere la situazione di coloro che sono rimasti indietro durante la pandemia.
- Gli “irrinunciabili 10”
Dieci sono gli obiettivi di politica economica che l’azione di governo a livello nazionale, regionale e locale deve perseguire per consentire alla città di raggiungere uno standard di vita che sia comparabile con quello di altre città europee. Qualunque azione di politica economica o progetto, poi, dovrà essere esaminato e valutato in basa alla capacità di raggiungere tali obiettivi. Sono, ovviamente, linee di indirizzo che andranno poi successivamente declinate in specifiche misure e interventi; in estrema sintesi ecco l’elenco degli “irrinunciabili dieci”: a) Aumentare le opportunità e la partecipazione al mercato del lavoro delle donne e dei giovani e migliorare la qualità dei posti di lavoro. L’economia attuale genera molti lavori con scarsa qualifica e bassa retribuzione; b) Maggiore cura dell’ambiente e sostegno alle attività in grado di migliorare l’impatto sulle risorse naturali e ambientali; c) Emersione della diffusa e straripante economia sommersa e lotta alle organizzazioni criminali; d) Rigenerazione urbana e riqualificazione delle periferie; (Baracche) e) Connessioni infrastrutturali, materiali e digitali, della città al continente e agli altri centri metropolitani; f) Difesa del territorio e nuovo assetto idrogeologico; g) Migliorare l’organizzazione ed elevare la qualità dei servizi pubblici locali (trasporti, rifiuti, acqua, energia, spazi verdi); h) Rivoluzionare la macchina amministrativa e migliorare l’efficienza nella gestione dei servizi erogati dalla Pubblica amministrazione. Reclutamento di una nuova classe dirigente e riconoscimento del merito; i) Migliorare la quantità delle strutture e la qualità dei servizi sanitari, pubblici e privati. Serve una nuova sanità territoriale; j) Sostenere il trasferimento delle conoscenze tecnologiche dalla università e dai centri di ricerca CNR, INGV alle imprese: Il ruolo degli spin-off. Il raggiungimento di tali obiettivi spesso richiede una collaborazione con i livelli di governo superiore quello regionale ed in particolare quello nazionale ai quali la legge attribuisce le competenze normative. Su ognuno di questi obiettivi, inoltre, si potrebbe scrivere un capitolo di libro o di quello che gli esperti chiamano Piano Generale Strategico della nostra città. A proposito, l’ultimo – e forse anche il primo –, è stato scritto quasi vent’anni fa. È giunto il momento di elaborarne uno nuovo che corrisponda a sfide impensabili anche fino a poco tempo fa.
- Il dibattito al livello nazionale
Esiste nel paese uno storico e controverso dibattito riguardo alle possibili soluzioni per tentare di ridurre il gap tra le aree del paese, quelle del nord e quelle del mezzogiorno. Dal punto di vista teorico, riducendo ai minimi termini l’articolato dibattito, emergono tre posizioni. La prima suona così: al fine di recuperare il ritardo serve un intervento esterno (esogeno) in grado di creare direttamente posti e opportunità di lavoro; questo intervento, inoltre, deve essere portato avanti dallo Stato. Dobbiamo aumentare la spesa in investimenti per realizzare infrastrutture, sostenere le imprese, la formazione e la ricerca. Ci si può spingere anche a una nuova politica di industrializzazione del Sud con la presenza dello Stato o di un’agenzia autonoma per il Sud che decide e finanzia i progetti e partecipa, eventualmente, al capitale delle imprese. Servono poi maggiori trasferimenti di risorse dalle regioni più ricche del Nord a quelle del Sud per sostenere questi interventi. Questo modello è già stato sperimentato a partire dal secondo dopoguerra con l’istituzione della Cassa per il Mezzogiorno che in un primo periodo (1950-1965) fu libera di lavorare e implementare progetti in determinate aree del Mezzogiorno nella sola logica dello sviluppo e dell’eliminazione delle aree depresse, con successi molteplici: ma dopo, con l’interferenza della politica e la perdita di autonomia, l’intervento è degenerato in clientele e “ruberie”; La seconda posizione è quella che vede il Sud protagonista di uno sviluppo autopropulsivo (endogeno), un sistema capace di creare al proprio interno le opportunità di lavoro e di crescita. Lo Stato si limita ad accompagnare tali processi realizzando le infrastrutture materiali e immateriali necessarie a consentire la connessione dei territori e determinare gli incentivi economici che sostengono lo sviluppo. Per esempio, nel tentativo di attrarre risorse e investimenti esterni, il governo provvede alle incentivazioni fiscali ma la partita si gioca sulla capacità dei territori di organizzare quelle azioni di sistema che rendono un’intera area competitiva e che sono in grado di ridurre i costi di produzione (lavoro, trasporto, logistica), l’inefficienza della burocrazia e promuovere la formazione, sostenere la ricerca e il trasferimento tecnologico; alimentare una clima culturale che guarda con favore le attività imprenditoriali. Questo modello non è mai stato sperimentato, nonostante abbia avuto importanti sostenitori (ieri, da Giustino Fortunato a Mimì La Cavera, oggi, da Carlo Borgomeo a Gianfranco Viesti). È sicuramente il modello da prendere in considerazione. La terza posizione fa riferimento a coloro che, al di là dello sviluppo esogeno o endogeno, pensano che non sia necessario intervenire a tutti i costi per favorire un processo di convergenza che nella storia degli ultimi 50 anni ha drenato consistenti risorse finanziare con scarso risultato. Dobbiamo accettare una sorta di tendenza strutturale del sistema economico del paese verso la polarizzazione delle regioni attorno a due livelli di reddito; uno per il ricco Nord e uno per il più povero Sud, oltre che la ripresa del fenomeno migratorio per chi non avesse voglia di accettare lavori non qualificati e livelli di reddito più bassi. È una posizione rivendicata dai leghisti della prima ora e oggi sostenuta, sebbene non sempre in modo esplicito, da coloro che vogliono un’autonomia regionale molto spinta.
- C’è qualcosa che possiamo fare noi?
Per parte nostra possiamo fare due cose. La prima è cambiare il paradigma culturale e gestionale dell’amministrazione pubblica locale; è un nostro preciso obiettivo svolgere in modo efficiente le attività in cui le amministrazioni locali hanno specifiche competenze di indirizzo politico e di gestione. Ancora, una prima linea di attacco al sommerso (pagamento dei tributi locali) grava sulle nostre spalle, così come la responsabilità di programmare gli interventi sul territorio (piano regolatore) e di spendere bene le risorse europee e nazionali assegnate. La seconda funzione è strategica; elaborare un piano, una visione. Tra i vari settori produttivi in grado di aumentare l’occupazione, su quali settori la città dovrebbe puntare? Ambiente, turismo, energia, logistica? O cosa altro? Cosa succederà al commercio e all’edilizia? Tra le infrastrutture che ci connettono al continente e alle altre città metropolitane quali sono quelle prioritarie? A livello sanitario ci vogliamo limitare a un miglioramento generalizzato della qualità dei servizi sanitari e delle cure o puntare su alcune eccellenze? Come ridisegnare la configurazione urbanistica della città? Quale deve essere il rapporto della città con il mare? Le università di Messina e Reggio saranno più vicine impegnandosi a sostenere la nascita di un Politecnico del Mediterraneo dello Stretto, ovvero un polo di formazione tecnica e scientifica internazionale che guarda ai paesi del Mediterraneo? Come riqualificare le periferie? Quale modello di formazione professionale per creare le nuove professioni richieste dal territorio? Tutto ciò ovviamente dipende da noi; non può essere deciso da Roma né da Palermo. E su questi aspetti si gioca la vera grande sfida del cambiamento della nostra città.
- Serve unità, coesione e responsabilità
Il Presidente del Consiglio Mario Draghi nel suo discorso programmatico in Senato, in occasione del dibattito sulla fiducia al governo, ha rivolto al Parlamento l’appello all’unità, alla coesione e alla responsabilità. Davanti a una crisi senza precedenti e alla necessità di avviare un’azione di ricostruzione del paese, ha dichiarato Mario Draghi, «l’unità non è una opzione, l’unità è un dovere. Ma è un dovere guidato da ciò che ci unisce tutti: l’amore per l’Italia». Ora, allo stesso modo, è sotto gli occhi di tutti che la nostra città affronta la più profonda crisi economica dal secondo dopoguerra. La situazione economica e sociale era già difficile ma è stata resa drammatica dalla pandemia: due famiglie su quattro vivono in stato di povertà, il sistema produttivo è azzoppato, la disoccupazione ha raggiunto livelli di guardia. Le criticità storiche che hanno pesantemente condizionato lo sviluppo della città vanno definitivamente affrontate. È il momento di lavorare insieme, senza pregiudizi e rivalità. Decliniamo anche a livello locale l’invito del Presidente del Consiglio Draghi alla unità, coesione e responsabilità e poniamo le basi per la “rinascita” della città. In risposta alle grandi emergenze sanitaria, economica e sociale, la nostra comunità ha bisogno di recuperare il senso dell’appartenenza, condividere una meta comune, avviare una forte interlocuzione con il governo nazionale sulla base di pochi ma precisi obiettivi sui quali puntare per lo sviluppo della città. Una crisi così profonda può essere trasformata in un’occasione storica per ridare un futuro di speranza alle nuove generazioni.
12 aprile 2021
MICHELE LIMOSANI
Messina: un’istantanea sull’economia della città
(synthesis; full article – Gazzetta del Sud, Gli effetti della crisi, le criticità, i numeri: ecco come sta l’economia a Messina, di Lucio D’Amico, 5 Aprile 2021 -: https://messina.gazzettadelsud.it/articoli/economia/2021/04/05/gli-effetti-della-crisi-le-criticita-i-numeri-ecco-come-sta-leconomia-a-messina-a60048e5-5118-438c-8376-6ec20ca708dc/amp/)
Abstract: Obiettivo di questo saggio è offrire un’istantanea sullo stato di salute economica della città di Messina, popolata di dipendenti pubblici e di pensionati, colpita meno dal Covid rispetto ad altre realtà, rispetto alla quale sono drammatiche le previsioni per i prossimi 20 anni, se non si cambierà la visione strategica, soffermando l’attenzione sui pilastri fondamentali del sistema, cioè su quelle grandezze economiche sulle quali poggia l’intera costruzione del sistema produttivo locale.
Keywords: Messina, crisi economica, sistema produttivo locale, questione meridionale, Area dello Stretto, rilancio economico.
Obiettivo di questo Report è offrire un’istantanea sullo stato di salute economica della nostra città, soffermando l’attenzione sui “fondamentali” del sistema, cioè quelle grandezze economiche sulle quali poggia l’intera costruzione del sistema produttivo locale. La foto del sistema che si propone è proprio un’istantanea, ed è naturale pensare che ciò che siamo e che osserviamo oggi sia anche il risultato della storia e delle scelte pregresse di politica economica operate dai vari governi nazionali, regionali e dalla classe dirigente locale.
Messina registra una popolazione di circa 230 mila abitanti e di 99 mila nuclei familiari. La media è di 2-3 persone a famiglia. I contribuenti che hanno presentato dichiarazione fiscale in città sono circa 133 mila, il 58 per cento della popolazione residente. Per ogni soggetto che presentazione dichiarazione al fisco esiste un altro soggetto che non dichiara redditi. Parliamo di centomila delle duecentotrentamila persone. Se si tengono fuori i bambini, i ragazzi e i giovani tra zero e 19 anni (40 mila), restano 60 mila messinesi che o non lavorano o popolano il folto bosco del mercato nero o vivono di puri e semplici espedienti. Nella fase pre-Covid furono 18 mila le istanze presentate dai messinesi per il Reddito di cittadinanza.
Il 33 per cento dei contribuenti dichiara redditi compresi tra 0 e 10 mila euro lordi (tra 0 e 800 euro mensili lordi), il 40% è compreso tra 15 mila e 26 mila (fino a un massimo di 2200 euro lordi). Il peso della tassazione sui redditi delle famiglie (Irpef) in città ricade in massima sulla fascia di contribuenti con redditi medio-bassi (circa il 50 per cento). I contribuenti inclusi nella fascia bassa (0-15 mila), infatti, pagano poche tasse per via delle esenzioni e delle aliquote minori; quelli compresi nella fascia alta di reddito, per via del numero esiguo, forniscono uno scarso contributo. Il residuo fiscale, ossia la differenza tra quanto un cittadino versa in termini di tasse (dirette e indirette) e quanto riceve in termini di benefici legati alla spesa pubblica sarà giocoforza negativo. È evidente, infatti che poche persone, e per di più con redditi medio-bassi, dovranno finanziare la spesa pubblica per servizi (che si rivolge a tutta la popolazione residente sul territorio): sanità, istruzione, pensioni sociali e sicurezza. Su dieci persone che incontriamo ogni giorno e che dichiarano di lavorare (non in nero, ovviamente), 5 non riescono a superare la soglia del reddito di povertà, 4 appartengono alla cosiddetta classe media, con una netta prevalenza di redditi medio-bassi e un solo soggetto, dico 1, sta molto bene.
Messina è una città essenzialmente di impiegati e di pensionati Inps. I redditi d’impresa e dei lavoratori autonomi sono marginali. Poco più di ventimila sono le aziende registrate, secondo le ultime statistiche della Camera di Commercio, gran parte delle quali concentrate nei settori della manifattura, del commercio, dell’edilizia e della ristorazione. Diverse migliaia le imprese che risultano essere registrate ma sono inattive. Circa 5 mila le ditte individuali che registrano perdite di esercizio e presentano quindi un imponibile pari a zero.
In questa apparente estrema fragilità del sistema emergono anche alcuni dati confortanti. Sono, infatti, circa 126 le imprese di capitale distribuite nella provincia di Messina che fatturano più di 5 milioni di euro l’anno e operano prevalentemente nei settori dell’energia, dei trasporti, del credito, dei prodotti elettronici e per l’agricoltura, della grande distribuzione e della vendita di materie prime (ferro e derivati del petrolio). Ci sono poi le partecipate, aziende sanitarie private, imprese di prodotti alimentari e di costruzione. Sei aziende fatturano sopra i 50 milioni di euro e alcune società hanno pensato, o lo stanno facendo, di quotarsi in Borsa.
La ricchezza netta delle famiglie nel Comune capoluogo, secondo nostre elaborazioni sui dati di Banca d’Italia, è stimata intorno a un valore di 20 miliardi. In particolare, il 50% di questa ricchezza è rappresentato dalla casa; consistente è, infatti, il numero di soggetti che dichiara redditi da immobili, ossia redditi provenienti da affitti di seconde case o di immobili per negozi e attività commerciali (circa 60 mila). Il 15% della ricchezza è ancora detenuta liquida nei conti correnti, 3 miliardi circa. Il rimanente in altre attività finanziarie, tra le quali i titoli di Stato. Una fetta consistente del patrimonio delle famiglie (circa il 90%) è detenuto in attività finanziarie considerate sicure (case, depositi bancari e titoli) e investita in attività non produttive. E questo è un grave problema.
In poche parole, abbiamo immaginato come potrebbe essere la nostra città fra vent’anni, se non facciamo nulla per cambiare le attuali tendenze. Se assumiamo che la popolazione rimanga stazionaria, ossia il tasso di natalità permane uguale a quello di mortalità, e qui ci vuole una forte dose di ottimismo; se assumiamo che il rapporto tra la popolazione residente e quella attiva si mantenga costante, allora è possibile avanzare due previsioni. La prima riguarda il numero di pensionati che, tra 20 anni, si attesterà ancora su un valore superiore al 40 per cento. Gli impiegati di oggi saranno la componente più importante dei pensionati di domani e le pensioni continueranno a essere sempre più la maggiore fonte di reddito della città. Ma questi pensionati, che dovranno “godere” del regime contributivo, avranno un pensione pari a circa il 30 per cento in meno dell’ultima retribuzione. Il welfare, generosamente erogato dai nonni a favore dei figli e nipoti, conoscerà tempi duri. La seconda previsione è che gli impiegati che andranno in pensione dovranno essere rimpiazzati. Ipotizzando un turn-over pari a 0,80 (8 nuovi assunti su 10 pensionati), la quota di lavoratori dipendenti sarà a regime circa del 40%, il 10 per cento in meno di quelli che attualmente dichiarano un reddito.
Con buona probabilità quel 10% finirà per alimentare il numero di coloro che fuggono dalla città o incrementare il serbatoio della disoccupazione.
La gran parte dei redditi dei nostri concittadini non ha subito forti riduzioni a causa dei lockdown, i pensionati e i pubblici dipendenti hanno avuto i redditi garantiti dallo Stato, i dipendenti delle aziende private hanno avuto i benefici della cassa integrazione, anche se con evidenti ritardi e difficoltà, e importi ridotti in media del 25%.
Gli obiettivi indispensabili per consentire alla città di superare la crisi sono: incremento delle opportunità e della partecipazione al mercato del lavoro delle donne e dei giovani, maggior cura dell’ambiente, emersione dell’economia sommersa, rigenerazione urbana, connessioni infrastrutturali della città al Continente e alle altre città metropolitane, difesa del territorio, riorganizzazione dei servizi pubblici territoriali, rivoluzione della macchina amministrativa, qualità dei servizi sanitari, innovazione tecnologica. Questi obiettivi fanno parte di una visione strategica che la città deve darsi, incalzando i Governi centrali (Stato e Regione) ma anche dotandosi del coraggio necessario a compiere scelte e a portarle avanti fino in fondo. Una crisi così profonda può essere trasformata in una occasione storica per ridare un futuro migliore alle nuove generazioni.
29 marzo 2021
CHARLES GOODHART
Inflation after the pandemic: Theory and practice
(synthesis; full article – Vox Eu CEPR 13 June 2020 – https://voxeu.org/article/inflation-after-pandemic-theory-and-practice)
Abstract: The correlation between monetary growth and inflation has an historic pedigree as long as your arm. This column argues that rejecting the likelihood of (eventually) rising velocity following the current massive monetary expansion requires an alternative theory of inflation that has successfully eluded all of us thus far. Ignoring the potential inflationary dangers is the equivalent to an ostrich putting its head in the sand, and while the path towards disinflation may be well known, it simply isn’t available today.
Keywords: pandemic, inflation, monetary growth, inflationary dangers.
“Inflation is always and everywhere a monetary phenomenon in the sense that it is and can be produced only by a more rapid increase in the quantity of money than in output.” Thus, wrote Milton Friedman in 1970 (The Counter-Revolution in Monetary Theory). And for much of the rest of the last century that doctrine was treated as almost self-evident, and taught in most macroeconomic classes at our universities.
Of course, there are many qualifications, to many of which I contributed in my role as a Bank of England economist at the time. Let us take three such:
· First, the money stock is endogenous (even monetary base in a world where central banks use the short-term interest rate as their primary instrument). While inflation requires monetary growth to facilitate and enable it, it may not be the ultimate cause of that pressure. Using monetary measures alone to offset inflationary, or deflationary, pressures may be somewhat of a blunt instrument, and sometimes with undesirable side-effects, whereas focusing on the treatment of the deeper causes, though in concert with complementary monetary measures, could be preferable.
· Second, there are numerous definitions of monetary growth, and they frequently move in divergent ways.
· Third, and related to the second qualification, the velocity of each, or any, of these can change quite dramatically, even over short periods. An obvious example of the latter is the total collapse of the velocity of M0 in the aftermath of its huge expansion, via quantitative easing, following the Great Financial Crisis (GFC), in some large part because a combination of interest on excess reserves (IOER), regulation and a desire for liquidity moved commercial banks into a liquidity trap, where they were prepared to mop up excess reserves almost without limit, thereby disrupting the transmission mechanism to the broader monetary aggregates and the real economy beyond.
We are, of course, currently in a context where the velocity of broad money is dropping just about as fast as its overall supply is being expanded. This arises from a combination of massive involuntary saving (people cannot go on holiday, attend theatres, buy new clothes, etc.), equivalent falls in the incomes of those supplying such services (offset by various forms of fiscal expansion, such as paid furloughs), and precautionary savings. Yes, indeed, but that will not last. Sometime in the foreseeable future, shops, hotels, even theatres, will reopen and the related workers will be rehired. At this point, velocity will revert back towards normality. And what then?
The correlation between monetary growth and inflation has an historic pedigree as long as your arm. Rejecting the likelihood of (eventually) rising velocity following the current massive monetary expansion requires an alternative theory of inflation that has successfully eluded all of us thus far. Ignoring the potential inflationary dangers is the equivalent to an ostrich putting its head in the sand.
But to mix my metaphors, our typical central bank ostrich has another barrel to their gun. Thus, our typical central bank ostrich will say that, even should there be some resurgence in inflation (and it goes beyond a welcome offset to prior undershoots), “we know how to deal with it”. That position strikes me as an a-historical one, perhaps a consequence of economic history in our universities being relegated to a subsidiary status compared, for example, to mathematical mastery of DSGE models.
Even if the path towards disinflation is well known, it simply isn’t available today. The great difficulties that central banks had in raising interest rates sufficiently to conquer inflation in the 1970s are a stark reminder of the difficulties of lowering inflation. Remember Arthur Burns’ (1979) “Anguish of Central Banking”. It took the alignment of three key people – Steve Axilrod, a master monetary tactician/strategist at the Fed; Paul Volcker, a brave and determined Fed chairman; and Ronald Reagan, an understanding, patient and competent president – to bring off that difficult exercise, and what a difficulty it was! Nominal short-term rates went above 20% and real short-term rates were above 5%; there was a short-sharp recession; many less developed countries got into massive difficulties and almost defaulted; and the global systemically important banks were almost all, on a mark-to-market basis, insolvent. And that was at a time when the debt ratios, both in the public and private sectors, were far, far lower than today. Should we see inflation come back, and become expected – if only for a relatively short period of years – at a time when unemployment is likely to remain quite high and the debt ratios have gone through the roof, with over extended and fragile financial markets, is it really sensible to expect that central banks would be politically and socially allowed to raise interest rates on their own account sufficiently to bring
inflation back to target? After all, the vaunted independence of the central bank remains in the gift of each national government, except in the case of the ECB where it is protected by a treaty. But even there, should the ECB try to take back the subsequent inflationary surge by sharply raising interest rates, it would be sensible for the Mayor of Frankfurt to invest in equipment to deter riots and demonstrations.
Indeed, in the context of massive government deficits, and debt ratios rising sharply over 100%, (well over the level of Reinhart and Rogoff feared would normally cause serious economic problems), we may need to rethink how to adjust and protect the concept of central bank independence. A few brave economists have begun to think along such lines (e.g. Bianchi 2020, Cukierman 2020). I happen to believe that there are other and better ways to make such adjustments. But that is for another column.
22 marzo 2021
Anche a Messina servono unità e responsabilità. Ricostruiamo insieme
(synthesis; full article – Tempostretto February 18 2021 -: https://www.tempostretto.it/news/lappello-di-limosani-anche-a-messina-servono-unita-e-responsabilita-ricostruiamo-insieme.html)
Abstract: Una crisi economica senza precedenti deve indurre a una azione unitaria e coesa. Riportando al centro del dibattito politico il ruolo dello Stato e del Governo, il nuovo Presidente del Consiglio, che ha il compito di guidare l’Italia fuori dalla crisi più grave mai vissuta dall’Italia dal secondo dopoguerra e di avviare un piano di rilancio, per impostare un Recovery Plan in grado di accelerare il rilancio ha bisogno della cooperazione generale. Facendo un parallelismo, per salvare la città di Messina, occorre che tutte le forze in campo concorrano senza farsi condizionare dalle divisioni politiche, delineando un orizzonte comune per gli investimenti che guardi alle generazioni future e non agli interessi di parte del presente.
Keywords: Crisi economica, politica delle riforme, unità per lo sviluppo, ricostruzione del paese, piano di rilancio.
Il Presidente del Consiglio Mario Draghi ieri in Senato, riprendendo un preciso e inequivocabile invito del Presidente della Repubblica Sergio Mattarella, ha rinnovato al Parlamento l’appello all’unità, alla coesione e alla responsabilità. Davanti ad una crisi senza precedenti e alla necessità di avviare un’azione di ricostruzione del paese, ha dichiarato Mario Draghi, “l’unità non è una opzione, l’unità è un dovere. Ma è un dovere guidato da ciò che ci unisce tutti: l’amore per l’Italia”.
La crisi a Messina
Ora, allo stesso modo, è sotto gli occhi di tutti che la nostra città affronta la più profonda crisi economica dal secondo dopoguerra. La situazione economica e sociale era già difficile ma è stata resa drammatica dalla pandemia: due famiglie su quattro vivono in stato di povertà, il sistema produttivo locale è azzoppato, la disoccupazione ha raggiunto livelli di guardia. Le criticità storiche che hanno pesantemente condizionato lo sviluppo della città vanno definitivamente affrontate. E’ il momento di lavorare insieme, senza pregiudizi e rivalità.
L’appello
Da semplice cittadino, dunque, e interpretando anche un sentire diffuso nella nostra comunità, mi permetto di rivolgere pubblicamente un appello all’On. Cateno De Luca, sindaco della città di Messina, al Presidente del Consiglio Comunale Dr. Claudio Cardile e agli onorevoli Francesco D’Uva, Pietro Navarra e Matilde Siracusano, in rappresentanza delle forze politiche che sostengono il governo Draghi. “Facciamo nostro l’invito del Presidente della Repubblica Mattarella e del Presidente del consiglio Draghi alla unità, coesione e responsabilità”. Spesso vi abbiamo sentito dire, e non abbiamo motivo di dubitarne, di voler orientare la vostra azione politica al bene della città. E’ questo il momento di dare concretezza e puntuale riscontro alle vostre promesse.
Ricostruire Messina
E’ necessario, infatti, porre adesso le basi per la ricostruzione della città. In risposta alla grandi emergenze sanitaria, economica e sociale la nostra comunità ha bisogno di ritrovarsi attorno alla propria classe dirigente, avviare una forte interlocuzione con il governo nazionale ed individuare pochi ma grandi progetti sui quali puntare per la rinascita della città. 1. Infrastrutture materiali ed immateriali per essere connessi all’Europa; 2. Risanamento urbano; 3. Transizione green con interventi mirati nei settori dell’edilizia, dell’energia, dei rifiuti, dei trasporti, della biodiversità. Pochi progetti dunque ma che, insieme agli interventi e le proposte di riforma (burocrazia, giustizia, scuola) che verranno portati avanti dal governo nazionale, rappresentano il volano per il futuro sviluppo del territorio.
E’ un’occasione storica. I cittadini, ne sono sicuro, sapranno riconoscere il lavoro e lo sforzo di una classe dirigente che avrà avuto a cuore le sorti della città prima di ogni calcolo e di convenienza politica di parte. Uniti a Roma per salvare il paese; uniti a Messina per ridare un futuro di speranza alle nuove generazioni.
1 marzo 2021
MICHELE LIMOSANI
Come sarà Messina tra vent’anni
Abstract: Messina è una città i cui abitanti sono in gran parte pubblici dipendenti o pensionati e, a causa del forte disagio giovanile, si appresta ad essere teatro di una nuova grande fuga. Partendo dai dati attuali, a fronte di una un’economia locale fragile e dipendente e una condizione di disagio giovanile che non accenna a cambiare e potrebbe quindi condurre la città verso un impoverimento generalizzato, si prova a tracciare il quadro di una Messina nel futuro. A partire dai dati oggi disponibili, si anticipano le linee di tendenza dell’economia locale lungo le quali, in modo quasi automatico, essa si muoverà in assenza di un piano o di interventi in grado di modificare radicalmente la dinamica del sistema. In poche parole, la città nel 2040 rischia di trovarsi in una crisi resa ormai irreversibile.
Keywords : Messina, crisi economica, spopolamento, disoccupazione, pensionati.
Proviamo a fare un esperimento: immaginare la Messina del futuro a partire dai dati che abbiamo oggi a disposizione, anticipare quindi le linee di tendenza dell’economia locale lungo le quali, in modo quasi automatico, essa si muoverà in assenza di un piano o un intervento in grado di modificare radicalmente la dinamica del sistema. In poche parole, che città ci toccherà vivere tra 20 anni?
L’emorragia di giovani continua
Il dato di partenza è quello relativo al mercato del lavoro. Come è noto, tra tutti coloro che hanno presentato dichiarazioni fiscali alla Agenzie delle Entrate nell’ultimo anno il 40% ha dichiarato un reddito da pensione mentre il numero di soggetti che ha percepito redditi da lavoro dipendente, sia pubblico che privato, è risultato pari al 50%. In totale, quindi, le due categorie da sole rappresentano il 90% dei redditi generati in città. Da non trascurare, poi, l’allarmante dato sulla perdita del “capitale umano”; in un recente rapporto l’Istat indica che la probabilità di un laureato tra i 25 e 39 anni di lasciare il Sud è compresa tra il 31% e il 35%; più di un laureato su tre se ne va.
Una città di pensionati
Ora, se con una forte dose di ottimismo assumiamo che 1) la popolazione rimane stazionaria, ossia il tasso di natalità permane uguale al tasso di mortalità (nei primi nove mesi del 2019 il saldo tra i nati e i morti è stato negativo -832); 2) il rapporto tra la popolazione residente e quella attiva (numero di occupati e persone in cerca di lavoro) si mantiene costante, allora è possibile avanzare due previsioni. La prima riguarda il numero dei pensionati che, tra venti anni, si attesterà ancora su un valore superiore al 40%. Gli impiegati di oggi, infatti, saranno la componente più importante dei pensionati di domani e le pensioni continueranno ad essere la maggiore fonte di reddito della città. Contrariamente a quanto accade oggi, tuttavia, i lavoratori che andranno via via in pensione nei prossimi anni “godranno” del regime contributivo e quindi, nel migliore dei casi, di una pensione pari a circa il 30% percento in meno dell’ultima retribuzione. Il “welfare familiare”, generosamente erogato dai nonni a favore dei figli e dei nipoti, conoscerà tempi duri.
La grande fuga
Seconda previsione: gli impiegati che andranno in pensione dovranno essere “sostituiti” da nuovi occupati. Ipotizzando un turn-over pari a 0,80, e cioè 8 nuove assunzioni per ogni 10 pensionati (un numero generoso rispetto ai dati attuali di quota 100), la quota di lavoratori dipendenti sarà, a regime, circa del 40%, il 10% in meno di quelli che attualmente dichiarano un reddito. Cosa ne sarà di questo 10%? Con buona probabilità finirà per alimentare il numero di coloro che fuggono dalla città o incrementare il serbatoio della disoccupazione, anche se questo valore potrebbe comunque essere un po’ sovrastimato a causa del calo delle nascite e quindi dalla decrescita della popolazione.
Cura dimagrante per l’economia
Gli indicatori a nostra disposizione, dunque, disegnano un’economia locale fragile e dipendente e una condizione di disagio giovanile che, se nulla cambia, potrebbe condurre la città verso un impoverimento generalizzato. La riduzione complessiva attesa dei redditi, infatti, determinerebbe un calo della domanda di beni e servizi con le professioni e gli esercizi commerciali sempre più in difficoltà. E poiché molte famiglie per mantenere lo stesso tenore di vita dovranno fare affidamento sulla ricchezza accumulata nel passato (prevalentemente immobilizzata nell’acquisto delle case), si potrebbe assistere ad un ulteriore calo del valore degli immobili. Insomma è prevedibile una drastica cura dimagrante dell’economia cittadina; per non parlare dello spopolamento, dell’invecchiamento della popolazione e della fuga dei giovani qualificati.
Urge un’idea di città
Una breve considerazione finale. E’ evidente che in assenza di un sostanziale cambiamento nella conduzione della politica economica locale e del sostegno del governo regionale e nazionale non saremo in grado di evitare in futuro lo stato di crisi. Urge un’idea e una visione di città diversa da quella appena tracciata, un piano di azione coraggioso in grado di allungare lo sguardo oltre i confini della nostra provincia. E’ necessario inoltre implementare rapidamente interventi di sistema per attrarre investimenti privati dall’esterno e assumere decisioni strategiche sulle infrastrutture necessarie per collegare la Sicilia e Messina al resto d’Europa. Primun vivere deinde administrare. Se la città è destinata a “collassare” quale consolazione può arrecare alle nostre menti il fatto di sapere che le strade saranno senza buche, le fontane zampillanti, la vita nei quartieri ordinata e i giardinetti -dove gli anziani sempre più numerosi si ritroveranno-, puliti e ornati da fiori dai vivaci colori?
1 settembre 2020
Lo sviluppo di Messina deve passare dall’area vasta dello Stretto
Abstract: Nella convinzione che Messina non possa chiudersi in ambito comunale ma debba ragionare “in grande”, occorre che lo sviluppo della città, sia pensato all’interno di una “area vasta”, nell’ambito della quale il comune di Messina sia chiamato a svolgere un ruolo di cerniera tra l’Area dello Stretto e i poli urbani e produttivi presenti nell’hinterland provinciale.
Keywords: Messina, sviluppo urbano, sviluppo del territorio, Area dello Stretto, rilancio economico.
Giuseppe Samonà affermava che “le necessità dello sviluppo economico (della città di Messina) pongono l’istanza fondamentale di proporzionare e ridimensionare i problemi economici e le conseguenti strutture alle esigenze e alle caratteristiche di un ambiente molto più vasto, cioè di un comprensorio il cui comune di Messina sia il naturale punto di convergenza per la sua posizione nello stretto come luogo di confluenza di tutti traffici terrestri tra la Sicilia e il continente e di una parte di quelli marittimi, secondo un potenziamento futuro nascente dall’esistenza del comprensorio stesso. Questo comprensorio racchiude tutta la provincia di Messina e la Calabria Sud-occidentale”.
Lo sviluppo della città, potremmo dire oggi utilizzando un lessico caro alla programmazione europea, va pensato all’interno di una “area vasta” con il comune di Messina chiamato a svolgere un ruolo di cerniera tra l’Area dello Stretto e i poli urbani e produttivi presenti nell’hinterland provinciale.
Di recente alcuni avvenimenti hanno dato forza e concretezza a questa prospettiva di sviluppo. E’ stata creata la Conferenza Permanente Interregionale per il Coordinamento delle Politiche nell’Area dello Stretto (nessuno ne parla più, ahimè!!!!.). Ma ancora più rilevante sul piano politico è stata l’istituzione dell’Autorità Portuale di Sistema dello Stretto, ente al quale è assegnata la governance delle infrastrutture, delle aree e dei servizi portuali. In ambito provinciale, poi, fondamentale è stato il riconoscimento dello status di città metropolitana alla ex-provincia di Messina; condizione “sine qua non” per poter sedere al tavolo ristretto del “club delle 15 città metropolitane italiane” ed avere accesso ai fondi del Master Plan.
Ora, è evidente che rispetto a questa prospettiva di area vasta si registra, da parte della amministrazione comunale e della classe dirigente cittadina, un calo di attenzione. Prevale, di contro, un impegno -quasi esclusivo- rivolto alla valorizzazione dei servizi locali, alla promozione di una cultura per un’economia “comunale” ancorata fermamente all’apparato pubblico (vero dominus della vita politica cittadina) e alla spesa pubblica locale. Osserviamo con preoccupazione la mancanza di proposte e progetti di respiro più ampio nel settore dei rifiuti, dell’energia, della mobilità, delle infrastrutture, del turismo, dei distretti produttivi (emblematica la vicenda della raffineria, Qui curat?), progetti che devono vedere protagoniste la città metropolitana di Messina, quella di Reggio Calabria e le forze produttive ancora presenti nel territorio.
Anche il recente annuncio da parte del sindaco De Luca della creazione di una fondazione per la promozione della cultura, in risposta alla decisione di lasciare TAO Arte, (paradossalmente il sindaco del comune di Messina è anche il Sindaco della città Metropolitana!) rischia di far passare l’idea che l’amministrazione della città di Messina persegua una politica isolazionista, un ritorno tra le strette mura delle città che conferisce probabilmente sicurezza e rafforza il consenso del nostro primo cittadino (come le recenti statistiche del sole 24 ore mostrano) ma che, come Samonà ci ricordava, non è assolutamente sufficiente a generare lo sviluppo futuro del nostro territorio; la città non può bastare a se stessa!!!
L’amministrazione comunale di Messina è chiamata ad assumere la leaderhip nel processo di costruzione di un sistema economico di area vasta; una leadership da conquistare attraverso l’iniziativa politica e la capacità di proposta progettuale; favorendo la partecipazione e individuando, con le altre amministrazioni comunali della città metropolitana, obiettivi comuni da perseguire; un riconoscimento, dunque, da guadagnare sul campo e non certo “dovuto” in ossequio ad una presunta superiorità culturale della “polis” messinese; superiorità, per la verità, che l’hinterland provinciale -in particolare- non ci ha mai riconosciuto.
07 October 2019
Economic Decisions and Simon’s Notion of Bounded Rationality
International Business Research, 11, 7, 2018, pp. 63-75.
Abstract: This paper focuses on Simon’s notion of bounded rationality, defined as the limitations and difficulties of the decision maker to behave in the way the traditional rational choice theory assumes, due to his insufficient cognitive and computational capacities to process all the relevant information.
Keywords: bounded rationality, economic decisions, expected utility, global rationality, procedural rationality, satisfying behavior.
Decision making in economics has been always intertwined with the concept of rationality. However, neoclassical economic literature has been dominated by a specific notion of rationality, namely, perfect rationality, characterized by the assumption of consistency and by the maximization hypothesis. Herbert Simon, in his long research activity, questioned this concept of perfect or global rationality, suggesting a different vision, based on empirical evidence and regarding an individual’s choices. He challenged the neoclassical theory of global rationality, suggesting his notion of bounded rationality, a satisficing (instead of optimizing) behavior, and the relevance of procedural rationality to understand the process of thought of decision makers.
The concept of rationality is central to economics. This concept passed through various stages, from the strong version of rationality of classical utilitarian economists to the weaker concept of revealed preference theory. However, economic literature has been dominated by the concept of rationality and its consistency feature, and by the maximization hypothesis. Herbert Simon is considered one the fathers of behavioral economics and a pioneer of artificial intelligence. In his long research activity in many scientific fields, including economics, he challenged mainstream economics by postulating, that “human rationality is bounded, due to external and social constraints, and internal and cognitive limitations”.
Simon developed the analysis of decision making related to both individuals and organizations. His theoretical contribution to the topic of economic decisions is the result of an interdisciplinary approach where economics, psychology, cognitive science, and organizational theory interact. Thus, Simon’s notion of bounded rationality became the central topic of this interaction between these discipline fields. This paper focuses on Simon’s notion of bounded rationality, defined as the limitations and difficulties of the decision maker to behave in the way the traditional rational choice theory assumes, due to his insufficient cognitive and computational capacities to process all the relevant information. Undoubtedly, many other authors adopted the label of bounded rationality in the literature to indicate some form of departure from rational choice theory. However, Simon used the term to refer to a more simplified vision of human decision making, by which he linked psychological factors to the decision maker’s economic behavior, and, thus, built his theoretical view on an empirical methodology. As a result, bounded rationality remains the hallmark of his theoretical contribution.
Thus, this paper focuses on Simon’s notion of bounded rationality. The work analyzes in depth Simon’s behavioral model of rational choice. It shows that Simon’s theory of bounded rationality includes three important steps: Search, satisfying, and procedural rationality. Simon’s bounded rationality theory explains the decisional processes that are adopted when it is not possible to choose the best alternative (i.e., fully optimized solution) because of decision makers’ limits in terms of information, cognitive capacity, and attention, and of the complexity of the environment in which decision makers make these decisions. In this environment, the individual searches and tries to make decisions that are good enough (i.e. satisfactory) and that represent reasonable or acceptable outcomes. Bounded rationality is not a derivative concept, but constitutes a basic and primary notion for a positive theory of choice in behavioral terms, linking the economic and the psychological sphere. Moreover, in Simon’s studies the computational aspect is very important, as also emotions can be encapsulated in the computational theory. In the bounded rationality approach, Simon does not look at the goal, but at the process that leads to an objective narrative. Hence, in this theoretical vision, the notion of procedural rationality becomes crucial. Finally, the paper offers an assessment of the notion of bounded rationality and its impact on economics and other social sciences. Despite its limited influence upon economics, Simon’s bounded rationality has transformed decision making theory across literatures and has had a major impact on institutional economics and other social sciences.
23 May 2019
Modeling the Dependence of Conditional Correlations on Market Volatility
Journal of Business and Economic Statistics, 34, 2, 2016, pp. 254-268.
Abstract: Several models have been developed to capture the dynamics of the conditional correlations between series of financial returns and several studies show that the market volatility is a major determinant of correlations. We extend some models to include explicitly the dependence of the correlations on the volatility. The models differ by the way in which the volatility influences the correlations.
Keywords: Dynamic conditional correlations, Markov switching, Minimum variance portfolio, Model confidence set, Forecasting
It is well known that in financial markets, during turmoil periods characterized by strongly negative returns and weak macroeconomic indicators, both variances and correlations of assets increase; see, for example, Ang and Bekaert (2002), Forbes and Chinn (2004), and Cappiello et al. (2006). The presumably existing strong relationship between correlation and volatility can be employed to improve the forecasting ability of conditional correlation models. This approach is of particular interest for practitioners, since the possibility to improve the forecasts of correlations is important in portfolio choice, hedging, and option pricing, as well as in accounting for spillover effects between markets. Hence, the aim of this research is to check if the impact of volatility on correlations is statistically and economically significant, and if it helps to improve the forecasting performance of conditional correlation models, rather than to understand why correlations increase during some periods and not or less so during other periods.
We use a broad portfolio of models to capture in different ways the dependence of the conditional correlations of a set of financial time series on the market volatility or on its regime.
In particular we extend the Dynamic Conditional Correlation (DCC) model of Engle (2002) in different ways: by including the volatility (or a variable measuring its regime) as an additive independent variable, or by including its effect through time-varying coefficients in the model. We use similar extensions of the Tse and Tsui (2002) dynamic correlation model, and the Dynamic Equi-Correlation (DECO) model of Engle and Kelly (2012). The dependence relation is also modelled by extending the Regime Switching Dynamic Correlation (RSDC) model of Pelletier (2006) to include the effect of the volatility (or its regime) in the transition probabilities. The influence of volatility or its regime on the correlations is contemporaneous (instead of lagged). To implement this idea, we construct one-step ahead forecasts of the volatility (or its regime) as the additional variable to include in the existing models, through linear or nonlinear, and direct or indirect effects.
Our approach is related to the factor ARCH model of Engle et al. (1990), where the correlations between asset returns implied by that model depend not only on their betas but also on the time-varying conditional variance of the market return. Our approach can be viewed as a reduced form one not involving the asset betas, since we let the conditional correlations be directly functions of the volatility or its regime.
The models are applied to two data sets. A detailed analysis is provided for a case with three assets, in order to illustrate in detail the main characteristics of the proposed models and the results. We extend the analysis to a data set consisting of the thirty assets composing the Dow Jones industrial index. The model comparisons are performed using statistical approaches, such as hypotheses tests, information criteria, and the model confidence set (MCS) method of Hansen et al. (2003). They are also done using an economic loss function, namely the minimum variance portfolio approach as in Engle and Colacito (2006), and through the evaluation of the economic significance of the volatility effect on correlations in the different models. Monte Carlo simulations are used to study the properties of some of the employed methods in the presence of model uncertainty. We mainly find that:
- The correlations are subject to changes in regime and are sensitive both to the level of volatility and the regime of volatility (high or low), in particular in terms of gains in minimum portfolio variance:
- Among the considered models that incorporate a volatility effect, those that do it through the regime variable allow us to find significant marginal impacts of market volatility on correlations;
- If we make a distinction between long-run and short-run correlations, the volatility affects the long-run ones, rather than the short-run ones;
- The volatility, or its regime, does not improve the forecasts of the correlations.
References
Ang, A., and Bekaert, G. (2002), “International Asset Allocation With Regime Shifts,” Review of Financial Studies, 15, 1137–1187.
Cappiello, L., Engle, R. F., and Sheppard, K. (2006), “Asymmetric Dynamics in the Correlations of Global Equity and Bond Returns,” Journal of Financial Econometrics, 4, 537–572.
Engle, R. F. (2002), “Dynamic Conditional Correlation: A Simple Class of Multivariate Generalized Autoregressive Conditional Heteroskedasticity Models,” Journal of Business and Economic Statistics, 20, 339–350.
Engle, R., and Colacito, R. (2006), “Testing and Evaluating Dynamic Correlations for Asset Allocation,” Journal of Business and Economic Statistics, 22, 367–381.
Engle, R. F., and Kelly, B. (2012), “Dynamic Equicorrelation,” Journal of Business and Economic Statistics, 30, 212–228.
Engle, R. F., Ng, V., and Rothschild, M. (1990), “Asset Pricing With a Factor ARCH Covariance Structure: Empirical Estimates for Treasury Bills,” Journal of Econometrics, 45, 213–237.
Forbes, C. S., and Chinn, M. D. (2004), “A Decomposition of Global Linkages in Financial Markets Over Time,” The Review of Economics and Statistics, 86, 705–722.
Hansen, P. R., Lunde, A., and Nason, J. (2003), “Choosing the Best Volatility Models: The Model Confidence Set Approach,” Oxford Bulletin of Economics and Statistics, 65, 839–861.
Pelletier, D. (2006), “Regime-Switching for Dynamic Correlation,” Journal of Econometrics, 131, 445–473.
Tse, Y. K., and Tsui, A. K. C. (2002), “A Multivariate GARCH Model With Time-Varying Correlations,” Journal of Business and Economic Statistics, 20, 351–362.
10 May 2019
TINDARA ABBATE, FABRIZIO CESARONI, MARIA CRISTINA CINICI, MASSIMO VILLARI
Business models for developing smart cities. A fuzzy set qualitative comparative analysis of an IoT platform
Technological Forecasting and Social Change, 2019, vol. 142, pp. 183-193.
Abstract: Which configurations of Business Model (BM) exist in an IoT platform aiming at smart cities’ development? We argue that BM configurations have general characteristics beyond individual firms’ unique traits. Our empirical findings (based on a fuzzy set qualitative comparative analysis) show BM’s causal complexity and reveal the most frequent patterns of association among value propositions and BM’s building blocks.
Keywords: Smart cities, Internet of things, Technology platform, Business model, Qualitative comparative analysis
During the last two decades, the number of projects focusing on smart cities that have been launched worldwide has constantly increased. The common trait of such projects is that they exploit the opportunities offered by innovative Information Technology (IT) solutions (and, especially, Internet of Things technology – IoT) to provide better and sustainable living conditions to citizens. As such, most of the attention has been devoted to technological aspects related to them. A smart cities project is usually made of a set of IT devices that exchange information among themselves within a common technology platform. Different actors (both private enterprises and public organizations) participate in this complex ecosystem, and the integration and coordination of their activities represent a major challenge for any project.
Albeit the technological aspects related to the functioning of the system do play a key role, the strategic actions of firms involved in the implementation of smart cities projects have to be properly investigated as well. As in the case of any emerging technology, firms struggle to find the best way to exploit the new market opportunities, by seeking the best configuration of resources and capabilities to design products and services that satisfy customer needs. In turn, they need to design and adopt proper and innovative Business Models (BMs), which are suited to the specificities of smart cities projects.
The term “business model” has gained popularity in the late 1980s spawning from e-commerce to a variety of empirical contexts. It is conceived as a conceptual tool or model able to figure out how firms generate and deliver value to customers, entice customers to pay for value, and convert those payments into profit. Since its original formulation, literature on BM has constantly grown. However, despite the number of research papers directed to exploring BM over the last two decades, structured research on BM associated to smart cities projects remains scarce. Particularly, theory-building work and empirical research beyond single-case studies is lacking.
Moving from this gap, this study addresses the following research question: What different configurations of BM exist in an Internet of Think (IoT) platform that aims at developing smart cities projects? Indeed, while BM shows path-dependency and is the result of firms’ own histories, BM configurations have general characteristics beyond the settings of individual firms. Therefore, the analysis of BMs that firms may adopt to exploit smart cities projects, should focus on the analysis of the best configurations of resources and activities.
In order to do so, we use a fuzzy set qualitative comparative analysis (fsQCA), which combines within-case analysis with formalized, systematic cross-case comparisons. In details, fsQCA has the potential to dig deeper in configurations, such as BM, to understand (1) what different types of cases may occur in a given setting by considering their similarities and differences, and (2) the complex causal relations underlying the emergence of the outcome of interest.
We apply this methodological approach to a setting composed of 21 Small and Medium Enterprises (SMEs) that have taken part to an EU funded Accelerator (named FIWARE) focused on smart cities. By applying fsQCA to collect data about firms’ activities and strategic goals, we explore what different types of BM can be successfully adopted by firms that exploit the potentiality of a novel IoT platform to develop smart cities solutions. In turn, we focus on and isolate the relationships existing among the building blocks that cause the emergence of those specific BMs.
Results of our study offer several relevant implications both for practice and theory. As for the former, on the one side, firms that intend to develop smart cities projects should offer customized products or services, and consider the cooperation with customer capabilities as the main key resource. Additionally, our findings encourage firms and startups to puzzle customer capabilities together with customer application development as key activities and customers as main partners. On the other side, we show that no consistent pattern is associated to “standardized products and services”, most likely because a dominant design has not emerged yet, and thus customization is compulsory.
As for theory, the contribution that this study offers to the BM literature is twofold.
On the one side, during the last decades, prior research has shown that firms may benefit from collaborations with external partners by allowing the in-flow of external technologies and technological competences. In fact, external technologies may be integrated with the internal technological base in order to generate new products/services and enhance the firm’s ability to create value. In the case of IoT or smart-cities’ technology platforms, firms’ BMs have to be adapted in order to achieve advantages for both technology suppliers and technology users. Specifically, we argue that multiple BMs can coexist within technology platforms, that is, BMs adopted by Platform Developers and BMs adopted by Platform Users. In the case of Platform Users, if upstream operators have made the platform general enough then the cost of technology adaptation that downstream software developers have to incur in to apply the GPT to the specific application need is expected to be lower than the cost that the same software developers should incur to fully develop the applications in-house, if the GPT platform were not present. The story of the technology platform described in this study can be interpreted in this sense: in the presence of an industry structure organized around a IoT and smart cities’ technology platform, also downstream operators have incentives to adopt a BM which is open to collaboration with external providers.
On the other hand, we suggest that platform users do not necessarily have to adopt a similar BM. In fact, several configurations of resources and activities may co-exist, guaranteeing success to the firms. This result extends prior literature on BMs applied to smart cities and IoT. We thus show that not all the configurations of building blocks permit firms to benefit from the opportunities offered by the emerging field of smart cities. A proper coherence between key resources, key activities and key partners is key in this respect.
8 May 2019
YINGHUA HE, ANTONIO MIRALLES, MAREK PYCIA, JIANYE YAN
A Pseudo-Market Approach to Allocation with Priorities
American Economic Journal: Microeconomics, vol. 10, n. 3, August 2018, pp. 272-314.
Abstract: We propose a pseudo-market mechanism for no-monetary-transfer allocation of indivisible objects based on priorities such as those in school choice. Agents are given token money, face priority-specific prices, and buy utility-maximizing random assignments. The mechanism is asymptotically incentive compatible, and the resulting assignments are fair and constrained Pareto efficient. Aanund Hylland & Richard Zeckhauser (1979)’s position-allocation problem is a special case of our framework, and our results on incentives and fairness are also new in their classical setting. (JEL D63, D82, H75, I21, I28).
Keywords: Allocation Problem, Cardinal Preferences, Pseudo-market, Priorities.
The aim of this paper is to study the allocation of indivisible objects where monetary transfers are precluded and agents demand at most one object. Examples include student placement in public schools (where an object corresponds to a school seat and each object has multiple copies) and allocation of work or living space (where each object has exactly one copy). A common feature of these settings is that agents are prioritized. For instance, students who live in a school’s neighborhood or have siblings in the school may enjoy admission priority at this school over those who do not, and the current resident may have priority over others in the allocation of the dormitory room he or she lives in. Due to the lack of monetary transfers, objects in these environments are very often allocated by a centralized mechanism that maps agents’ reported preferences to an allocation outcome. The outcome, known as assignment, can be either deterministic or random. The former dictates who gets what object, and the latter prescribes the probability shares of objects that each agent obtains and thus is a lottery over a set of deterministic assignments. The standard allocation mechanisms used in practice and studied in the literature are ordinal: students are asked to rank schools or rooms, and the profile of submitted rankings determines the assignment. However, Miralles (2008) and Abdulkadirog ̆ lu, Che, and Yasuda (2011) pointed out that we may implement Pareto-dominant assignments by eliciting agents’ cardinal utilities, which are their relative intensities of preferences over objects and their rates of substitution between probability shares in objects. Furthermore, Liu and Pycia (2012) and Pycia (2014) showed that sensible ordinal mechanisms are asymptotically equivalent in large markets, while mechanisms eliciting cardinal utilities maintain their efficiency advantage. Naturally, with more inputs, we expect a mechanism to deliver a better outcome, as cardinal preferences are more informative than ordinal ones. However, what has not been answered in the literature is how to use cardinal information efficiently. This paper aims to fill this gap by providing a novel cardinal mechanism to improve upon the ordinal mechanisms. The mechanism is asymptotically incentive compatible, fair, and constrained efficient among ex ante stable and fair mechanisms. A mechanism is ex ante stable if, in any of its resulting assignment, no probability share of an object is given to an agent with lower priority at this object whenever a higher priority agent is obtaining some probability shares in any of his/her less preferred objects (Kesten and Ünver 2015). Furthermore, every deterministic assignment that is compatible with an ex ante stable random assignment eliminates all justified envy and thus satisfies stability (Abdulkadirog ̆ lu and Sönmez 2003).
We use the strong fairness concept, equal claim, proposed by He, Li, and Yan (2015); a mechanism satisfies equal claim if agents with the same priority at an object are given the same opportunity to obtain it. We refer to our construction as the pseudo-market (PM) mechanism, which elicits cardinal preferences from agents and delivers an assignment. If it is a random assignment, one can then conduct a lottery to implement one of the compatible deterministic assignments. To map reported preferences into assignments, PM internally solves a Walrasian equilibrium, where prices are priority-specific and the mechanism chooses probability shares to maximize each agent’s expected utility given his/her reported preferences and an exogenous budget in token money. Budgets need not be equal across agents.
This Walrasian equilibrium used in the internal computation of the PM mechanism has a unique feature in its priority-specific prices: for each object, there exists a cutoff priority group such that agents in priority groups strictly below the cutoff face an infinite price for the object (hence, they can never be matched with the object), while agents in priority groups strictly higher than the cut-off face zero price for the object. By incorporating priorities in this manner, the PM mechanism extends the canonical Hylland and Zeckhauser (1979) mechanism, which requires every agent to face the same prices and thus does not allow priorities. It is also a generalization of the Gale-Shapley Deferred-Acceptance(DA) mechanism, the most celebrated ordinal mechanism. Essentially, when both agents and objects have strict rankings over those on the other side, the DA mechanism eliminates all justified envy; when-ever there are multiple agents in one priority group of an object, the tie has to be broken, usually in an exogenous way. The PM mechanism, instead, has ties broken endogenously and efficiently by using information on cardinal preferences. Agents with relatively higher cardinal preferences for an object obtain shares of that object before others who are in the same priority group. We show that the PM mechanism is well-defined in the sense that it can always internally find a Walrasian equilibrium and deliver an assignment given any reported preference profile. Moreover, the mechanism is shown to be asymptotically incentive compatible in regular economies, where regularity guarantees that Walrasian prices are well defined as in the classical analysis of Walrasian equilibria (see, e.g., Dierker 1974, Hildenbrand 1974, and Jackson 1992).
The PM mechanism allows one to achieve higher social welfare than mechanisms eliciting only ordinal preferences such as the DA and the Probabilistic Serial mechanisms; it is ex ante stable because of our design of the priority-specific prices. Given an object s and its cutoff priority group, whenever a lower priority agent obtains a positive share of s, a higher priority agent must face a zero price for s, and, therefore, is never assigned to an object they prefer less than s. We study fairness of the PM mechanism in the sense of equal claim, which requires that, for any given object, agents with the same priority are given the same opportunity to obtain this object.
Since prices for agents in the same priority group are by construction the same in the PM mechanism, we can conclude that equal claim is satisfied when agents are given equal budgets.
06 May 2019
L’Economia dei beni confiscati 
FrancoAngeli, Milano, 2014, pp. 138, ISBN: 9788820475031
Abstract: The goal of this book is to highlight that the confiscation of assets to organized crime is a way to create “social capital”. It shows that in many municipalities of Southern Italy, characterized by the presence of confiscated property and reused, there is greater consensus for political programs with issues concerning the “legality”. The “Probit” analysis takes into consideration a sample of 542 Italian municipalities.
Keywords: Sviluppo economico; capitale sociale; Economia del Mezzogiorno
L’ipotesi di partenza di questa ricerca, confermata dai risultati econometrici, è che vi sia da alcuni anni, nei territori dove sono presenti beni confiscati riutilizzati ai fini sociali, un senso di riscatto nei confronti della criminalità organizzata da parte della “società civile”. Non a caso, in molti Comuni del Mezzogiorno, caratterizzati da esperienze di riutilizzo sociale di beni immobili confiscati alla criminalità, i risultati elettorali per l’elezione del Sindaco hanno premiato partiti e/o movimenti civici alternativi a quelli tradizionali (sia di Centro-destra che di Centro-sinistra). Questo risultato è stato maggiormente evidente nei Comuni rientranti nel sistema elettorale caratterizzato da un turno di ballottaggio tra i candidati Sindaci. Infatti, per tali Comuni l’analisi empirica ha rilevato una significativa influenza della variabile “Immobili confiscati e gestiti” (proxy di “capitale sociale”) sui “Risultati elezioni a Sindaco”; connotando questa ricerca di rilevanti elementi di originalità nell’ambito della letteratura sul tema.